 Aqib Shafiq1
 Sheeraz Iqbal1*Anis Ur Rehman1
 Z. M. S. Elbarbary2,3
 Hossam Kotb4
 Ali Selim5
 Salah Kamel5,6*
- 1Department of Electrical Engineering, University of Azad Jammu and Kashmir, Muzaffarabad, AJK, Pakistan
- 2Electrical Engineering Department, College of Engineering, King Khalid University, Abha, Saudi Arabia
- 3Department of Electrical Engineering, Faculty of Engineering, Kafrelsheikh University, Kafrelsheikh, Egypt
- 4Department of Electrical Power and Machines, Faculty of Engineering, Alexandria University, Alexandria, Egypt
- 5Electrical Engineering Department, Faculty of Engineering, Aswan University, Aswan, Egypt
- 6Applied Science Research Center, Applied Science Private University, Amman, Jordan
The rapid development of electric vehicles (EVs) such as Easy Bike, Auto-Rickshaw, and Electric Bike is a major contributor to global energy concerns. Although electric vehicles are bringing a new dimension to the transportation sector, with advantages such as being the cheapest method of transportation and emitting fewer greenhouse gases (GHGs), the massive amounts of energy required to charge the electric vehicles is a challenging issue. Pakistan is also moving toward the use of electric vehicles however the absence of charging facilities in Pakistan slows down the charging process and increases the prices for electric vehicle users. Finding the requisite charging without threatening the current power infrastructure is one of the most challenging tasks of the present era. Renewable energy-based charging is required to fulfill the charging demand of electric vehicles. To find the best configuration to meet the necessary daily charging demand, this proposed work undertakes a techno-economic assessment for a novel renewables-based grid-tied charging station. The technical, economic and environmental impacts of Solar based grid-tied charging stations are taken into account. Moreover, the results are justified by considering the losses and building the system model. The suggested strategy decreases energy costs from $.200/kWh to $.016/kWh while reducing grid load by 254,030 kWh/yr. Furthermore, the system completes 7.7 charging sessions every day, using 13% of the electricity generated. The remaining 87% of the electricity is sold back to the grid, which generates significant revenue.
1 Introduction
Fossil fuels are used to meet the majority of the world’s energy needs. Natural gas, crude oil, coal, heavy oils, etc. account for nearly 85% of all energy production. The conditions of the atmosphere are being negatively impacted by these resources (Nabavi et al., 2021). Renewable Energy Resources (RERs) has several advantages over these resources. They are less expensive and emit the fewest pollutants gases. Moreover, with the trend of EVs, RERs based charging stations are catching the attention of users (Elavarasan et al., 2020; Shi et al., 2022). Due to their environmentally friendly nature and positive financial effects, EVs are currently becoming more and more popular around the globe. The need for EV charging stations is rising along with the insertion of EVs (Iqbal et al., 2019). There are two different approaches to charging EVs. One type of charging station uses the grid for its power supply, while the other type uses charging stations powered by renewable energy sources (Iqbal et al., 2020). Because it is not the best solution to produce electricity from coal and use that electricity to charge EVs, conventional charging schemes are not feasible. Instead, RERs based EVs charging stations are catching the attention of users (Zhang et al., 2018). RERs-based EV charging stations emit less amount of polluted gases and produce low-cost energy.
A few years ago, electric vehicles were introduced in Pakistan to reduce the excessive use of fossil fuels and the harmful emissions produced by electric cars. However, the energy needed to power these electric vehicles came from the grid and was used as fuel (Shafiq et al., 2022). The most significant disadvantage, however, was the intermittent and constrained supply of grid energy (Ganesan et al., 2020). However, this effect was also disregarded throughout the creation of charging stations, leading to a charging station that is extremely effective. Fast-charging stations will be required for longer EV travel distances, such as inter-regional travel (Iqbal et al., 2022a). For locals to use the stations, they should be situated in larger cities with a significant population of EV drivers. Planning for fast charging stations needs to be coordinated at the state level to align government or private EV routes (Nacu and Fodorean, 2019). A functional replacement and environmentally sustainable solution to the energy problem is the smart charging station for electric vehicles (Hu et al., 2021). Governments and non-governmental organizations are urging the use of RERs to reduce carbon emissions and combat climate change as the world’s resources are depleting. Both transportation and electric power must become more reliant on RERS (Guo et al., 2021). Electric vehicles are being created to lessen the pollution that is produced by motor vehicles. A promising alternative and environmentally sustainable solution to the energy crisis. The fuel needed for these EVs can be stored using solar energy and run through an electric vehicle smart charging station (Jena et al., 2022).
In Pakistan, the State of Azad Jammu and Kashmir is the area with the greatest potential for RERs. There is not a single EV charging station at the location. A feasibility study must be completed to encourage people to use charging stations based on RERs. The installation of an EV charging station at the University of Azad Jammu and Kashmir is considered in the proposed study.
The bundle of schemes has been proposed in the literature to study the environmental and financial impacts of RERs-based EVs charging stations. A study of Hybrid wind and battery systems for an island is studied by the author. The paper also discusses the transient power flow of the decentralized control scheme (Yoomak and Ngaopitakkul, 2021a; Lin and Fu, 2022) Another paper studied the solar system integration for the load lightening system that is based on the Nano grid scheme. The study gives the economic impact of the integration of solar-based lighting systems (Akhtar et al., 2021). The (Oladigbolu et al., 2020) depicted the environmental impact of solar energy and discussed how carbon emissions can be reduced with the integration of solar energy. The comparative analysis of RERs for the electrification of the rural area is depicted by the author (Rehman et al., 2020; Iqbal et al., 2022b). To enhance the energy economy a feasibility study has been suggested by the paper. The author also discusses the environmental, financial and technical perspectives of the system (Gautam et al., 2018; Iqbal et al., 2022c). The feasibility study for the grid-connected hybrid system is the future of the author (Kumar et al., 2019; ur Rehman et al., 2022). The comparative analysis of solar and biomass systems using Hybrid Optimization of Multiple Energy Resources (HOMER) is given in the paper. The study discusses the technical and economic impact of the integration of hybrid systems into the grid (Imam et al., 2020). Optimization of pumped storage systems and new energy units in the power grid is discussed in the paper (Sierra et al., 2020; Li et al., 2022). The performance analysis for the solar harnessing is given by the author and the depicted scheme is analyzed on HOMER (Minh et al., 2021). Artificial intelligence-based control and coordination scheme for multiple PV inverters installed in the power distribution network is discussed by the author (Zhang et al., 2018; Lin and Fu, 2022). The feasibility of the grid-connected PV system for the location of Saudi Arabia is discussed by the author (Jahangiri et al., 2019). The financial, technical and environmental impact of solar-based charging station in China is depicted in the paper (Yoomak and Ngaopitakkul, 2021b). Another work provides a load estimate model and an EV charging model to forecast the effects of diverse vehicle travel patterns on charging behaviour. The study also illustrates a charging/discharging method based on Markov Chain Monte Carlo (MCMC) that effectively deals with the forecast of EV driving patterns and addresses the challenges of high-power consumption during peak time (Amir et al., 2021). To maintain equilibrium of the distributed generating network and the grid side network, a d-q controller technique is proposed in (Mohammad et al., 2022). In the MPPT-based wind power producing station, where an induction generator creates power via optimum regulation of the wind energy-based subsystem, a dynamic control method of voltage source converter (VSC) is described. The output terminal of the distributed hybrid generation (solar PV and wind) subsystem is connected to the DC bus bar’s common connection through the VSC. The needed DC power is converted to alternating current power using a VSI. The simulation and hardware implementation of a low-cost residential EVSE based on the SAE J1772 standard are presented in paper (Shariff et al., 2020). This is accomplished by detecting and communicating with an electric vehicle using an Arduino microcontroller. The suggested system differs from existing EVSE in terms of cost and amperage adjustment for better load control. The resulting system is capable of detecting different states and communicating in accordance with the CCS standard.
Many plans have been put forth in the literature, but no such study has been proposed for the State of Azad Jammu and Kashmir. The King Abdullah Campus University of Azad Jammu and Kashmir Muzaffarabad is the location of the proposed work, and its objective is to construct and optimize a grid-connected renewables-based electric vehicle charging station depending on the EV charging load requirement. The following points are examined in the proposed study.
• Power production and consumption Summery of charging Station.
• Scheduling of EVs to decrease contingencies and achieve needed sessions.
• Scheduling of EVs to maximize solar energy use.
• The technical and economic impact of EVs charging stations.
• Pollution reduction.
• Modeling for the charging station.
Section 2 explains the cost formulation and system model while the results and discussion are arranged in Section 3. Finally, the paper is concluded in Section 4.
2 Model of the proposed system
Azad Jammu and Kashmir have a large solar energy potential. Before modeling charging stations, the cost formulation, atmospheric conditions, and system model should be considered. The cost formulation and system flow chart are described in this section.
2.1 Cost formulation
The cost formulation discusses the mathematical modeling of costs.
2.1.1 Cost of energy
The cost of energy of any system is defined by the cost per unit of energy and it can be written in the form of $/kWh. To calculate the cost of energy, AC and DC loads are defined separately and calculated through Eq. 1 (Zhang et al., 2018; Shi et al., 2022).
where COSTyr, total represents the total annualized cost, DCload and ACload are the AC and DC loads of the system, respectively.
2.1.2 Net present cost
The Net present cost of a system is the life cycle cost of a system. The net present cost can be calculated by subtracting the initial capital cost and operating cost from the revenue generated (Zhang et al., 2018; Shi et al., 2022).
where Cre.fac represents the capital recovery factor and Rproject_life is the revenue for the project lifetime.
2.1.3 Capital recovery factor
The capital recovery factor is the ratio of constant annuity ratio to the annuity ratio of a given year. It can be calculated by Eq. 3 (Zhang et al., 2018; Shi et al., 2022).
where i represents the annual interest rate and n is the number of years.
2.1.4 Power from the grid
The Renewable energy system is usually connected to the grid. It is not feasible to develop a standalone system with renewable energy resources. The power taken from the grid is calculated by Eq. 4,
where Pgrid is the power generated by the grid while Egen is the power produced by RERs.
2.1.5 Modeling of load profile
The electric load is usually mentioned in kW while the number of the unit it consumes is written in kWh. The energy demanded by the load in any system is calculated by Eqs 5, 6 (Zhang et al., 2018; Shi et al., 2022).
In the equations above, EDemand is the energy required to run the load LDemand for the time of Time(h).
2.2 Mathematic modeling of components
2.2.1 PV modules
PV modules are semi-conductor modules that convert solar radiation into electrical energy. The production of electrical energy is estimated by Eq. 7 (Zhang et al., 2018; Shi et al., 2022).
where Ppv is the power produced by PV and G is the grief time. Tref is the reference time while Tamb gives the ambient temperature. NOCT is the normal operating cell temperature of the PV module.
2.2.2 Power converters
The power converters are installed with PV modules to convert Ac power into DC and vice versa. The mathematical modeling and efficiency of the power converter are explained in Eq. 8 (Zhang et al., 2018; Shi et al., 2022).
where ηcnv is the efficiency of the converter, Poweroutput and Powerinput are the output power and input power of the converter, respectively.
2.2.3 Storage agent
In the proposed work, batteries are used as storage agents and they store extra energy during the excess production by PVs. When the power production of PVs is decreased the extra energy is provided by the battery backup (Zhang et al., 2018; Shi et al., 2022).
where Edemand is the energy demand by the system, while Egen is the amount of energy generated by the system. In the Equations, ηBD gives the charge and discharge efficiencies of the batteries. The σ is the self-discharge of batteries and ηcnv is the converter efficiency.
2.3 Flowchart of the proposed work
The flowchart of the proposed work is briefly explained in Figure 1. In the first phase, the described location is added to the software. Solar resources, temperature and clearness index for the mentioned location are taken into account. The different profiles of EVs are added to the system to check the response under different conditions. The cost of the system is estimated in the next step which includes COE, NPC and initial capital cost. The production and consumption summary for the proposed system is also analyzed. Then the results are verified by developing the model on Helioscope software. The energy production, revenue generation and losses are discussed in the results by Helioscope.
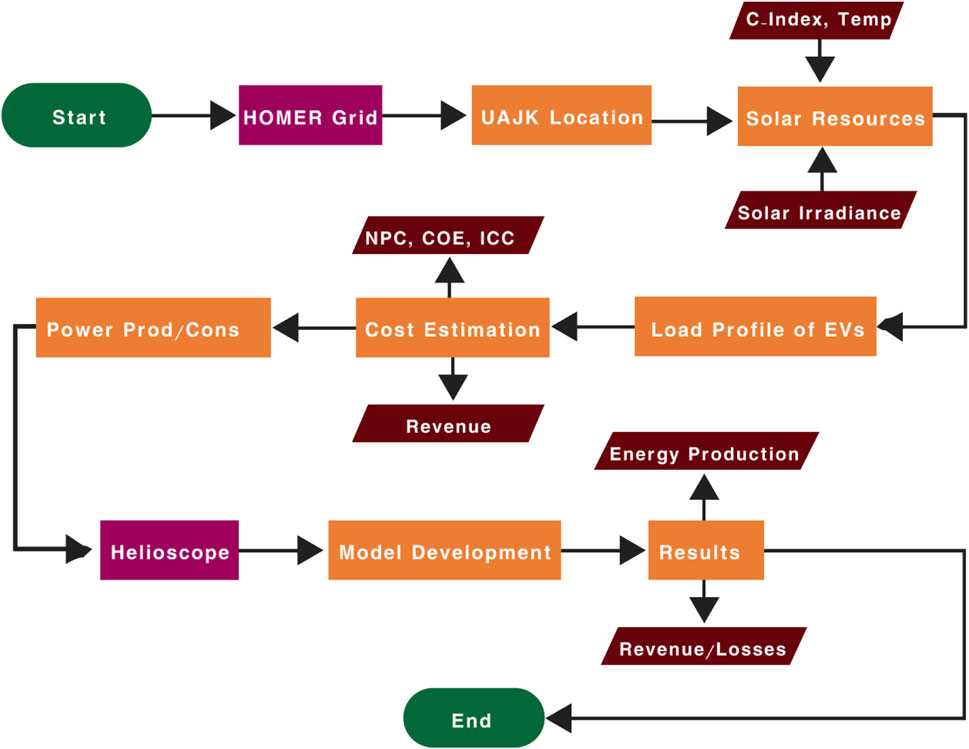
FIGURE 1. Flowchart for the proposed work.
2.4 Research methodology
For designing and optimizing solar PV-based EV charging stations in the King Abdullah Campus University of Azad Jammu and Kashmir Muzaffarabad, HOMER Grid and Heliscope software are used. The characteristics of various electric vehicles have been researched and taken into account. Analysis has been done on the designing and optimization of various electric vehicle charging station schemes. The use of solar energy and electric vehicles is both economical and environmentally friendly. This contributes to a decrease in the use of fossil fuels, a decrease in carbon emissions, and the incorporation of renewable energy sources into the existing grid systems. The proposed work’s goal is to create a solar-powered grid-connected charging station that lowers energy costs and carbon emissions. The net present cost and annualized cost were analyzed and optimized in the proposed study to demonstrate that our system is more cost-effective than the existing system. A discussion of the electrical generation and consumption summary demonstrates how generated electricity is sold back to the grid via net metering. This study compares and analyses various data to design an ideal charging facility.
2.4.1 Site description for solar charging station
The Azad Jammu and Kashmir University’s King Abdullah Campus is taken into account. The location has a lot of solar energy potential with a large parking area available where electric vehicles can be parked and charged. Employers are permitted to park their EVs in the charging station during business hours. Figure 2 shows the exact location.

FIGURE 2. King Abdullah Campus University of Azad Jammu and Kashmir.
2.4.2 Solar resources
The King Abdullah Campus University of Azad Jammu and Kashmir has a lot of solar resources, which are described in detail in Table 1. The clearness index for the location in question has an average value of .607, indicating that the weather is typically clear. Additionally, the location has the optimal solar irradiance of 5.08 kWh/m2, which is needed to generate electricity. The area’s average temperature is 16.96°C, which is close to the ideal temperature for electricity production.
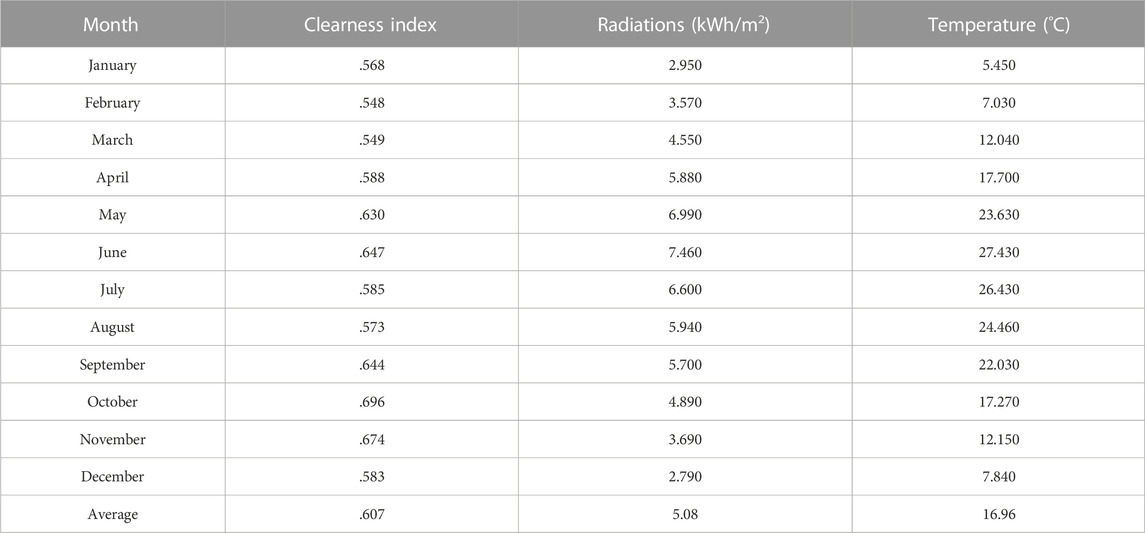
TABLE 1. King Abdullah Campus University of Azad Jammu and Kashmir, Muzaffarabad.
2.4.3 Charging station design for EVs
A PV-based charging station is part of the suggested system model. The six charging slots and PV inverters are additional system components. After the PV system was installed, a PV inverter was used to maintain power flow by controlling the charge. While one of the inverters supplies the extra energy to the grid by converting DC to AC. The charging station has six charging slots that can simultaneously charge six different vehicles. Figure 3 provides a brief explanation of the proposed charging station design. Different EVs are used at the charging slots to analyze responses with different profiles of EVs.
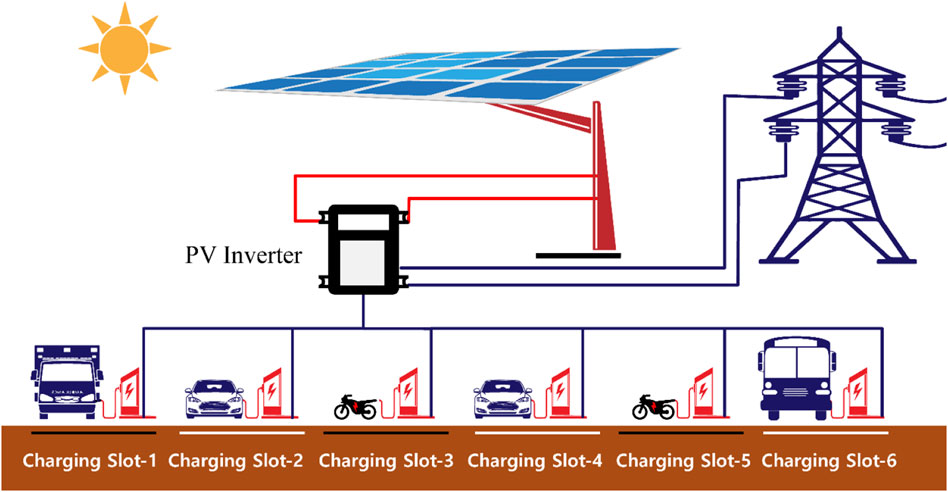
FIGURE 3. Design for the EV charging station.
2.4.4 System model
The system model includes the quantitative analysis of the proposed system which is described in Table 2. In the proposed system, Generic Flat plate PV of 150 kW has been used. The efficiency of Generic flat plate is better than other solar plates which motivates its use in the proposed system. The system converter of 118 kW is installed to assist the system. The system model is depicted in Figure 4 in detail.
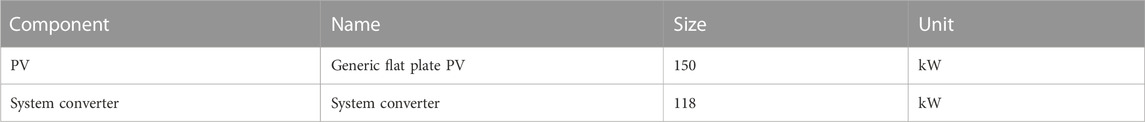
TABLE 2. Components size for the proposed system.
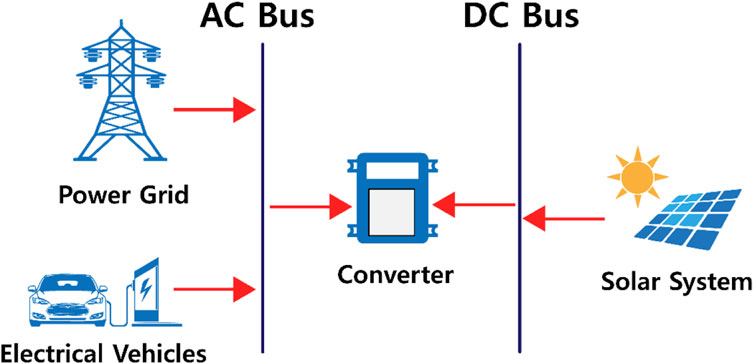
FIGURE 4. System model of the proposed work.
The Power Grid and EVs are connected to the AC bus while Solar System is connected to DC bus. The converter is used to convert DC power produced by the PV system into AC.
2.4.5 Load profile
The average connection time for a charger is still 7 h, but its output power is 35 kW. The charging stations have eight chargers, and there are often 8 sessions each day. There are 5 electric bikes at the charging station, and two 24 kW electric cars are also a part of the system. There is also a 33 kW ambulance load in the system. Detail analysis of the EVs is presented in Table 3.
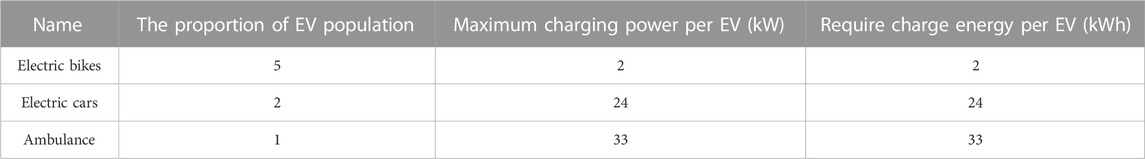
TABLE 3. Load profile of EVs.
Figure 5 shows the daily load profile of the system with an average load of 89 kWh/day. The system has a load of 9 kW from 8:00 a.m. to 10:00 a.m. After that, the load increased to the value of 14 kW from 10:00 a.m. to 2:00 p.m. From 2:00 p.m. to 4:00 p.m., the load again reduces to the value of 4 kW.
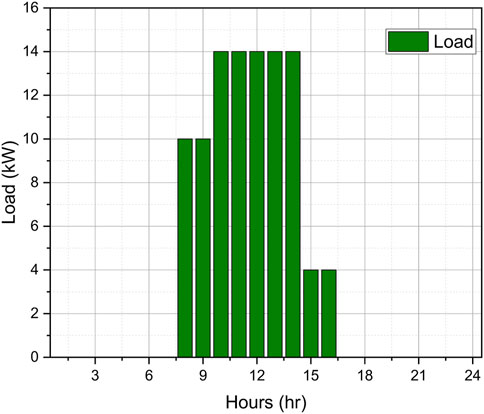
FIGURE 5. Average daily load profile.
3 Results and discussions
3.1 HOMER grid
3.1.1 Net present cost of system
The net present cost is a key factor in the cost estimation of a system. The HOMER Grid places NPC highly among the other cost criteria. The overall cost calculation can be tested by NPC. The HOMER grid accounts for all costs, including functional costs, installation costs, replacement costs, maintenance costs, penalty emissions costs, and energy costs for the duration of the activity when calculating NPC. The NPC value for a system that is cost-effective should be low; if it is high, the system is uneconomical.
The capital cost of the generic flat plate PV is $52,500 while the operating cost of the PV system is $19.39. The system provides a negative operating cost because power is provided to the grid. The system generates revenue from the grid instead of taking power from the grid. The system produces $536,827 in revenue during the project’s lifetime. The capital cost of the system converter is $35,522 while the system has a replacement cost of $15,071 as well. The total capital cost of the system is $88,022 and the system generated revenue of $436,552 over 25 years. Table 4 briefly explains the system’s NPC.
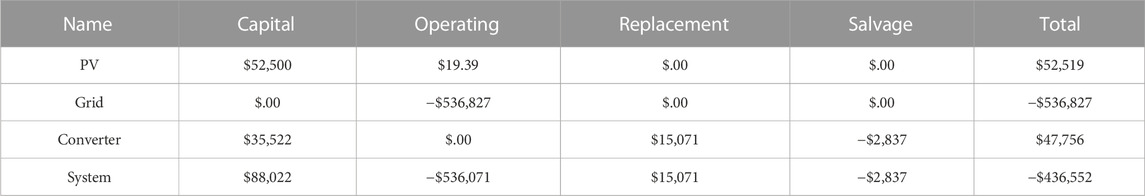
TABLE 4. Net present cost of the proposed system.
3.1.2 Annualized cost of the system
The annualized cost of a component is the cost that, if it were to occur equally in every year of the project lifetime, would give the same net present cost as the actual cash flow sequence associated with that component. HOMER G calculates the annualized cost by first calculating the net present cost, then multiplying it by the capital recovery factor.
The total annualized cost of the system is $33,769 which means the system generates that amount in the form of revenue during a year. The capital cost of the system for a year is $6,809 while the system operating cost is a negative figure. The system’s operating cost is $41,524. The annualized capital cost of the PV system is $4,061 while the capital cost of the inverter is $2,748. Table 5 depicts the annualized cost of the system.
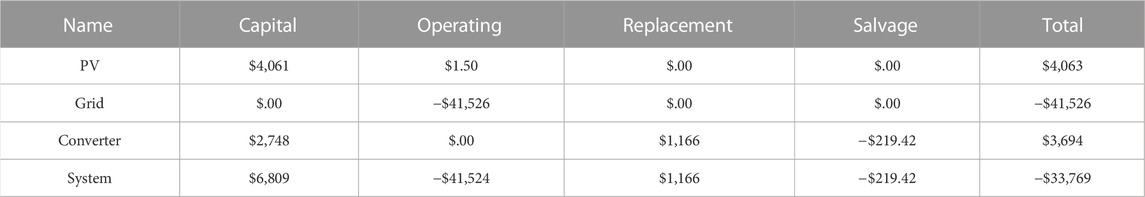
TABLE 5. Annualized cost for the proposed system.
3.1.3 Power production summery of proposed system
For the Generic flat plate PV summary, the minimum and maximum output power of the solar system have been analyzed. The total hours of operation for a PV system are 4,385 while the system produces maximum output of 150 kW. In the proposed system, the total production is 254,030 kWh per year. The cost of energy for the proposed system is $.0160/kWh. Table 6 explains the power production summary in detail.
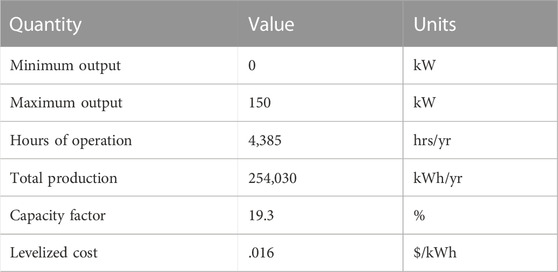
TABLE 6. Power production summary for the proposed system.
The mean output of the PV system is 29.0 kW while the system produces 696 kWh/d on an average basis. The capacity factor of the system is 19.3 while the total production of energy is 254,030 kWh/yr. The amount of energy purchased, energy sold, peak load and energy charges for each month and the whole year are discussed in Table 6 below. The system produces less amount of revenue for February of value −$2,637. The system faces peak load during May. During the month of May the peak load increased to 103 kWh. The system produces maximum revenue in the month of October by producing 21,002 kWh of energy. The system generates revenue of $4,200 for the month of October. On an annualized basis, the system produces 210,282 kWh of energy and buys the 2,652 kWh from the grid. The system sold 207,630 kWh of energy on an average basis. The peak load of the system remains 103 kWh on average. The system generates revenue of $41,526 for the whole year which is mentioned in Table 7.
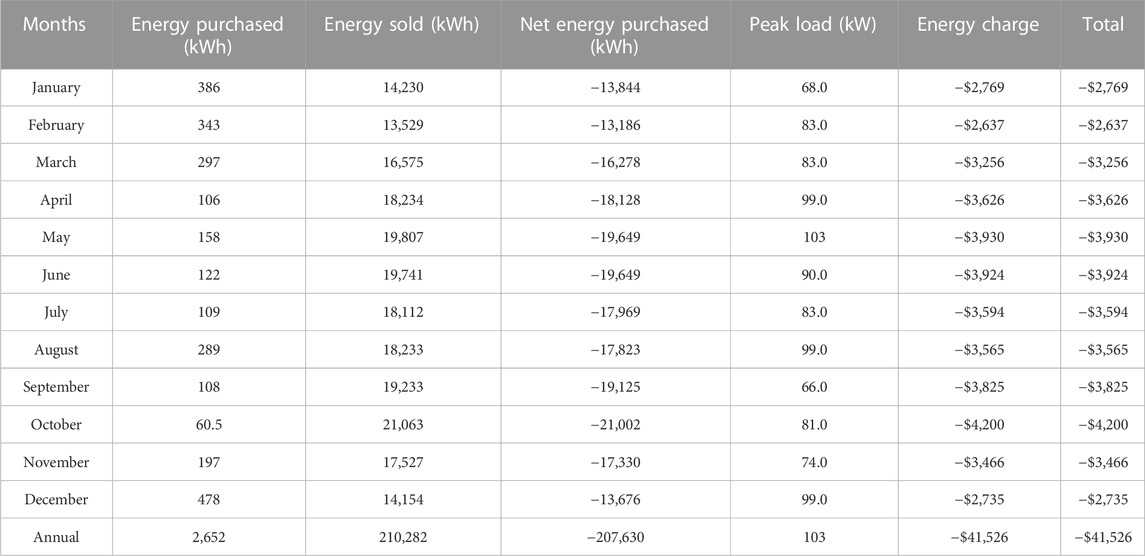
TABLE 7. Analysis of energy production for the whole year in the proposed scheme.
3.1.4 Base case electric bill
The annualized Energy purchased in Based Case is 32,326 kWh with the maximum in December of 3,194 kWh which is depicted in Table 8. The minimum amount of energy purchased in February of 2,408 kWh. The annualized energy charge is $6,465 which means that most of the energy is purchased from the grid in the base system.
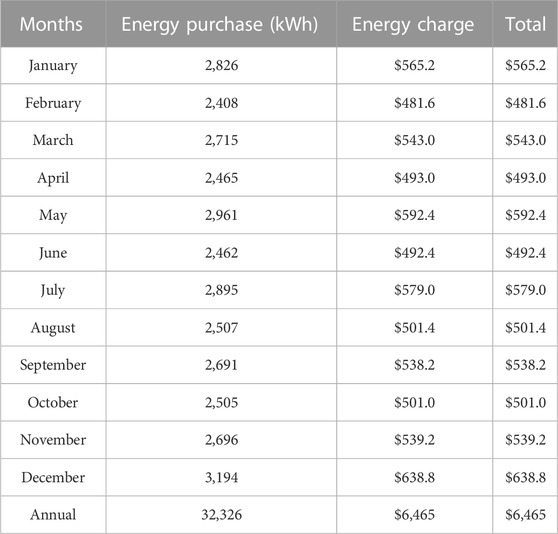
TABLE 8. Energy report for the base case.
3.1.5 Comparison of base case and proposed system
While comparing the results of the proposed system and base system it can be analyzed that the proposed system is better in any aspect. The net present cost of the base system is $83,579 which is a positive value which means this amount should be invested in the system. On the other hand, the net present cost of the proposed system is −$436,552 which means the system generates that amount in the form of revenue. The annualized energy charge of the proposed system is −$41,526 which means the system produces revenue instead of investing in the system. The cost of energy proposed has decreased to the value of −$.139 as compared to the cost of the base system of $.20. The proposed system also produces less amount of CO2 emission of 1,676 kg/yr while the base system produces 20,430 kg/yr of CO2. Table 9 shows the comparison of the Base Case with the proposed system.
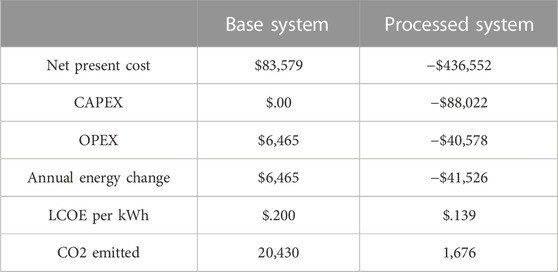
TABLE 9. Comparison of the base case with the proposed system.
3.1.6 Cost analysis of the proposed system
The proposed system achieves a bill saving of $47,991 every year. The initial capital cost can be recovered within 2 years considering discounted payback and 1.83 years on simple payback. In the electrical summary analysis, the production and consumption of the charging facility have been analyzed. According to the table mentioned below the production of the generic flat PV discussed is 254,030 kW-hours per year. Energy purchased from the grid is only 2,625 kW-h per year. In the consumption section, it is explained that the energy sold to the grid is 210,282 kW-h per year which are 86.7 percent of the total energy generated. The energy served to EV chargers is 33.236 kW-h per year which is only 13.3 percent of the total energy. Figure 6 depicts the cost analysis of the proposed system.
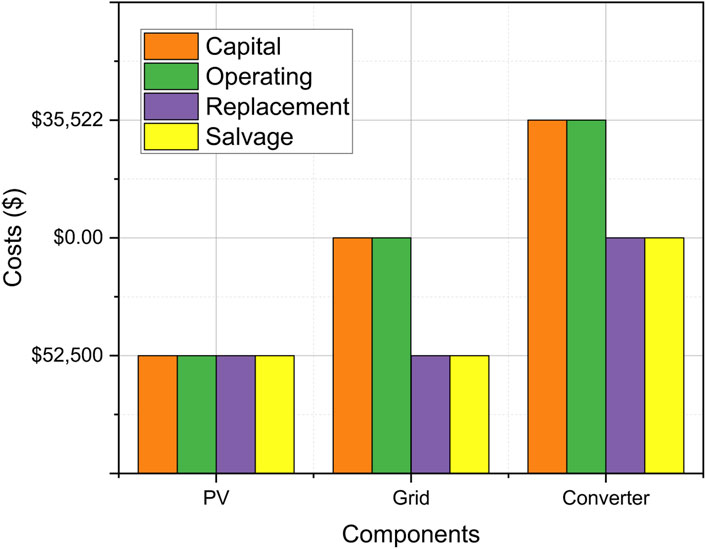
FIGURE 6. Cost analysis of the proposed system.
3.1.7 Production and consumption summary
The proposed system produces 254,030 kWh of energy from the PV system. The system purchases 2,652 kWh/yr from the grid which means the system produces 90% of its production from solar energy while only 10% of its energy is taken from the grid. The findings indicate that the proposed system generates the majority of its power. Most of the time, the system sells power back to the grid rather than consuming it. The power production of the PVs is mentioned in Table 10.
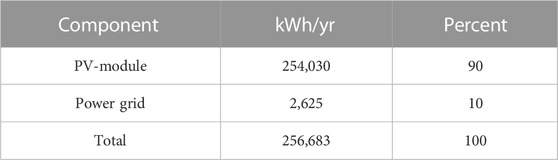
TABLE 10. Power production of PVs and grid.
Table 11 explains the electrical load detail of the system. The system uses the amount of energy produced, for EV charging. 13.3% of the energy is used for the charging purpose while 86.7% of energy is sold back to the grid. The system as a total uses 210,282 kWh/yr for grid sale and 33,236 kWh/yr for EV charging.
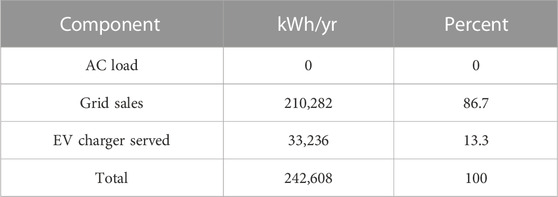
TABLE 11. Electric load details.
3.1.8 Charging scheduling
2,811 sessions take place in total each year, with 32,326 kWh of energy being consumed. Every session receives 11.5 kWh of electricity on average. On average, 7.7 sessions happen per day. The system’s peak power is 103.0 kW, and its utilization rate is 28%.
In January, 100 KWh of energy was distributed, with 8 sessions taking place each day. In February, 122 kWh of energy was used for charging, which translates to 15.3 kWh of energy used each charging session. The amount of energy used for charging is reduced to 91 kWh in March and April. The scheduling from January to April is further explained in Figure 7.
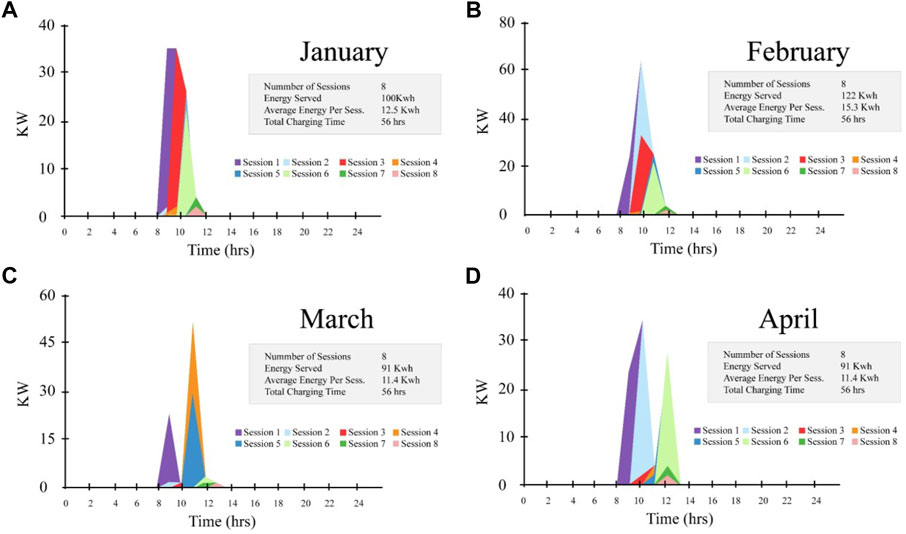
FIGURE 7. Energy scheduling (A) January, (B) February, (C) March and (D) April.
In the month of May, there are 8 sessions every day, which uses 69 kWh of energy, or 8.6 kWh of energy per session. In June, eight charging sessions per day consume 122 kWh of electricity. Eight sessions that each use 100 kWh of energy take place in the month of July. In August, 47 kWh of energy is used to charge electric vehicles. It can be observed that the majority of charging sessions take place during the day, when solar generation is at its peak. The EVs are designed to take use of solar energy. As can be seen on the graph, not a single session took place at night. The scheduling from May to August is further explained in Figure 8.

FIGURE 8. Energy scheduling (A) May, (B) June, (C) July and (D) August.
Figure 9 shows the scheduling for the last four months. In comparison to other months, the amount of energy used for charging in the month of September is 133 kWh. Each session uses 19 kWh of energy and there are 8 sessions each day. Sessions on October 7 take place and use 36 kWh of energy. The 89 kWh of energy is used up during November’s 7 sessions, using 12.7 kWh of energy per session. In the 8 sessions in December, 122 kWh of energy is consumed. The reason for just seven sessions in October and November is that the output from solar energy is lower during these months. However, the frequency of charging sessions has not dropped, with just one session missed on average in these months.
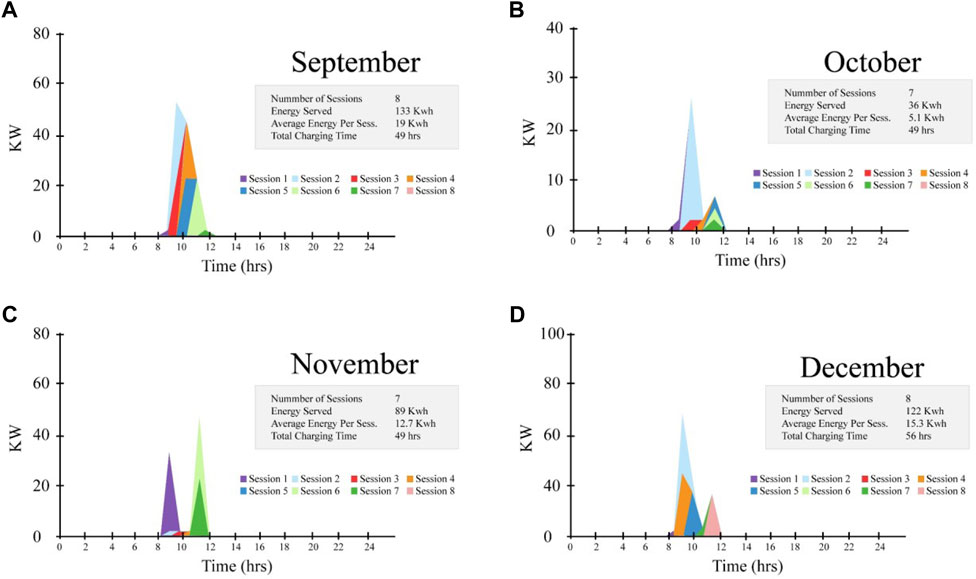
FIGURE 9. Energy scheduling (A) September, (B) October, (C) November and (D) December.
3.2 Designing of solar PV based charging facility using Helioscope
3.2.1 Detailed layout of the system
The implementation of the charging station via HOMER grid is confirmed by the Helioscope following the feasibility study. The PV system of 150 kW is installed at the location with the help of a 120 kW inverter. The same system is designed on the Helioscope that is found to be the feasible one by HOMER. The performance ratio of the system remains 70.2% while the system produces 215.9 MWh annually. Table 12 shows the quantitative analysis of the components.
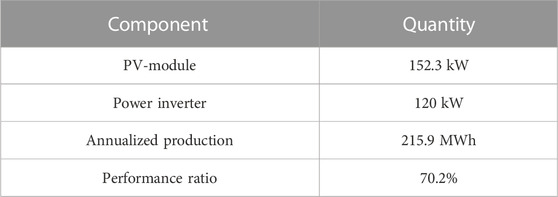
TABLE 12. Quantitative analysis of components.
3.2.2 Monthly production
The HOMER software predicts an annualized production of 254,030 kWh, whereas the Helioscope predicts an annualized production of 215,900 kWh as shown in Figure 10. The configuration of both systems is the same, but the production levels differ for reasons related to power loss consideration. While HOMER did not, the Helioscope does take into account loss. The maximum monthly production as predicted by Helioscope occurs in June, while the lowest PV power production occurs in December. The HOMER also projects that power output will be at its highest in June and its lowest in December.
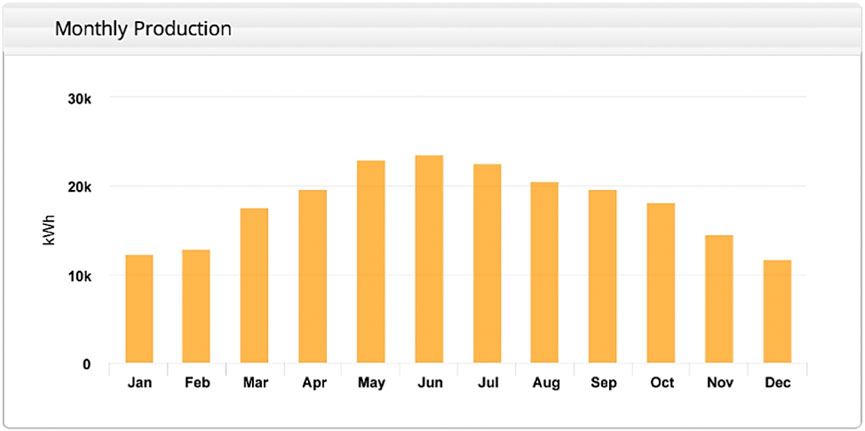
FIGURE 10. Monthly power production estimated by Helioscope.
3.2.3 Annualized PV production
Helioscope forecasts a 215,945 kWh annualized PV production that is sold to the grid. Because Helioscope takes losses into account, its estimate of power production is lower than HOMER’s. The ambient temperature is still 17.1 C, while the average temperature of the PV cells is still 29.1 C. The system will run for 4,562 h per year, or an average of 12 h per day. Estimated annualized power generation is further expressed with the help of Figure 11.
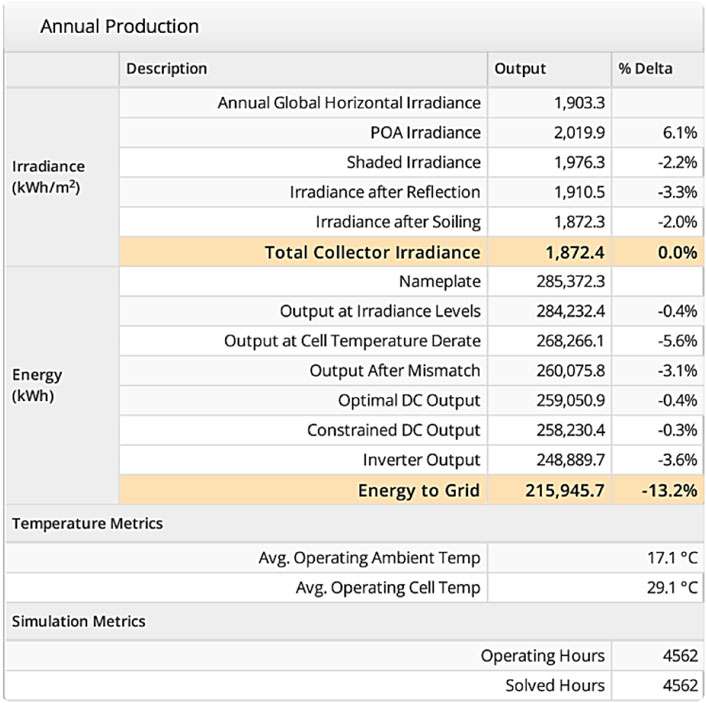
FIGURE 11. Estimated annualized power generation by PV system.
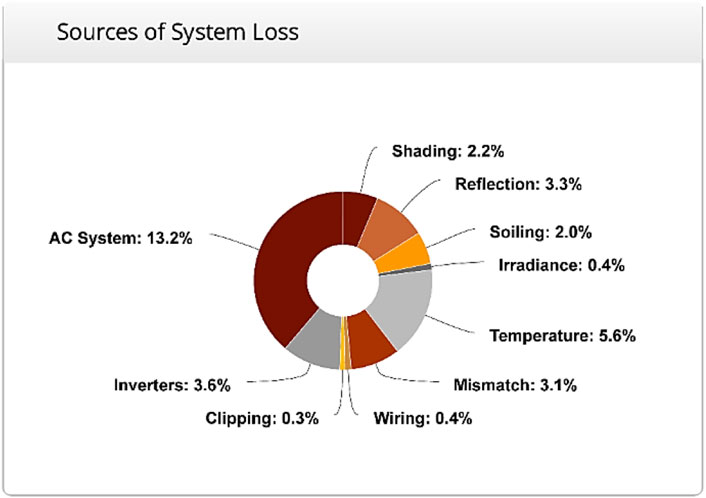
FIGURE 12. Losses in the proposed System.
3.2.4 Losses in the proposed system
As previously discussed, loss consideration is the reason why the power production of PVs predicted by Helioscope is less than that predicted by the HOMER. Figure 7 for the system includes a detailed description of the power losses. 13.2% of the system’s AC losses are due to power inverter losses, which total 3.6%. The shading will cause losses of 2.2% and reflection losses of 3.3% to happen as a result of light reflection. The system also has irradiance losses of .4% and soiling losses of 2.0%. 5.6% of the system’s losses are caused by changes in temperature, and 3.1% of the system’s losses are due to mismatches. The system experiences clipping and wiring loss of .7%, for a total loss value of 34.1% as shown in Figure 12.
3.2.5 System layout
The King Abdullah Campus UAJK’s longitude and latitude are 34.209°N and 73.50°E. Figure 13 depicts the site where the planned research would be conducted. The site provides a large open area where the solar panel can be deployed. Helioscope is used to create the installation model for the charging station. The 152 kW system is installed using 34 frames, each of which contains 14 modules. There are 476 modules in use in the system as a whole. The system that converts AC to DC has a 120 kW system converter installed.
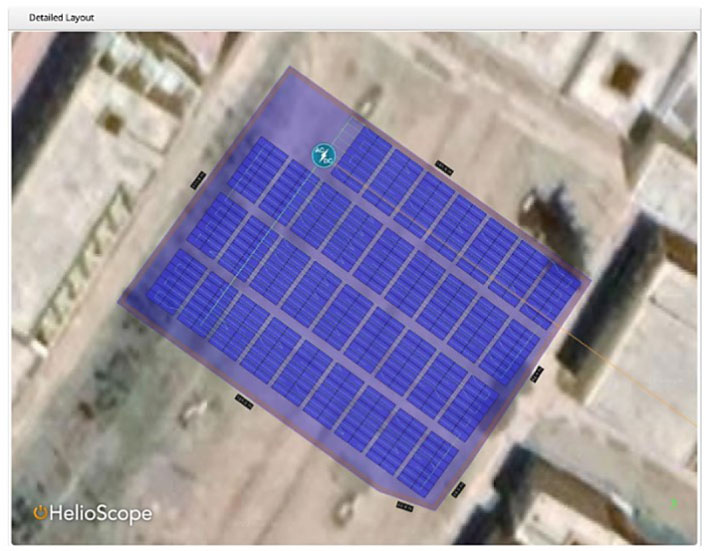
FIGURE 13. System layout.
4 Conclusion
The need for solar-based EV charging is increasing due to numerous advantages. Before the installation of Solar based EV charging station feasibility of the project has been analyzed. In the feasibility study technical financial and environmental aspects have been discussed. The University of Azad Jammu and Kashmir has huge potential for solar energy and need a charging station for the EVs charging of employers. The feasibility of the system is checked by the HOMER grid software and later verified by the Helioscope. The HOMER grid predicts energy production of 254,030 KWh/yr while Heliscope verified the production by estimating energy production of 215,945 kWh/yr. The distinction is brought about by the loss consideration, as Helioscope takes into account system power loss while HOMER does not. Helioscope forecasts system losses of 34.1%, primarily due to temperature loss, inverter loss, and AC system loss. Additionally, the HOMER and Helioscope analyze the monthly power output of PVs. The system will earn $436,552 in revenue throughout the project after installation costs have been covered. Only 13.3% of the energy is used for charging; the remaining 83.7% is sold back to the grid. Additionally, the price of energy has dropped from $.200/kWh to $.016/kWh. The impact of solar charging station integration on the power distribution network may be evaluated in the future. In the future, the voltage variation and power losses caused by the solar-powered charging station can be addressed.
Data availability statement
The raw data supporting the conclusion of this article will be made available by the authors, without undue reservation.
Author contributions
All authors listed have made a substantial, direct, and intellectual contribution to the work and approved it for publication.
Funding
This paper is based upon work supported by Science, Technology and Innovation Funding Authority (STDF) under grant number (43180).
Conflict of interest
The authors declare that the research was conducted in the absence of any commercial or financial relationships that could be construed as a potential conflict of interest.
Publisher’s note
All claims expressed in this article are solely those of the authors and do not necessarily represent those of their affiliated organizations, or those of the publisher, the editors and the reviewers. Any product that may be evaluated in this article, or claim that may be made by its manufacturer, is not guaranteed or endorsed by the publisher.
Abbreviations
EVs, Electrical Vehicles; GHGs, Greenhouse Gases; RERs, Renewable Energy Resources; COE, Cost of Energy; NPC, Net Present Cost; AC, Alternating Current; DC, Direct Current; PV, Photovoltaic.
References
Akhtar, I., Kirmani, S., Jameel, M., and Alam, F. (2021). Feasibility analysis of solar Technology implementation in restructured power sector with reduced carbon footprints. IEEE Access 9, 30306–30320. doi:10.1109/ACCESS.2021.3059297
Amir, M., Din, Z. U., and Haque, A. (2021). “Optimal scheduling of charging/discharging power and EVs pattern using stochastic techniques in V2G system,” in 2021 IEEE Transportation Electrification Conference (ITEC-India), New Delhi, India, December 16–19, 2000, 1–6. doi:10.1109/ITEC-India53713.2021.9932455
Elavarasan, R. M., Shafiullah, G., Padmanaban, S., Kumar, N. M., Annam, A., Vetrichelvan, A. M., et al. (2020). A comprehensive review on renewable energy development, challenges, and policies of leading Indian states with an international perspective. IEEE Access 8, 74432–74457. doi:10.1109/ACCESS.2020.2988011
Ganesan, S., Subramaniam, U., Ghodke, A. A., Elavarasan, R. M., Raju, K., and Bhaskar, M. S. (2020). Investigation on sizing of voltage source for a battery energy storage system in microgrid with renewable energy sources. IEEE Access 8, 188861–188874. doi:10.1109/ACCESS.2020.3030729
Gautam, J., Ahmed, Md. I., and Kumar, P. (2018). “Optimization and comparative analysis of solar-biomass hybrid power generation system using homer,” in 2018 International Conference on Intelligent Circuits and Systems (ICICS), Phagwara, India, April 19–20, 2018, 397–400. doi:10.1109/ICICS.2018.00087
Guo, Z., Wei, W., Chen, L., Dong, Z. Y., and Mei, S. (2021). Impact of energy storage on renewable energy utilization: A geometric description. IEEE Trans. Sustain. Energy 12 (2), 874–885. doi:10.1109/TSTE.2020.3023498
Hu, J., Liu, X., Shahidehpour, M., and Xia, S. (2021). Optimal operation of energy hubs with large-scale distributed energy resources for distribution network congestion management. IEEE Trans. Sustain. Energy 12 (3), 1755–1765. doi:10.1109/TSTE.2021.3064375
Imam, A. A., Al-Turki, Y. A., and Sreerama kumar, R. (2020). Techno-economic feasibility assessment of grid-connected PV systems for residential buildings in Saudi arabia—a case study. Sustainability 12 (1), 262. doi:10.3390/su12010262
Iqbal, S., Xin, A., Masood, A., Jan, M. U., ur Rehman, H., Rizvi, S. A. A., et al. (2019). “Impact of charging station operator (CSO) on V2G method for primary frequency control (PFC) in an industrial microgrid,” in 2019 IEEE 3rd Conference on Energy Internet and Energy System Integration (EI2), Changsha, China, November 8–10, 2019 (IEEE), 100–105.
Iqbal, S., Xin, A., Jan, M. U., Salman, S., Zaki, A. U. M., Rehman, H. U., et al. (2020). V2G strategy for primary frequency control of an industrial microgrid considering the charging station operator. Electronics 9 (4), 549. doi:10.3390/electronics9040549
Iqbal, S., Habib, S., Khan, N. H., Ali, M., Aurangzeb, M., and Ahmed, E. M. (2022). Electric vehicles aggregation for frequency control of microgrid under various operation conditions using an optimal coordinated strategy. Sustainability 14 (5), 3108. doi:10.3390/su14053108
Iqbal, S., Jan, M. U., Rehman, A., Shafiq, A., Muhammad, A., Haseeb, A., et al. (2022). Feasibility study and deployment of solar photovoltaic system to enhance energy economics of king Abdullah Campus. IEEE Access 10, 5440–5455. doi:10.1109/ACCESS.2022.3140723
Iqbal, S., Habib, S., Ali, M., Shafiq, A., Ahmed, E. M., Khurshaid, T., et al. (2022). The impact of V2G charging/discharging strategy on the microgrid environment considering stochastic methods. Sustainability 14 (20), 13211. doi:10.3390/su142013211
Jahangiri, M., Nematollahi, O., Haghani, A., Raiesi, H. A., and Alidadi Shamsabadi, A. (2019). An optimization of energy cost of clean hybrid solar-wind power plants in Iran. Int. J. Green Energy 16 (15), 1422–1435. doi:10.1080/15435075.2019.1671415
Jena, C., Guerrero, J. M., Abusorrah, A., Al-Turki, Y., and Khan, B. (2022). Multi-objective generation scheduling of hydro-thermal system incorporating energy storage with demand side management considering renewable energy uncertainties. IEEE Access 10, 52343–52357. doi:10.1109/ACCESS.2022.3172500
Kumar, S., Upadhyaya, P., and Kumar, A. (2019). “Performance analysis of solar energy harnessing system using homer energy software and PV syst software,” in 2019 2nd International Conference on Power Energy, Environment and Intelligent Control (PEEIC), Greater Noida, India, October 18–19, 2019, 156–159. doi:10.1109/PEEIC47157.2019.8976665
Li, C., Shan, Y., Zhang, L., Zhang, L., and Fu, R. (2022). Techno-economic evaluation of electric vehicle charging stations based on hybrid renewable energy in China. Energy Strategy Rev. 41, 100850. doi:10.1016/j.esr.2022.100850
Lin, Y., and Fu, L. (2022). A study for a hybrid wind-solar-battery system for hydrogen production in an islanded MVDC network. IEEE Access 10, 85355–85367. doi:10.1109/ACCESS.2022.3193683
Minh, P. V., Le Quang, S., and Pham, M.-H. (2021). Technical economic analysis of photovoltaic-powered electric vehicle charging stations under different solar irradiation conditions in vietnam. Sustainability 13, 3528. doi:10.3390/su13063528
Mohammad, A., Anjani Kumar, P., and Refaat Shady, S. (2022). Dynamic performance evaluation of grid-connected hybrid renewable energy-based power generation for stability and power quality enhancement in smart grid. Front. Energy Res. 10. doi:10.3389/fenrg.2022.861282
Nabavi, S. A., Motlagh, N. H., Zaidan, M. A., Aslani, A., and Zakeri, B. (2021). Deep learning in energy modeling: Application in smart buildings with distributed energy generation. IEEE Access 9, 125439–125461. doi:10.1109/ACCESS.2021.3110960
Nacu, R. C., and Fodorean, D. (2019). “Battery cells characterization for subsequent operation in battery models used in mobile charging station designing,” in 2019 Electric Vehicles International Conference (EV), Bucharest, Romania, October 3–4, 2019, 1–5. doi:10.1109/EV.2019.8892858
Oladigbolu, J. O., Ramli, M. A. M., and Al-Turki, Y. A. (2020). Feasibility study and comparative analysis of hybrid renewable power system for off-grid rural electrification in a typical remote village located in Nigeria. IEEE Access 8, 171643–171663. doi:10.1109/ACCESS.2020.3024676
Rehman, S., Natrajan, N., Mohandes, M., Alhems, L. M., Himri, Y., and Allouhi, A. (2020). Feasibility study of hybrid power systems for remote dwellings in Tamil nadu, India. IEEE Access 8, 143881–143890. doi:10.1109/ACCESS.2020.3014164
Shafiq, A., Iqbal, S., Habib, S., Selim, A., Ahmed, E. M., Kamel, S., et al. (2022). Solar PV-based electric vehicle charging station for security bikes: A techno-economic and environmental analysis. Sustainability 14 (21), 13767. doi:10.3390/su142113767
Shariff, S. M., Alam, M. S., Faraz, S., Khan, M. A., Abbas, A., and Amir, M. (2020). “Economic approach to design of a level 2 residential electric vehicle supply equipment,” in Advances in power and control engineering. Editors S. Singh, R. Pandey, B. Panigrahi, and D. Kothari (Singapore: Springer), Vol. 609. Lecture Notes in Electrical Engineering. doi:10.1007/978-981-15-0313-9_3
Shi, Z., Wang, W., Huang, Y., Li, P., and Dong, L. (2022). Simultaneous optimization of renewable energy and energy storage capacity with the hierarchical control. CSEE J. Power Energy Syst. 8 (1), 95–104. doi:10.17775/CSEEJPES.2019.01470
Sierra, A., Gercek, C., Geurs, K., and Reinders, A. (2020). Technical, financial, and environmental feasibility analysis of photovoltaic EV charging stations with energy storage in China and the United States. IEEE J. Photovolt. 10 (6), 1892–1899. doi:10.1109/JPHOTOV.2020.3019955
ur Rehman, A., Ali, M., Iqbal, S., Shafiq, A., Ullah, N., and Otaibi, S. A. (2022). Artificial intelligence-based control and coordination of multiple PV inverters for reactive power/voltage control of power distribution networks. Energies 15 (17), 6297. doi:10.3390/en15176297
Yoomak, S., and Ngaopitakkul, A. (2021). Development of sustainable nanogrid road lighting systems. IEEE Trans. Intell. Transp. Syst. 22 (11), 6682–6699. doi:10.1109/TITS.2020.2994088
Yoomak, S., and Ngaopitakkul, A. (2021). Development of sustainable nanogrid road lighting systems. IEEE Trans. Intelligent Transp. Syst. 22 (11), 6682–6699. doi:10.1109/TITS.2020.2994088
Zhang, J., Zhang, Y., Li, T., Li, K., Jiang, L., Yin, K., et al. (2018). “A hierarchical distributed energy management for multiple PV-based EV charging stations,” in IECON 2018 - 44th Annual Conference of the IEEE Industrial Electronics Society, Washington, DC, USA, 21-23 October 2018, 1603–1608. doi:10.1109/IECON.2018.8591742
Keywords: solar energy, electric vehicles, power distribution, HOMER grid, charging scheduling
Citation: Shafiq A, Iqbal S, Rehman AU, Elbarbary ZMS, Kotb H, Selim A and Kamel S (2023) Integration of solar based charging station in power distribution network and charging scheduling of EVs. Front. Energy Res. 11:1086793. doi: 10.3389/fenrg.2023.1086793
Received: 01 November 2022; Accepted: 03 January 2023;
Published: 12 January 2023.
Edited by:
Zineb Bounoua, Sidi Mohamed Ben Abdellah University, MoroccoReviewed by:
Mohamed Salem, University of Science Malaysia (USM), MalaysiaMohammad Amir, Jamia Millia Islamia, India
Suprava Chakraborty, Vellore Institute of Technology (VIT), India
Salem Al-Ameri, University of Technology Malaysia, Malaysia
Imane Hammou Ou Ali, Mohammed V. University, Morocco
Copyright © 2023 Shafiq, Iqbal, Rehman, Elbarbary, Kotb, Selim and Kamel. This is an open-access article distributed under the terms of the Creative Commons Attribution License (CC BY). The use, distribution or reproduction in other forums is permitted, provided the original author(s) and the copyright owner(s) are credited and that the original publication in this journal is cited, in accordance with accepted academic practice. No use, distribution or reproduction is permitted which does not comply with these terms.
*Correspondence: Salah Kamel, c2thbWVsQGFzd3UuZWR1LmVn; Sheeraz Iqbal, c2hlZXJhei5pcWJhbEBhamt1LmVkdS5waw==