 Volker Hannstein
 Matthias Behler
 Romain Henry
- Gesellschaft für Anlagen- und Reaktorsicherheit (GRS) gGmbH, Forschungszentrum, Garching, Germany
The burn-up code MOTIVE is a 3D code for fuel assembly inventory determination developed at GRS in recent years. It modularly couples an external Monte Carlo neutron transport code to the in-house inventory code VENTINA. In the present publication, we report on the validation of MOTIVE with respect to full-assembly decay heat measurements of light water reactor fuel. For this purpose, measurements on pressurized water reactor and boiling water reactor fuel assemblies from different facilities have been analyzed with MOTIVE. The calculated decay heat values are compared to the measured data in terms of absolute and relative deviations. These results are discussed and compared to other published validation analyses. Moreover, the observed deviations between measurements and calculations are analyzed further by taking into account the results of the validation of nuclide inventory determination with MOTIVE. The influence of possible biases of calculated nuclide densities important to decay heat at the given decay times are investigated and discussed.
1 Introduction
The precise calculation of the decay heat of irradiated nuclear fuel from commercial reactors has gained renewed interest in recent years. This was mainly driven by technical requirements in the fields of interim storage of used fuel as well as final repository planning and safety analysis. The current research efforts mainly focus on enhancing the precision of decay heat calculations and identifying sources of uncertainty. A recent blind benchmark exercise organized and coordinated by the Swedish Nuclear Fuel and Waste Management Company (SKB) (Jansson et al., 2022) drew additional attention to the topic. In this benchmark decay heat measurements of five fuel assemblies were compared with calculations provided by numerous international participants using different codes and nuclear data libraries. One conclusion from this exercise was the need for additional high quality experimental data and for a thorough analysis to further improve computational methods and the underlying nuclear data. An important aspect in this respect is the validation of computer codes used to determine the decay heat of irradiated nuclear fuel. The paper at hand presents such an analysis for the burnup code MOTIVE developed at GRS.
2 Methods and data
2.1 Simulation code
The code MOTIVE has been described in more details in Hannstein et al. (2017) and Hannstein et al. (2019). It is being developed at GRS with the main purpose of allowing for an independent analysis of the nuclide inventory of used nuclear fuel and derived quantities like, e.g., decay heat. These types of calculations provide important input data to safety analyses in the field of nuclear fuel transport and storage and related topics. MOTIVE provides a modular coupling of a continuous energy Monte Carlo neutron transport codes for flux calculation to a 0D depletion code for nuclide inventory determination thus allowing for high-fidelity 3D analysis of single fuel assemblies or arrays thereof. It features several predictor-corrector schemes and is flexible in terms of the nuclear data libraries used. Currently, couplings to the Monte Carlo codes KENO-VI of SCALE6.2 (Rearden and Jessee, 2016) and OpenMC (Romano et al., 2015) are implemented. For the step of nuclide inventory determination the 0D depletion code VENTINA (Mala, 2018) is used. VENTINA solves the Bateman equations describing the time evolution of nuclide concentrations due to neutron irradiation and decay processes, using several well established numerical methods with the default method being the Chebishev Rational Approximation Method (CRAM) (Pusa and Leppänen, 2010).
2.2 Experimental data
The present analysis focusses on decay heat measurements performed on commercial Light Water Reactor (LWR) fuel assemblies. Historically, there are only three facilities which have published such data, namely, Hanford Engineering Development Laboratory (HEDL) (Creer and Shupe Jr., 1981; Wiles et al., 1986), General Electric Morris (GE-Morris) Operations facility (Strickler and Doman, 1982), and the Swedish Central Interim Storage Facility for Spent Nuclear Fuel (CLAB) operated by the Swedish Nuclear Fuel and Waste Management Company (Svensk Kärnbränslehantering AB, 2006). Of these only the CLAB facility is still operational today. The HEDL measurements were performed with a boil-off calorimeter whereas the measurements at GE-Morris laboratories and at CLAB were performed with pool calorimeters.
The validation analysis reported here mainly focusses on the CLAB measurements which are much more recent than the other two data sets. In order to extend the range of analyzed cooling times, the CLAB data are complemented by the GE-Morris measurements of assemblies from the Cooper reactor. It is planned to further extend the set of validation data by also analysing the remaining GE-Morris data in the future. An additional extension of the validation data set may be possible in case more experimental data from the CLAB facility will become publicly available.
Regarding the measurements at CLAB, the experimental uncertainties have been reported to be in the range of 2%–4% for the pressurized water reactor (PWR) assemblies and 2%–8% for the boiling water reactor (BWR) assemblies (Svensk Kärnbränslehantering AB, 2006). The experimental uncertainties for Cooper BWR assemblies are in the range of 4.7%–5.9% for the combined reported systematic and statistical uncertainties (Strickler and Doman, 1982). Additional information on the analyzed fuel assemblies are given in Table 1.
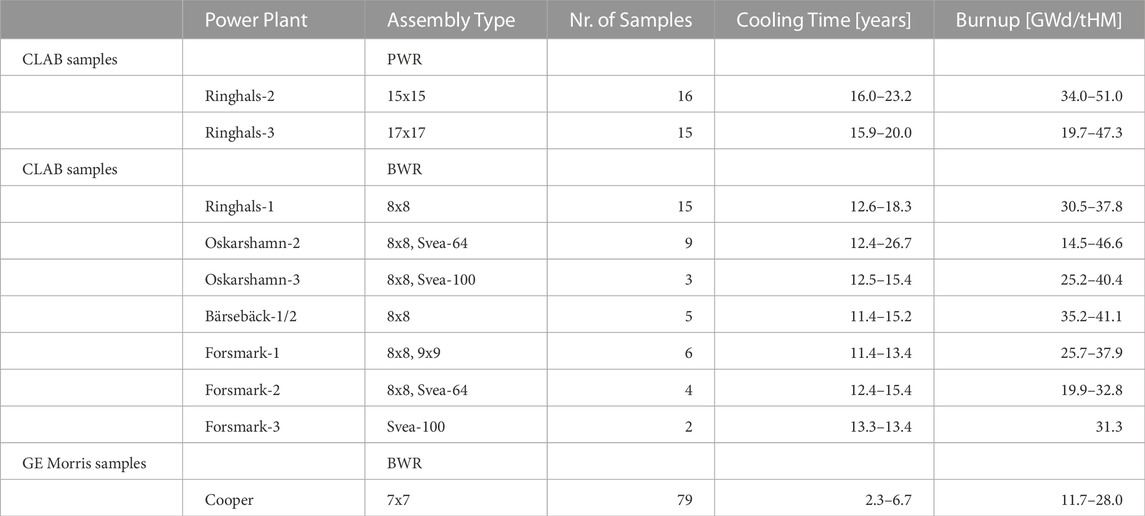
TABLE 1. Summary of decay heat measurement samples used for the validation.
The set of analyzed measurements contains 154 samples in total of which 31 are PWR fuel assembly samples and 123 are BWR fuel assembly samples. The PWR assemblies have burnups between 19.7 and 51 GWd/tHM and the burnups of the BWR assemblies are in the range of 14.5–41.1 GWd/tHM (CLAB) and 11.7 to 28 GWd/tHM (Cooper, GE-Morris). As mentioned before, the cooling times of the Cooper assemblies (2.3—7.2 years) and the CLAB assemblies (11.4—26.7 years) cover different ranges. This is important since the nuclides which contribute most to the total decay heat change with cooling time (see, e.g., (Žerovnik et al., 2018)). An illustration of this fact is presented in Figure 1 which shows the most important contributors to decay heat in the range of 1 to 100 years for a PWR fuel assembly with UO2 fuel of 4.6 wt% initial enrichment in 235U and a burnup of 60 GWd/tHM. For both sets of samples the nuclides 137mBa, 137Cs, 90Y, 90Sr, 244Cm, 238Pu, and 154Eu are relevant. For the cooling times of the Cooper samples also 134Cs, 106Rh, 144Pr, and 144Ce play a significant role, whereas for the cooling times of the CLAB samples 241Am, 240Pu, and to some extent 239Pu become important.
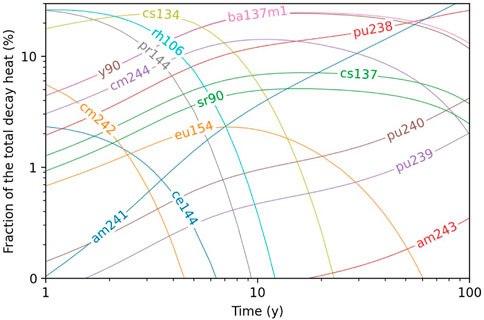
FIGURE 1. Relative contributions of the most important nuclides to total decay heat for cooling times between 1 and 100 years as obtained from an example calculation for a 16x16 PWR UO2 fuel assembly with an initial enrichment of 4.6 wt% 235U and a burnup of 60 GWd/tHM.
2.3 Calculational approach
The validation calculations were performed with version 1.0.6 of the MOTIVE burnup code system applying the Monte Carlo code OpenMC in version 0.10.0 for neutron flux calculation and using nuclear data from the ENDF/B-VIII.0 data evaluation. In the nuclide inventory calculation the full set of nuclides available in the decay data library was used and the decay heat was calculated by summing up the contributions of all nuclides. The thermally recoverable decay energies for each decay process needed in the decay heat calculation were also taken from the ENDF/B-VIII.0 library (Brown et al., 2018). For the purpose of the neutron flux calculation, the fuel assemblies were modelled in a 2D geometry on a single assembly level with reflective boundary conditions. The full geometry information available for the assemblies was taken into account in the models, separately defining all fuel materials with different enrichments at their respective pin positions. All individually defined fuel materials were depleted separately. The final assembly-wise nuclide inventory was determined by averaging over all individual fuel materials at the end of the calculation. Example geometry models for some of the fuel assemblies are shown in Figure 2. The power history was modelled as accurately as possible taking into account the data given in (Wiles et al., 1986) and (Svensk Kärnbränslehantering AB, 2006). For the CLAB samples the assembly burnup values are given for each cycle. These values were used to calculate the assembly power individually in each cycle. In the case of the Cooper samples only a global power history in terms of the core average power is given. For the calculations, this power history was adjusted for each fuel assembly by rescaling it with a single factor such that the reported final burnup value was reached for each assembly. This approach, which was adopted due to the unavailability of more detailed data, neglects the possibly significant deviation of the assembly-wise power values from the core average power. However, at the cooling times of interest the exact modelling of the power levels in each cycle only plays a minor role.
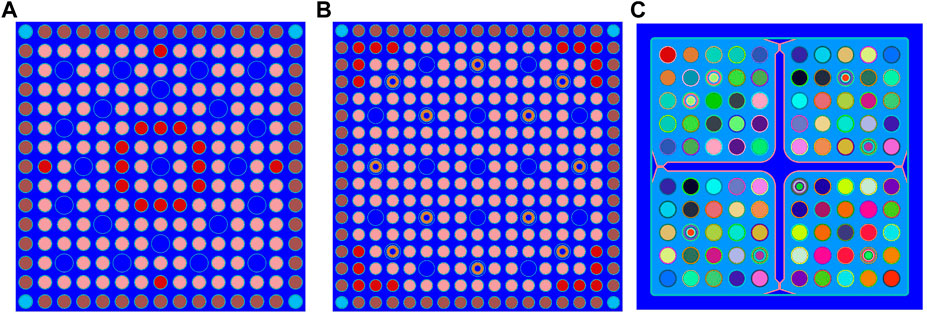
FIGURE 2. Example fuel assembly models used in the calculations. (A) 15x15 PWR Assembly: Ringhals-2 (B) 17x17 PWR Assembly: Ringhals-3 (C) SVEA-100 Assembly: Forsmark-3.
Due to the lack of reliable information on material impurities the contribution from the activation of structural components of the fuel assemblies was neglected in this work. The corresponding decay heat is dominated by 60Co which has a half-life of 5.3 years. According to (Yamamoto and Iwahashi, 2016) the influence of activation should be negligible for the Cooper assemblies, due to zircaloy being used for the spacer grids instead of inconel. For the cooling time range of the CLAB assemblies the contribution should be small. (Yamamoto and Iwahashi, 2016) report on a 0.5% contribution of 60Co to the total decay heat at typical cooling times.
In general, a precise determination of the decay heat should explicitly take into account axial burnup profiles. For the range of decay times considered here, the calculation of fuel assembly decay heat with a single calculation using the average burnup of the assembly will lead to a slight underprediction compared to a calculation in which the axial burnup distribution is taken into account (see also (Ilas and Gauld, 2008) and (Kromar and Godfrey, 2022)). This is due to the fact that, for a given cooling time, decay heat is increasing slightly stronger than linearly with increasing burnup. On the other hand, dividing the calculation into multiple axial levels may lead to a significantly higher computational effort.
Since the CLAB PWR fuel assembly data contains information on the axial power profiles, the effect discussed above was studied in some detail during this work. For one sample measurement, assembly F14 from Ringhals2, this was done by performing separate 2D calculations for the reported 24 axial zones and subsequently averaging over the individual 2D calculations to obtain the assembly decay heat value. This value was compared to the result obtained from a single calculation for the whole assembly.
It was found that very accurate results compared to detailed analyses with separate calculations for all 24 axial levels can be achieved by performing only four calculations per fuel assembly: One calculation using the average burnup of the topmost and the lowermost axial level as the target burnup, two further calculations using the average burnup of the second and the third axial level from top and bottom, respectively, and one calculation using the average burnup of the remaining 18 innermost axial zones. The results of the individual calculations are combined taking into account the volume of the respective zone to obtain the overall fuel assembly decay heat. With this approach the resulting fuel assembly decay heat is within 1 W of the result obtained with full axial resolution, for the investigated sample. In principle, an optimization of the axial subdivision of the burnup profiles may lead to an even better result for the decay heat prediction. For example, a finer resolution in the top and bottom parts of the active zone might be helpful in that direction. However, it should be stressed again, that the present analysis relies on the data and zoning given in (Svensk Kärnbränslehantering AB, 2006), since there is not sufficient information for performing a separate core simulation. The given subdivision into 24 zones of equal size is a standard approach for core simulations.
The mentioned deviation from linear relation between burnup and decay heat for fixed cooling time is due to a non-linear evolution of some nuclide concentrations with burnup. For the range of parameters relevant for the samples investigated here, the strongest effect originates from 244Cm and 238Pu. These nuclides show an exponential build-up with burnup, 238Pu making a transition to linear growth at around 30 to 40 GWd/tHM, thus having a higher relative contribution total decay heat at higher burnups compared to lower ones. The evolution of the concentrations of these two nuclides with burnup is shown in Figure 3 for the example of sample F32 from Ringhals-2 for illustrational purposes. The relative contribution of 244Cm rises from 4% at 33 GWd/tHM to 18% at 54 GWd/tHM in this case. A similar behaviour is also seen for the other CLAB samples.
However, since for most of the other samples used in this work no axial profiles are available, a single averaged calculation is used for each of the CLAB PWR samples in the context of the validation for consistency reasons. Moreover, it has to be stated that the approach with a single calculation per sample leads to less than 1% smaller decay heat values compared to the more accurate approach with four calculations per sample. This has been tested on all CLAB PWR samples.
3 Results
The results of the validation are presented using the relative deviation between calculation (C) and experiment (E) C/E-1 in percent and the absolute differences C-E in Watts. A general overview is given in Figures 4A–C which show the absolute differences separately for the CLAB PWR samples, the CLAB BWR samples, and the Cooper BWR samples together with the reported 1σ experimental uncertainties (dashed lines). As can be seen from Figure 4A, most of the PWR calculations slightly overestimate the measured values with all except three values being within the 1σ experimental uncertainty boundaries. The average relative deviation is 0.4% with a standard deviation of 1.0%. The differences for the CLAB BWR data (see Figure 4B) are almost evenly distributed around zero and mostly within the 1σ experimental errors. The average relative deviation of the CLAB BWR data is −0.2% with a standard deviation of 2.1%. The C-E values of the Cooper data shown in Figure 4C have a much wider spread with many values being outside the 1σ-band of the experimental uncertainty. On average a small underprediction of the measured values is observed. For the Cooper data the average C/E-1 value is −0.7% with a standard deviation of 6.0%. A potential reason for the larger variation of the Cooper C/E results could be the fact that some information on fuel assembly geometry, material temperatures, and moderator density was not given in the original report and has been later estimated from information on comparable reactors and fuel assemblies (Gauld et al., 2010). On the other hand, inaccuracies in modelling would be expected to result in a systematic bias rather than a larger variation of results. Thus a higher than estimated experimental uncertainty could also be a possible explanation for the observations. However, a thorough analysis of the sources experimental uncertainties is beyond the scope of this paper. More information on this issue can be found in (Gauld et al., 2010).
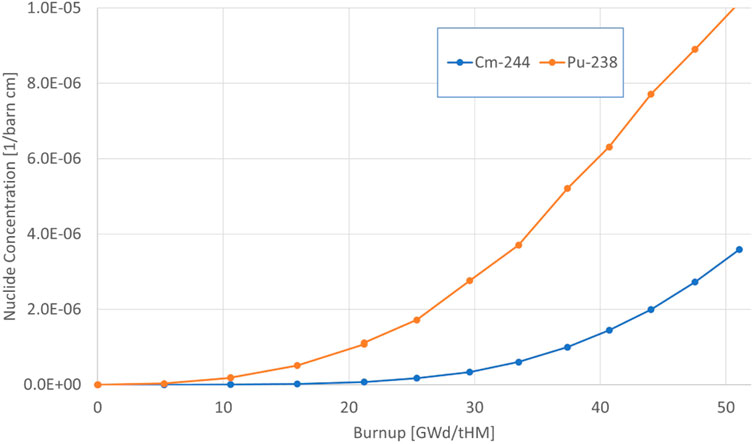
FIGURE 3. Evolution of the concentrations of 244Cm and 238Pu with burnup for sample F32 of Ringhals2.
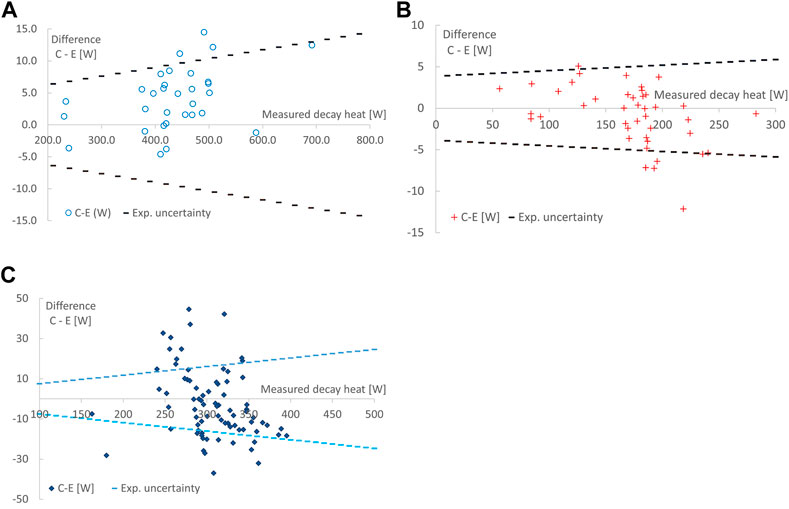
FIGURE 4. Difference between calculation and measurement C-E in W. The dashed straight lines represent the reported measurement uncertainties of the corresponding sample set. (A) PWR samples (CLAB data). (B) BWR samples (CLAB data). (C) BWR samples (Cooper, GE-Morris data).
A summary of the results is shown in Table 2. These results are comparable to the decay heat values reported earlier by other groups (San-Felice et al., 2013; Haeck et al., 2014; Yamamoto and Iwahashi, 2016; Ilas and Burns, 2021; Shama et al., 2022). While the standard deviations seen in the reported calculations are similar for comparable sets of experimental samples, small shifts in the average C/E-1 values can be observed for the different codes.
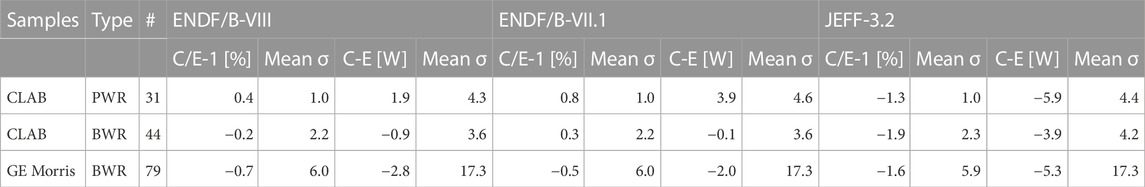
TABLE 2. Summary of validation calculation results and comparison of different data evaluations.
The present results obtained with MOTIVE have been plotted against different input quantities such as decay heat value, burnup, and cooling time of the samples in order to search for possible trends in the results which may originate in systematic biases of the code or the measurements. An example of such plots is given in Figure 5 which shows C/E-1 value plotted against burnup, separately for BWR and PWR samples. In the results for the BWR samples from CLAB, a slight trend from positive towards negative relative differences can be observed with increasing measured decay heat, i.e., for samples with lower measured decay heat and thus lower sample burnup an overprediction in the calculation is observed on average, whereas for samples with higher measured decay heat and higher sample burnup an underprediction of the calculation can be seen on average.
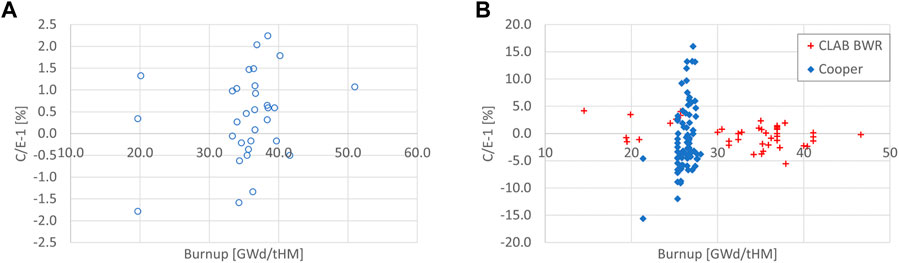
FIGURE 5. Relative deviation between calculation and measurement C/E-1 in % vs. discharge burnup of the fuel assemblies. (A) PWR samples. (B) BWR samples.
Both in the measurement and in the calculation of decay heat there are a large number of possible sources of uncertainties involved which are often difficult to separate from each other. The prediction of decay heat by summation codes, such as the MOTIVE code used here, can be thought of as a two step process: The determination of the nuclide composition of the fuel at discharge via a burnup calculation and the actual decay heat determination by taking into account the decay of radioactive nuclides and the decay energies involved. Consequently, the sources of uncertainties may be separated to some extent as well: For the first part these originate from uncertainties in the nuclear data, in the technical parameters (power history, geometrical dimensions, material temperatures, etc.) and due to code specific approximations, e.g., the statistical uncertainty from the Monte Carlo calculation and for the second part from the uncertainties in the decay data, e.g., decay constants, branching ratios and the recoverable energies per decay.
A thorough analysis of the effect of all these uncertainties on the nuclide inventory determination and consequently the decay heat prediction requires the application of uncertainty analysis methods. At GRS the XSUSA tool has been developed and used for this purpose in the past (Zwermann et al., 2014). Unfortunately, XSUSA is currently only applicable to multi-group neutron flux calculation methods and thus can not be applied to the analysis reported here. An extension to continuous energy libraries is currently under development. In order to gain some insight into the effect of nuclear data uncertainties, the validation calculations described above have been repeated using other nuclear data evaluations, namely, ENDF/B-VII.1 (Chadwick et al., 2011) and JEFF3.2 (OECD Nuclear Energy Agency, 2016). A summary of the results can be seen in Table 2. On a single sample level the use of other libraries leads to an almost constant offset for all samples leading to a corresponding offset in the observed mean deviations between calculation and experiment. The C/E-1 value is about 0.45% higher for ENDF/B-VII.1 than for ENDF/B-VIII and about 1.7% lower for JEFF3.2. for both the CLAB PWR and BWR samples. The differences in the mean C/E-1 values for the different libraries are slightly smaller for the GE Morris samples, 0.2% for ENDF/B-VII.1 and −0.9% for JEFF3.2. The standard deviations for each of the sample sets are practically the same for all nuclear data libraries. Overall there seems to be a systematic difference between the nuclear data libraries. In order to obtain an estimate for the uncertainties in the above mentioned second part of the calculation, the influence of the uncertainties in decay constants and recoverable energies per decay given in the data evaluation on the resulting decay heat values have been calculated by means of analytical propagation of uncertainty. It has been found that their influence on decay heat is below 0.2% for the given samples. This is somewhat smaller than the decay heat uncertainties from nuclear data and operational and design parameters reported for uncertainty analyses based on Monte Carlo sampling methods (Ilas and Liljenfeldt, 2017; Rochman et al., 2021b; Rochman et al., 2021a; Shama et al., 2021), which are roughly in the range of 1 to 2.5%.
The validation of a burnup code against decay heat measurements addresses the calculation procedure as a whole. Coming back to the above mentioned concept of seeing the calculation as a two step process, knowledge on how well a code predicts the concentration of individual nuclides relates to the first step of the calculation and may help to improve the understanding of the observed deviations in decay heat C/E-1 values. Radiochemical analysis data, sometimes also referred to as post-irradiation examination (PIE) data, of used nuclear fuel offer a possibility to quantify the quality of a code’s prediction of nuclide concentrations. For MOTIVE there is an extensive set of calculations of PIE data available which has been published earlier (Hannstein et al., 2019). For the current analysis the calculations were repeated in order to be consistent with the code versions used. In Table 3 a list of the PIE samples is shown together with information on the sample characteristics. Overall there are 75 samples which comprise a burnup range of 7.2–60.7 GWd/tHM. Of these 75 samples 16 originate from BWR fuel assemblies.

TABLE 3. PIE samples used for validation.
As already mentioned, only a small number of nuclides contribute significantly to the overall decay heat value at the time scales relevant to the measurements discussed here (see Figure 1). Table 4 shows a list of nuclide inventory validation results taken from the PIE data validation set of MOTIVE. For each nuclide the number of available samples is shown together with the C/E-1 value in percent, averaged over all samples. Additionally, the standard deviation of the C/E-1 value of the sample sets and the standard error of the resulting mean C/E-1 value are given. Each nuclide included in the list contributes significantly to overall decay heat either directly or through their direct daughter nuclide. From the data given in Table 4, it can be seen that deviations between calculated and measured nuclide inventories are much larger and show a wider spread than in the decay heat prediction. On the one hand this can be attributed to the different nature of the quantities: Decay heat is a global quantity which averages over local effects and may level out uncertainties originating from the contribution of different nuclides whereas PIE data deals with small sized samples and single nuclide species. On the other hand, radiochemical analysis is even more complex than decay heat measurements with many processing steps that may introduce a large variety of possible sources of error. Despite the discussed large uncertainties involved, some of the observed deviations between calculated and measured nuclide concentrations can be identified as significant with respect to the derived standard error of the mean value (last column in Table 4).
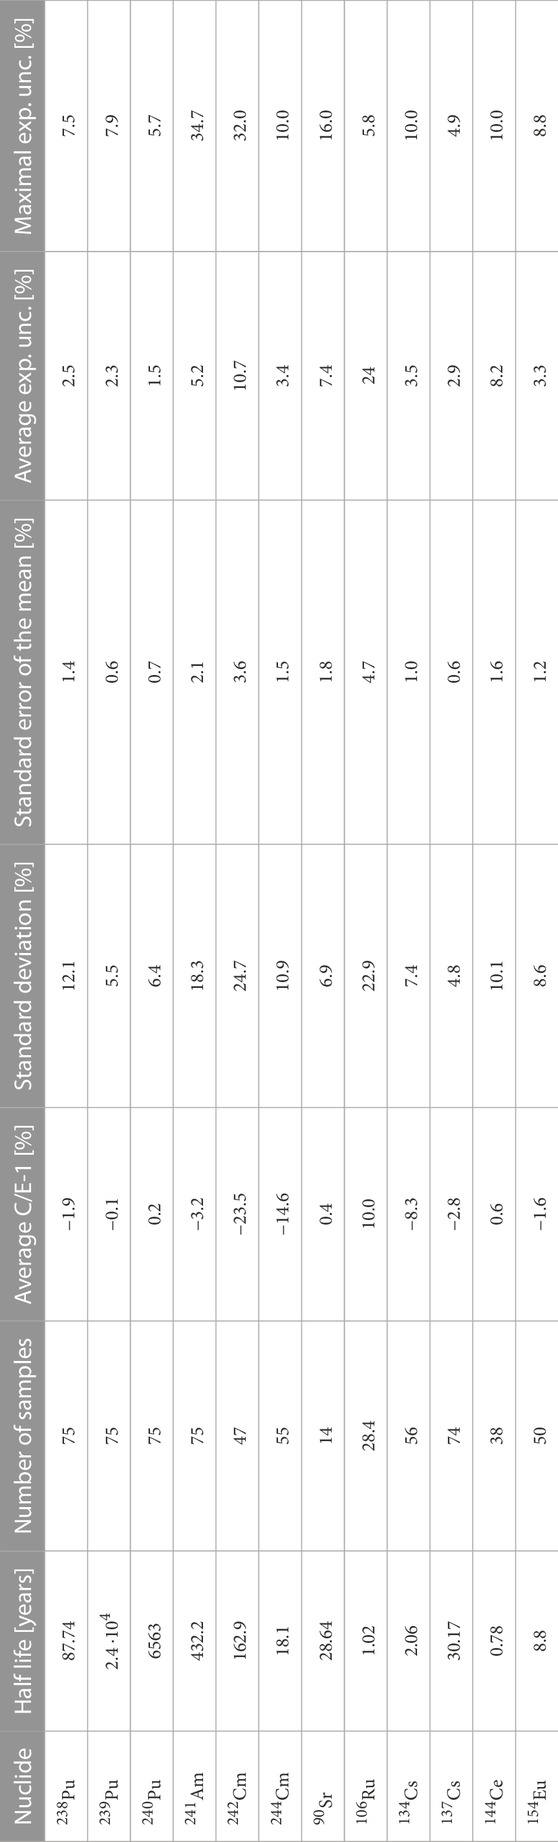
TABLE 4. C/E-1 values for nuclide concentrations of nuclides relevant to decay heat obtained from MOTIVE validation calculations. For comparison the average and maximal reported experimental uncertainties for the samples used are also given.
Taking into account the results of PIE data validation calculations may help to disentangle the different sources of uncertainties in the decay heat determination. As a first step in this direction, the average C/E-1 values given in Table 4 were used to correct the nuclide densities obtained in the decay heat calculation. Consequently the decay heat contributions of the individual nuclides are corrected accordingly. In this way the contribution to decay heat of nuclides which are underestimated according to Table 4 will be enhanced and vice versa. It is clear that this approach is a rather coarse one since it ignores the large variation in the C/E-values of the nuclides and should be backed up in the future by uncertainty analysis. Since most of the relevant nuclides are reported as being underpredicted in the validation, this procedure leads to larger decay heat values. On average the obtained C/E-1 values are roughly 2% higher. The detailed analysis of the results on an individual sample basis reveals, that in the case of the cooling times relevant to the CLAB samples most part of the correction originates from 137mBa (for which the correction of 137Cs is applied) and 244Cm. For the cooling times of the Cooper samples also 106Rh, 134Cs, and 242Cm play a significant role. Since 244Cm has a growing contribution to the total decay heat with increasing burnup, the effect of the correction is stronger for higher burnup samples (Fiorito et al., 2021). Thus one may expect a reduction of the small negative slope with burnup of the C/E-1 values seen in the CLAB BWR samples. This effect is shown in Figures 6A, B for the CLAB BWR samples. In Figure 6B the increase of the correction with burnup can be seen. The application of this correction to the results for the CLAB BWR samples is shown in Figure 6A where the uncorrected and corrected C-E values for CLAB BWR samples are plotted against experimental decay heat values together with the 1σ experimental uncertainties. One can observe that all C-E values are shifted to larger overprediction leading to an average difference of 3.7 W instead of −0.9 W for the uncorrected data, corresponding to an average C/E-1 value of 2.3% instead of −0.2%. Thus an increase in the average deviation between calculation and experiment can be observed which is, however, still in the range of the observed differences between different evaluations. The effect is larger than the one from neglecting axial burnup profiles. The standard deviation of the C-E values is only minimally reduced from 3.6 W to 3.5 W.
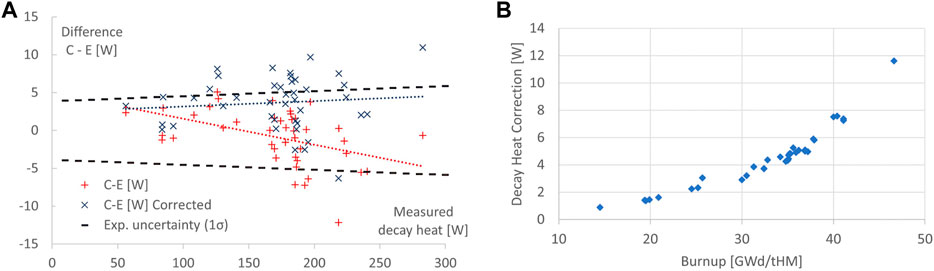
FIGURE 6. Effect of correction factor application to CLAB BWR data. (A) C/E-1 values: original results and with correction applied. (B) Burnup dependence of correction values.
On the other hand, as indicated in the figure, the negative slope of the data visible in the plot is removed. Although the result of the presented correction procedure is ambiguous, the latter observation shows that further investigation into the prediction of 244Cm concentration in used fuel samples may be worthwhile to eventually arrive at a better prediction of the decay heat of used fuel, especially for high burnup samples. Again it has to be stated that more thorough analysis is needed to come to more conclusive results.
4 Conclusion
In this work the validation of decay heat determination with MOTIVE is reported. For this purpose 154 samples of PWR and BWR fuel assemblies were modelled which have been measured at the CLAB facility of the Swedish Nuclear Fuel and Waste Management Company CLAB and at the GE-Morris site. The calculations were performed with the burnup code MOTIVE developed at GRS using ENDF/B-VIII.0 data. The resulting average relative differences between computed and measured values are 0.4% with a standard deviation of 0.8% for the PWR assemblies and −0.6% with a standard deviation of 5.0% for the BWR assemblies (CLAB and Cooper combined). These values are compatible to results obtained in analyses with other codes reported earlier. For the CLAB PWR fuel assembly samples it has been seen that taking into account the axial burnup distribution leads to a decay heat value which is less than 1% higher compared to a calculation using the average burnup value. It has been investigated whether insights may be gained by combining decay heat and nuclide concentration measurements for a deeper understanding of possible causes for deviations. First steps in this direction have been taken. The observed reduction of the burnup trend in the CLAB BWR sample C/E-1 values from applying a correction to 244Cm concentration shows that further analysis of nuclide concentration predictions may be an interesting subject for further research into an improvement of decay heat predictions. A thorough analysis certainly also requires methods of uncertainty analysis and is a possible route for future work.
Data availability statement
The raw data supporting the conclusion of this article will be made available by the authors, without undue reservation.
Author contributions
VH, FS, RH, and MB contributed to conception and design of the study. FS, RH, and VH performed the decay heat validation calculations and contributed the analysis of the results. FS, MB, and VH worked on PIE sample calculations. VH wrote the first draft of the manuscript. All authors contributed to manuscript revision, read, and approved the submitted version.
Funding
This work is supported by the German Federal Ministry for the Environment, Nature Conservation, Nuclear Safety and Consumer Protection.
Conflict of interest
The authors declare that the research was conducted in the absence of any commercial or financial relationships that could be construed as a potential conflict of interest.
Publisher’s note
All claims expressed in this article are solely those of the authors and do not necessarily represent those of their affiliated organizations, or those of the publisher, the editors and the reviewers. Any product that may be evaluated in this article, or claim that may be made by its manufacturer, is not guaranteed or endorsed by the publisher.
References
Brown, D. A., Chadwick, M. B., Capote, R., Kahler, A. C., Trkov, A., Herman, M. W., et al. (2018). ENDF/B-VIII.0: The 8th major release of the nuclear reaction data library with CIELO-project cross sections, new standards and thermal scattering data. Nucl. Data Sheets 1, 1–142. doi:10.1016/j.nds.2018.02.001
Chadwick, M. B., Herman, M., Obložinský, P., Dunn, M. E., Danon, Y., Kahler, A. C., et al. (2011). ENDF/B-VII.1 nuclear data for science and technology: Cross sections, covariances, fission product yields and decay data. Nucl. Data Sheets 112, 2887–2996. doi:10.1016/j.nds.2011.11.002
Creer, J. M., and Shupe, J. W. (1981). Development of a water boil-off spent fuel calorimeter system. Oak Ridge: U.S. Department of Energy Office of Scientific and Technical Information. PNL-3434.
Fiorito, L., Romojaro, P., Cabellos, O., García-Hormigos, M., Hernandez-Solis, A., Sánchez-Fernández, S., et al. (2021). On the use of criticality and depletion benchmarks for verification of nuclear data. Ann. Nucl. Energy 161, 108415. doi:10.1016/j.anucene.2021.108415
Gauld, I. C., Ilas, G., Murphy, B. D., and Weber, C. F. (2010). Validation of SCALE 5 decay heat predictions for LWR spent nuclear fuel. NUREG/CR-6972.
Haeck, W., Ichou, R., and Ecrabet, F. (2014). “Experimental validation of decay heat calculations with VESTA 2.1,” in Proceedings of PHYSOR 2014, Kyoto, Japan. Editor American Nuclear Society.
Hannstein, V., Behler, M., and Sommer, F. (2017). “Motive - a new modular burn-up code,” in International Conference on Mathematics & Computational Methods Applied to Nuclear Science & Engineering, Jeju, Korea, April 16-20, 2017 (Red Hook, NY, USA. Curran Associates, Inc.
Hannstein, V., Behler, M., and Sommer, F. (2019). Validation of the burn-up code motive using ENDF/B-VIII data. Vienna, Austria: International Atomic Energy Agency. ICNC 2019.
Ilas, G., and Burns, J. R. (2021). SCALE 6.2.4 validation for light water reactor decay heat analysis. Nucl. Technol. 1, 403–413. doi:10.1080/00295450.2021.1935165
Ilas, G., and Gauld, I. C. (2008). SCALE analysis of clab decay heat measurements for lwr spent fuel assemblies. Ann. Nucl. Energy 35, 37–48. doi:10.1016/j.anucene.2007.05.017
Ilas, G., and Liljenfeldt, H. (2017). Decay heat uncertainty for BWR used fuel due to modeling and nuclear data uncertainties. Nucl. Eng. Des. 319, 176–184. doi:10.1016/j.nucengdes.2017.05.009
Jansson, P., Bengtsson, M., Bäckström, U., Álvarez-Velarde, F., Čalič, D., Caruso, S., et al. (2022). Blind benchmark exercise for spent nuclear fuel decay heat. Nucl. Sci. Eng. 1, 1125–1145. doi:10.1080/00295639.2022.2053489
Kromar, M., and Godfrey, A. T. (2022). Determination of the spent fuel decay heat with the VERA core simulator. Front. Energy Res. 10. doi:10.3389/fenrg.2022.1046506
Mala, P. (2018) Pin-by-Pin treatment of LWR cores with cross section equivalence procedures and higher-order transport methods. Ph.D. thesis. Lausanne, Switzerland: EPFL. doi:10.5075/epfl-thesis-8913
OECD Nuclear Energy Agency (2016). JEFF-3.2 evaluated data library. Vienna, Austria: Nuclear Energy Agency.
Pusa, M., and Leppänen, J. (2010). Computing the matrix exponential in burnup calculations. Nucl. Sci. Eng. 164, 140–150. doi:10.13182/NSE09-14
Rearden, B. T., and Jessee, M. A. (2016). SCALE code system, version 6.2. Oak Ridge, Tennessee: Oak Ridge National Laboratory. ORNL/TM-2005/39.
Rochman, D. A., Vasiliev, A., Ferroukhi, H., and Hursin, M. (2021a). Analysis for the ARIANE BM1 and BM3 samples: Nuclide inventory and decay heat. EPJ Nucl. Sci. Technol. 7, 18. doi:10.1051/epjn/2021017
Rochman, D. A., Vasiliev, A., Ferroukhi, H., and Hursin, M. (2021b). Analysis for the ARIANE GU1 sample: Nuclide inventory and decay heat. Ann. Nucl. Energy 160, 108359. doi:10.1016/j.anucene.2021.108359
Romano, P. K., Horelik, N. E., Herman, B. R., Nelson, A. G., Forget, B., and Smith, K. (2015). OpenMC: A state-of-the-art Monte Carlo code for research and development. Ann. Nucl. Energy 82, 90–97. doi:10.1016/j.anucene.2014.07.048
San-Felice, L., Eschbach, R., and Bourdot, P. (2013). Experimental validation of the Darwin2.3 package for fuel cycle applications. Nucl. Technol. 184, 217–232. doi:10.13182/NT12-121
Shama, A., Rochman, D., Caruso, S., and Pautz, A. (2022). Validation of spent nuclear fuel decay heat calculations using polaris, ORIGEN and CASMO5. Ann. Nucl. Energy 165, 108758. doi:10.1016/j.anucene.2021.108758
Shama, A., Rochman, D., Pudollek, S., Caruso, S., and Pautz, A. (2021). Uncertainty analyses of spent nuclear fuel decay heat calculations using scale modules. Nucl. Eng. Technol. 53, 2816–2829. doi:10.1016/j.net.2021.03.013
Strickler, H. R., and Doman, J. W. (1982). In-plant test measurements for spent-fuel storage at Morris Operation. Volume 3. Fuel bundle heat generation rates. San Jose, CA (USA): General Electric Co.
Svensk Kärnbränslehantering AB (2006). Measurements of decay heat in spent nuclear fuel at the Swedish interim storage facility. Solna, Stockholm, Sweden: Svensk Kärnbränslehantering AB. Clab. R-05-62 (SKB).
Wiles, L. E., Lombardo, N. J., Heeb, C. M., Jenquin, U. P., Michener, T. E., Wheeler, C. L., et al. (1986). BWR spent fuel storage cask performance test: Volume II pre- and post-test decay heat, heat transfer, and shielding analyses. Richland, United States: Pacific Northwest Laboratory.
Yamamoto, T., and Iwahashi, D. (2016). Validation of decay heat calculation results of ORIGEN2.2 and CASMO5 for light water reactor fuel. J. Nucl. Sci. Technol. 53, 2108–2118. doi:10.1080/00223131.2016.1183528
Žerovnik, G., Schillebeeckx, P., Govers, K., Borella, A., Čalič, D., Fiorito, L., et al. (2018). Observables of interest for the characterisation of spent nuclear fuel. JRC112361 of JRC Technical Reports.
Keywords: decay heat, code validation, burnup, MOTIVE, PIE data, nuclear fuel
Citation: Hannstein V, Behler M, Henry R and Sommer F (2023) Validation of the burnup code MOTIVE with respect to fuel assembly decay heat data. Front. Energy Res. 11:1083249. doi: 10.3389/fenrg.2023.1083249
Received: 28 October 2022; Accepted: 03 March 2023;
Published: 20 March 2023.
Edited by:
Gert Van den Eynde, Belgian Nuclear Research Centre, BelgiumReviewed by:
Federico Grimaldi, Belgian Nuclear Research Centre, BelgiumLuca Fiorito, Belgian Nuclear Research Centre, Belgium
Copyright © 2023 Hannstein, Behler, Henry and Sommer. This is an open-access article distributed under the terms of the Creative Commons Attribution License (CC BY). The use, distribution or reproduction in other forums is permitted, provided the original author(s) and the copyright owner(s) are credited and that the original publication in this journal is cited, in accordance with accepted academic practice. No use, distribution or reproduction is permitted which does not comply with these terms.
*Correspondence: Volker Hannstein, dm9sa2VyLmhhbm5zdGVpbkBncnMuZGU=