 Fredrik Skaug Fadnes
 Ernst Olsen
 Mohsen Assadi
- 1Department of Energy and Petroleum Engineering, Faculty of Science and Technology, University of Stavanger, Stavanger, Norway
- 2Department of Energy and Smart Technology, Norconsult AS, Sandvika, Norway
- 3Department of Urban Environment and Development, International Team, Municipality of Stavanger, Stavanger, Norway
This article introduces a modern thermal energy plant consisting of sewage heat pumps, a biogas boiler, thermal solar collectors, and grey water recycling. It further discusses advanced methods to achieve energy efficiency in the plant operation. The project is a collaboration between the industrial plant designer, the municipal plant owner, and the local academic institution. The article presents the framework for the collaboration. The overall target is to investigate how the experience and competence of the three partners can lead to improved operation using data-driven methods and optimization strategies. The industrial partner can closely follow up on its design and increase its knowledge of artificial intelligence and data-driven methods. The municipal partner is given a “free-of-charge” system review. New knowledge and reduced life cycle costs and emissions are possible outcomes. The academic partner gets access to a “living green laboratory,” a unique dataset, and the opportunity to validate developed models and optimization strategies. The plant represents the state-of-the-art for a medium scaled, local thermal energy production system in an existing building cluster. The design energy and emission targets are presented and compared to the operational results. Though the municipal partner can report good agreement between targets and results, an evaluation of the day-to-day operation identified practical examples of system conditions that Artificial Intelligence may improve. The article concludes with a description of plans for future work and a broader discussion of the impacts of introducing data-driven methods to real-life systems.
1 Introduction
The Paris Agreement is a legally binding international treaty on climate change that 96 Parties adopted in Paris in 2015 (United Nations, 2021). The agreement targets to limit global warming to well below 2, preferably to 1.5°C, compared to pre-industrial levels. Energy production and usage are the largest contributors to global greenhouse gas (GHG) emissions; thus, the energy sector is key to achieving the agreement’s objectives (IEA, 2020).
In addition to ambitious targets of transforming the energy sector to net zero, high fuel prices, inflation, supply chain bottlenecks, and consequences of the Russian invasion of Ukraine have all led to a global energy market crisis (IEA, 2022c), with rapid increasing energy costs and concerns seen all over Europe (Eddy, 2022). In a recently announced support initiative for business owners, the Norwegian government has demanded that all businesses receiving financial support review their energy situation. If a company initiates energy efficiency projects, the government will reimburse a higher percentage of the electricity bill (Norwegian Ministry of Trade, Industry and Fisheries, 2022). Energy efficiency helps mitigate the consequences of high electricity prices for households and businesses (Aasland, 2022).
Buildings are responsible for about 30% of global energy consumption and contribute 27% of the total GHG emissions (IEA, 2022a). The building sector is considered the largest energy consumer in the European Union (EU), tracking 36% of GHG emissions (European Commission, 2020). Heat is the most significant global energy demand, about 50% of the final energy consumption, of which 46% represents the heating of buildings and hot water (IEA, 2019). In addition, the global energy demand for space cooling has tripled since 1990, making it the fastest-growing end-use in buildings. In 2021 space cooling demands accounted for nearly 16% of the building sector’s final electricity consumption (IEA, 2022b). Increasing energy demands for heating and cooling in residential and industrial sectors significantly contribute to GHG emissions (Ahmed A. A. et al., 2022).
By introducing renewable thermal energy production sources such as heat pumps, solar thermal energy, and ambient heat for the heating and cooling sector, the dependency on fossil fuels can be reduced (Ahmed A. A. et al., 2022). Heat pumps are among the most energy-efficient and environmentally friendly thermal energy production technologies (Gaur et al., 2021), with a high potential to contribute to green building (Yunna and Ruhang, 2013). Furthermore, heat pumps can provide heating, cooling, and domestic hot water (DHW) from a single unit (Arteconi et al., 2013), thus potentially producing a large share of a building’s energy demand with low energy input. The work presented in this article concerns a modern thermal energy plant for building demands based on advanced sewage heat pump technology.
Heat pump systems should be designed and operated with conditions allowing for high efficiencies, as even minor improvements can reduce energy consumption significantly (Eom et al., 2019). Furthermore, efficient control for heating, ventilation, and air-conditioning systems (HVAC) is the most cost-effective way to minimize energy use in buildings (Escrivá-Escrivá et al., 2010).
Recently the popularity of Artificial Intelligence (AI) and data-driven methods for control, prediction, monitoring, and fault detection applications in HVAC systems has grown (Ahmad et al., 2016). This popularity is due to the available computational power to apply these techniques to experiments and real-life problems and more strict requirements for building energy efficiency and HVAC systems. Still, researchers have mostly validated AI techniques through simulations or in small-scale HVAC systems. Hence, there is a need for practical validation in commercial systems for real-time control (Ahmad et al., 2016).
There has been significant growth in smart devices and sensors, which allows the development of a new generation of more intelligent, more context-aware building controllers (Reynolds et al., 2018). A “smart building” has a set of sensors that capture the state of the environment; a management system that analyses the information provided by the sensors and decides the actions to be taken; actuators that allow control of the facilities; and an interface for the building operator to monitor and control the system (Noye et al., 2022).
Teng et al. presented an excellent review of the current industrial developments in enabling technologies for the Internet of Things (IoT) and a guideline for researchers and industrialists developing advanced energy-saving systems based on digital twins (Teng et al., 2021). A digital twin is a digital copy or model of any physical entity, interconnected by exchanging data in real-time. It should capture the state of its physical twin in real time and vice versa (Singh et al., 2021). AI is a tool applicable for developing digital twins. Teng et al. expect the practical implementation of digital twins to grow in the coming decades.
To allow for maximum utilization of the state-of-the-art and establish successful smart energy projects, there is a need to combine industrial implementation, knowledge, and data-driven modeling (Máša et al., 2018). There are principal differences between the academy and the industry. While universities wish to contribute to theoretical developments, the industry depends on profitability. In science and engineering disciplines, a link between academia and the industry can contribute to the betterment of both (Ahmed F. et al., 2022). Teng et al. recommended that researchers perform “low-level” research, such as “data janitor”-tasks, and shift their focus to realistic industrial implementations instead of pseudo-theoretical problems. In addition, industrialists should actively investigate research advances and collaborate with academia, provide real-life problems to researchers, and allocate funds for R&D projects (Teng et al., 2021).
1.1 Motivation and contribution
This article conveys the collaboration between academic, industrial and municipal partners. As their contribution to the EU Lighthouse project Triangulum, the Municipality of Stavanger in Norway developed a thermal energy plant supplying three municipal office buildings, including the main public swimming pool, heating, DHW, and cooling. Sewage heat pumps, solar thermal heating, grey water recycling, and a biogas boiler replaced natural gas and electric boilers. The project had an overall target to reduce GHG emissions by 75% compared to the baseline (Triangulum, 2018). This thermal energy plant, known as the Triangulum Central Energy Plant (TriCEP), is this article’s case study.
The collaboration’s overall aim is to practically implement what Teng et al. pinpoint as the path to success, namely, bringing academic and industrial organizations together to explore the potential of smart technologies for achieving energy efficiency in a real-world application (Teng et al., 2021). The TriCEP is the selected case study. To introduce the industrial and municipal partners and readers to the state-of-the-art, Chapter 2 presents an open literature review of relevant AI methods and applications for thermal energy plants and heat pump systems. Chapter 3 presents the establishing of the collaboration and the methodology applied to evaluate the plant operation. The TriCEP case is introduced in Chapter 4. A comparison between the design targets and the energy and GHG emissions results from the first 4 years of operation is given in Chapter 5. Though satisfactory results are reported, delving into the data shows room for further improvement. System-specific suggestions of tasks that AI could be applied to are presented in Chapter 6. The conclusion in Chapter 7 presents a summary and a discussion of the project’s impacts. Inspired by the concept of being a lighthouse project, the conclusion examines how technological advancements may have impacts beyond improving a single energy plant’s operation. The article aims to establish a platform foundation for future publications, presenting detailed analyses of the various subsystems of the TriCEP.
2 Advanced methods for monitoring and control of thermal energy systems
The academic literature connecting AI, data-driven methods, and smart technology for energy systems has increased rapidly over the last decade. We recommend the industrial reader Behzadi et al.‘s article Smart design and control of thermal energy storage in low-temperature heating and high-temperature cooling systems: A comprehensive review for a clear introduction to relevant concepts (Behzadi et al., 2022). The authors present intelligent control aspects such as model predictive control (MPC), artificial neural networks (ANN), and optimization methods for modern thermal energy plants comparable to the TriCEP. Killian and Kozek asked ten questions about MPC in buildings. Through their answers, they provided a thorough introduction to an advanced control strategy, which has become relevant for thermal energy plants and heat pump systems (Killian and Kozek, 2016). Discussing control of ground source heat pump systems (GSHP), Noye et al. identified two principal uses of AI. First, developing a predictive model of the system that reflects its actual performance, and second, optimizing the control decisions in real-time based on the predictive model (Noye et al., 2022). In their concluding remarks, they stated that the examples found in the literature are limited, and there is further potential in investigating and applying AI to heat pump systems. GSHP is fundamentally the same type of heat pump system used in TriCEP, i.e., a brine-to-water heat pump.
This literature review first introduces methods to develop predictive models for thermal energy plants and heat pump systems emphasizing the ANN. Then, Section 2.2 presents monitoring and fault detection and diagnosis (FDD) using predictive models, and Section 2.3 discusses system control using optimization methods.
2.1 Developing predictive models using data-driven methods and artificial neural networks
AI and data-driven methods represent an advanced approach to developing and implementing digital twins (Teng et al., 2021). The ANN is a data-driven method widely applied to optimize energy and process systems (Mohanraj et al., 2012). It is a suitable method for modeling non-linear and multidimensional energy systems when an accurate prediction of performance is required (Nikpey et al., 2013). The ANN learns from data by constructing a function that relates selected inputs to outputs without physical relationships between the parameters (Nikpey et al., 2020). The many advantages of the ANN include pattern recognition, non-linearity, and adaptivity (Haykin, 2009). The models are relatively easy to develop and use, and the accuracy depends on the selected algorithm’s quality and quantity of data available (Runge and Zmeureanu, 2019).
Data-driven models can act as surrogate models for actual engineering models. Once trained, the surrogate models present the relationship between input and output while bypassing computationally extensive models. In energy systems, surrogate models reduce the computational time required to simulate the system’s response to variations in input parameters and external disturbances (Perera et al., 2019).
The academic partner in the collaboration has successful experience researching ANN for gas turbine applications. Nikpey et al. developed and evaluated an ANN model for monitoring a micro gas turbine (Nikpey et al., 2013). The final ANN model was a reliable baseline model that could predict the typical performance of the micro gas turbine with high accuracy, making the model appropriate for online monitoring applications at both system and component levels. Assadi and Fast developed a model of the hybrid plant Västhamnsverket in Helsingborg, consisting of a natural gas turbine, a heat recovery steam generator, and a biomass boiler connected to a steam turbine (Assadi and Fast, 2006). They modeled all subsystems using ANN, and their results showed that the method has excellent versatility and potential within thermal power plant modeling.
At the University of Auckland, Swider et al. and Becthler et al. early published work on ANN for heat pumps in 2001. First, Swider et al. developed neural networks to predict chillers’ steady-state performance (Swider et al., 2001). They chose network input parameters based on their availability to the operational personnel: water outlet temperature from the evaporator, cooling water inlet temperature to the condenser, and evaporator capacity. The output predictions were performance parameters such as the Coefficient of Performance (COP) and compressor work input. They trained and validated the models using operational data from two chillers with 650 and 350 kW nominal capacities. The networks predicted the compressor work input and the COP with ±5% and the temperatures with ±0.5% accuracy when tested on unseen data. The authors concluded that ANN is a promising tool for predicting chiller performance for fault detection and other diagnostic purposes. Next, Bechtler et al. investigated the transient behavior of the machines using data from the same chillers. Their results showed that the networks predicted all tendencies in a dataset satisfactorily, but they were most accurate under steady conditions. Still, the authors concluded that the neural network provides fast and accurate means of determining the chiller’s performance under transient operating regimes, such as modulating part-load and start-up conditions (Bechtler et al., 2001).
A group of researchers at the Firat University in Turkey has steadily published work on ANN for GSHP. Their main target has been to develop models which help system designers forecast heat pump performance to achieve optimal design and energy savings in the operational phase (Esen et al., 2008a). First, Esen et al. used ANN to predict the performance of a GSHP system based on experimental measurements as training and test data (Esen et al., 2008c). They developed a network that predicted the COP from the input parameters condenser inlet, condenser outlet, and ground temperatures. A network with seven hidden neurons trained with the Levenberg–Marquart algorithm performed best, with a root-mean-square (RMS) value of 1%. In subsequent papers, they compared the network to an adaptive neuro-fuzzy inference system (Esen et al., 2008a), developed a pre-processing method using statistical data weighting (Esen et al., 2008b), and introduced a heat pump system with two operational modes, heating and cooling (Esen and Inalli, 2009; Esen and Inalli, 2010), further finetuning their method.
Opalic et al. developed ANN models of an operational CO2-based industrial cooling subsystem in a complex warehouse energy system (Opalic et al., 2020). Operating temperature and pressure measurements, as well as the frequency of the compressors, were used as input to a model which predicted the compressor’s electrical power consumption and refrigerant mass flow rate. The authors concluded that the technique is superior to a general theoretical model in terms of accuracy, flexibility, cost-effectiveness, and its ability to be implemented in real-world applications. Like the TriCEP, the project is a collaboration between the plant designer, plant owners, and an academic institution. In their conclusion, they reported that the next step is implementing the model in the control system to improve operational control.
Puttige et al. used measured data to develop simple and accurate models for GSHP systems, combining a hybrid analytical-ANN model for the borehole heat exchanger (BHE), an ANN model for the heat pumps, and an empirical model for system heat exchangers (Puttige et al., 2022). The BHE and the heat pump models achieved a mean absolute error (MAE) of less than 5%, while the heat exchanger model had an MAE of 18%. The final models agreed well when validated against 4 years of monitored data. They predicted the compressor power with an MAE of 7.8% and the BHE power with an MAE of 19.1%.
2.2 Monitoring and fault detection
Heat pump systems are only efficient if the equipment is maintained correctly. Gradual faults decrease efficiency, increase energy consumption and GHG emissions, and reduce thermal comfort (Sun et al., 2019). FDD systems can reduce the cost of operating and maintaining HVAC and heat pump systems while keeping their performance (Bellanco et al., 2021). Typical faults in heat pump systems are reduced water flow across the evaporator or condenser, condenser fouling, non-condensable gases in the refrigerant, and refrigerant leakage (Singh et al., 2022). An accurate monitoring tool can improve an energy system’s reliability, availability, and maintainability, avoid unexpected outages, detect performance degradation, and help with maintenance planning (Nikpey et al., 2013).
Casteleiro-Roca et al. designed a novel intelligent system to detect faults in BHE systems (Casteleiro-Roca et al., 2016). Based on a classification method, the system can detect when the BHE in a heat pump system fails in real-time. The authors investigated the ANN, Linear Discriminant Analysis, and Decision Three classification and achieved the best accuracy, nearly 94%, using the ANN. The authors tested the system empirically with a real dataset obtained from measurements from 1 year of operation.
Refrigerant leakage is a potential and frequent fault in heat pump systems. Heat pumps and cooling machines perform best at the optimal refrigeration charge. Therefore, predicting the amount of refrigerant charge can be vital for the optimum operation of the machine. Eom et al. developed a refrigeration fault detection strategy based on convolutional neural networks. Two models using classification and regression predicted the quantitative refrigerant amount in both cooling and heating modes of a heat pump. The models achieved a mean classification accuracy of 99.9% (Eom et al., 2019).
Bellanco et al. presented a detailed review of FDD for heat pump systems, which included experimental and digital twin-based fault detection. They registered several areas where there is room for improvement, including performance indicators for FDD, new and updated studies about the health status of field heat pumps, testing methods that take the gradual and probabilistic nature of heat pump faults into account, and further research on the use of virtual sensors in FDD systems (Bellanco et al., 2021).
2.3 Optimized control of thermal energy plants using AI
Accurate predictive models allow for AI-based control. However, for a predictive model to be helpful in the real world, the whole framework must be carefully designed for it to work (Gallagher et al., 2019). Noye et al. recommended the following as a minimum; the acquisition of real-time information on the status of the system and climate conditions, an energy system with automatic control possibilities, and a management system that can control the plant according to the current conditions capable of sending corresponding commands to the production units (Noye et al., 2022).
MPC is an optimization-based control strategy. Various studies have consistently reported better performance than traditional strategies (Cotrufo et al., 2020). Initially developed for refineries in the late 1970s, MPC is now considered one of the core methods in advanced process control. Commercial tools are available in industries such as refineries, petrochemicals, pulp and paper, and furnaces (Qin and Badgwell, 2003). Still, MPC is an upcoming field in building energy systems (Killian and Kozek, 2016).
An MPC uses a predictive model of the system it controls, with forecasts of the disturbances, such as weather and occupancy, to predict future behavior and select an optimal set of actions. In energy systems, examples of actions are setpoint profiles, energy storage charging and discharging steps, and operational load of energy production units and auxiliary devices such as pumps and fans. These control actions target minimizing a cost function, typically total energy consumption, peak power demand, GHG emissions, and energy costs (Cotrufo et al., 2020). Each time step predictions of the disturbances and the controllable actions in the MPC are sent to the process model. The simulation runs over the prediction horizon, typically between 8 and 72 h for building applications. The optimizer evaluates the performance criterion for each simulation run and adapts the control actions until finding an optimal solution. The process controller receives the first control action, and then the optimization is restarted at the next sampling instant (Killian and Kozek, 2016).
In their literature review, Cotrufo et al. listed several applications of MPC in energy systems, including control of district heating and cooling systems, management of ice banks for cooling applications, provisions of ancillary services like voltage and frequency regulation of the grid, control of radiant heating and cooling systems, short-term office temperature control and demand response schemes (Cotrufo et al., 2020).
The group who asked ten questions about MPC (Killian and Kozek, 2016) has steadily published papers researching MPC for building energy and heating systems. Working with 50% of 27,000 m2 of a university building in Salzburg as their reference case, they have developed the work from a single MPC to a system of independent but interacting MPCs. Mayer et al. investigated MPC for the supply side of the heating system, where a heat pump operated against a stratified accumulation tank and a separate district heating loop (Mayer et al., 2015). The objective of the optimization was to minimize the deviation to the heat load prediction and operational costs while managing the constraints on control inputs, states, and minimum on/off times of the heat pump. The authors derived analytical models for the heating loops and represented non-linearities by a piecewise linear model.
Mayer et al. widened the scope to include both the heating and cooling demands of the user and the supply levels (Mayer et al., 2017). The user-level MPC optimized user comfort while minimizing heating and cooling energy demand, with ambient temperature, radiance, and the occupancy profile as disturbances. In these two papers (Mayer et al., 2015; Mayer et al., 2017), the authors tested the MPCs in simulation environments. Finally, Killian and Kozek implemented an MPC system in parts of the university building (Killian and Kozek, 2018). The final controller consisted of fuzzy MPCs for each zone, a global MPC to control the coupling zone, and a cooperative iteration loop. The control strategy mostly showed better performance at significantly lower control efforts than the original rule-based control system of the building. Additionally, the authors registered that known actuator faults were automatically compensated without control reconfigurations, thus achieving a more adaptable control of the system. Simulation results of a rule-based control for the same period showed that the MPC achieved higher comfort with less cost and energy savings, lying between 31% and 36% (Killian and Kozek, 2018).
The group suggested that MPC for building energy system control is about to reach commercial maturity (Killian and Kozek, 2016). Still, our experience from the Norwegian building industry is that consultants design thermal energy plants with traditional rule-based control strategies and present “smart technology” and AI discussions in concept studies.
Cotrufo et al. developed a control algorithm that targeted reducing natural gas consumption in a hydronic heating system (Cotrufo et al., 2020). The algorithm optimized the transition between night setback and daytime indoor air setpoint values as a function of expected weather. The authors implemented the strategy in an institutional building in Varennes, Canada, during the heating season of 2018–2019. By allowing the MPC to choose one of several predefined setpoint profiles, the authors managed to reduce the natural gas consumption and GHG emissions by ca. 22% and the building heat demand by 4.3%, compared to a baseline ON/OFF-control strategy. The authors suggested that the strategy is scalable and replicable for other buildings (Cotrufo et al., 2020). Furthermore, the methodology included the selection of an appropriate AI technique for developing the model for the MPC, in this case, Gauss Process Regressions with a squared exponential Kernel function. The authors trained the prediction model using operational data from the building and concluded that engineers should train new models for each new building application.
Reynolds et al. investigated MPCs for supply and demand side control of a multi-vector energy network supplying several buildings at a district level (Reynolds et al., 2019). The first strategy targeted optimizing heat generation to meet a predefined building demand at minimum cost. The second strategy extended the first one by also aiming to control the demand of an office building by managing the heating temperature setpoint. The system re-optimized every hour with a 24-h time horizon to allow quick reaction to unforeseen circumstances or forecasting errors. ANNs predicted the building heat demand over the next 24 h and solar photovoltaic generation. A genetic algorithm performed the optimization and set the percentage output of the energy production units, which included a gas boiler, a combined heat and power unit, a heat pump, and thermal storage. When tested against a simulated baseline rule-based control strategy, the outcomes of the two MPC strategies were 45% and 53% increases in profits, respectively. Consequently, the MPCs achieved an overall reduction of GHG emissions of 4% compared to the baseline.
MPC has yet to become standard in commercial building energy systems due to the greatest challenge of MPC, namely, developing an accurate mathematical model of the controlled system (Killian and Kozek, 2016). Inaccurate predictions can lead to a system with inferior performance compared to a system with standard rule-based control (Seborg et al., 2011). Model development is a process that requires time, technical expertise, and often information that is difficult to obtain, such as details on the construction of the building or mechanical system layout (Cotrufo et al., 2020). As the literature review has discussed, AI is a tool with the potential to simplify model development.
The potential of utilizing MPC is vast, and the literature has proven that the strategy can reduce energy use and cost GHG emissions. However, Drgoňa et al. pointed out that despite solid research efforts, practical applications are still in the early stages (Drgoňa et al., 2020).
3 Methods
The takeaway message of the literature review is that AI methods allow the development of advanced tools for improving energy system management. However, the practical implementations are limited and an important field of research. The knowledge of AI in both the industrial and municipal organizations of the partnership is narrow, and it has therefore been a goal that the article appeals to academics and industrialists alike. Industrialists should get a better overview of the possibilities of using AI without fancy algorithms and mathematical derivations. The academic is presented with a description of the practical challenges the industrialists face when developing and operating real-life thermal energy plants. The collaborative effort gives the article a different perspective than most academic literature presenting AI for thermal energy plants and heat pump systems.
Giving the academic and industrial partners access to the TriCEP data was the key to unlocking the collaboration and beginning the project. During a manual investigation of historical data, we discovered patterns that conflicted with our understanding of how the system should operate. Based on these patterns, we suggested that there is room for improvement in the management of the TriCEP and that the AI methods presented in the previous chapter may be valuable tools. Since the TriCEP has ambitious energy and GHG emissions targets and to establish a baseline, we investigated whether the plant has achieved the defined targets during the first years of operation. This section presents the data capture and processing method before defining benchmarking parameters to compare design targets and operational results.
3.1 Data capture and processing
Measurements from building automation and energy management systems, electricity and thermal energy meters, weather and climate stations, utility bills, national reports, and surveys are the most common data sources for training data-driven models (Runge and Zmeureanu, 2019). Measurements represent the most reliable data sources, provided that the quality of measurements is validated. Furthermore, building simulation software can be used to generate data, and thus a data-driven model can be built based on actual, measured data and advanced engineering models.
The municipal partner granted the academic and industrial partners access to their building automation system (BAS), Citect SCADA (Schneider Electric, 2018), and energy management system (EMS), Gurosoft (2022), through a permanent remote access link.
The EMS contains a list of predefined calculations and benchmarking parameters, which the municipal partner uses to report energy and GHG results for all their properties. This list was used to set up the tables in the discussions in Chapter 5 and Chapter 7.
The BAS is a tool to monitor and control building HVAC systems, which contains access to all sensors and historical measurements. In the BAS process view, the user can access figures with historical data for each sensor or measuring unit with manually set time scales and the number of measurements. Data for the previous 13 months down a 1-s resolution can be collected. We captured the data manually by copying and pasting it from the BAS to Excel.
In Excel, we developed a visualizing tool for observing the data and the process. Using a specific cell to set the date and a scrollbar, we observed the process from day to day. We intended to use the tool to manually go through and check a dataset and quickly identify outliers or errors in the data or the process. In addition, the tool has become a supplement to the written control strategy of the plant. It allows the user to identify how the setpoints have influenced the past operation. We generated the figures in chapter 6.1 using this tool.
3.2 Benchmarking parameters for thermal energy plants with heat pumps
An electrically driven heat pump is a thermal energy generator that relates the compressor power
The useable heat depends on the target of the process. For heat production,
The COP is a momentaneous relationship that changes continuously depending on the flow rates and temperature levels of the fluids entering the evaporator and condenser and the part-load conditions of the compressor. For example, when procuring the heat pumps, we used the COP to specify the minimum requirement of the machines at various operating points. In the operational phase, we compare the design and the operational COP to investigate the status of the process, where a negative deviation is a sign that further inquiries should be made.
An electric heat pump’s seasonal coefficient of performance (SCOP) is the ratio between the annual heat energy output and the annual electric energy input. The SCOP depends on the COP, the local climatic conditions, and the integration of the heat pump into the building energy distribution systems (Dones, 2004). The definition of the SCOP is similar to the expression for COP, but it includes the utilization time (
where
The SCOP does not contain information on the overall heat pump contribution to the thermal energy plant. For example, if the heat pump only supplies a small amount of the heat demand, the peak load system may operate more than intended. Then the overall system efficiency can be low, even if the heat pump process is efficient.
The Plant Seasonal Performance Factor (SPFplant) equals the sum of all energy produced from the production units divided by all energy consumed to operate the plant. The higher the value of the parameter is, the more efficient the plant. The SPFplant is defined by the following expression (Harsem et al., 2021):
where
Finally, the efficiency
We used these parameters to define the system during the design phase and to follow up on the operation.
3.3 Evaluation of greenhouse gases emissions
The Norwegian standard NS3720 — Method for greenhouse gas calculations for buildings (SN/K 356, 2018) defined the GHG criteria for the TriCEP. NS3720 is a standard method for calculating GHG emissions in building projects based on the life cycle assessments of a building’s environmental performance. In the TriCEP, energy use in operation was chosen as the single decision parameter, in addition to a more qualitative evaluation of the locality of the energy sources. Annual GHG emissions were calculated based on delivered energy to the system, electricity, natural gas, and biogas, using the following equation with constant GHG emission factors:
where Edel is the total annual GHG emissions from energy use, in kg CO2 equivalents/yr, i is the energy product index, from 1 to N, t is the time index, which goes from 1 to T, T is the maximum value for the time interval (hours = 8,760 in a standard year), wdel(i,t) is delivered energy for the energy product i at time t, kWh/h, and fdel (i,t) is the LCA-based emission factor for delivered energy product i, and in time index t if available; stated in kg CO2e/kWh.
The municipality and consultant defined the constant emissions factors presented in Table 1 based on emission factors from the Centre for Zero Emissions Buildings (ZEB) (Mamo Fufa et al., 2016).
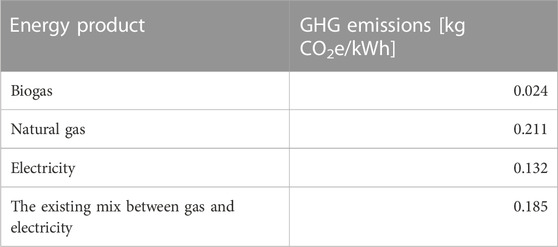
TABLE 1. GHG emission factors used in the work.
4 The case study
Using the TriCEP as our case study, we aim to investigate the practical implementation of AI and MPC in an advanced real-life system. Triangulum was one of 14 European Smart Cities and Communities Lighthouse Projects aiming to demonstrate, disseminate and replicate solutions and frameworks for Europe’s future smart cities. Stavanger, Norway, was selected as one of three Lighthouse Cities to serve as a testbed for innovative projects focusing on sustainable mobility, energy, information and communications technology, and business opportunities (Triangulum, 2018). Twenty-two partners from industry, research, and municipalities cooperated to develop and implement smart solutions and act as lighthouses for replication in follower cities.
Though the Triangulum project officially finished in 2020, this work further develops the project’s targets. Continuing in the lighthouse spirit, the partners share results and accounts of what has worked and where there is room for improvement.
Acting as project owner and manager, the municipality of Stavanger had an active role in Triangulum from start to finish. The municipality defined that its main target was to demonstrate innovative use of local renewable energy sources other than hydropower and design and implement new technology for the inspiration of others (Triangulum, 2018). When the Triangulum project ended in 2019, the municipality launched an official webpage for the plant (Municipality of Stavanger, 2019), with contact information and a principle to share all relevant project documentation with any new project interested in the utilized technologies or the development process. In addition, an interactive plant model, which shows the most crucial process flows, current system temperatures, and a large quantity of historical energy data, is open for all interested (Municipality of Stavanger, 2020).
The academic partner, the University of Stavanger (UiS), set up a data link between the TriCEP and the University during the project. The theoretical and practical experience from the work done at UiS has given the TriCEP project an academic edge from the start. The industrial partner Norconsult AS (Norconsult AS, 2021) developed the concept study, which led to the final TriCEP system configuration and performed the detailed design and construction management. The industrial author is an employee of the industrial partner and had a leading role in developing the TriCEP.
In most projects, after the end of construction, the client takes over the plant, the consultant hours reduce to a minimum, and the municipality gets a new plant in addition to all their existing HVAC systems. Through an industrial Ph.D. initiative, the industrial partner follows up on the project in more detail than usual for a consultancy firm. The industrial Ph.D. program supports an employee of a company to perform a doctoral project, which must be of clear relevance to the company’s activities. It should culminate in concrete research and development results that enhance the company’s core activity, products, and services (The Research Council of Norway, 2019).
4.1 Technical ambitions
The municipality of Stavanger set the following project goals for the TriCEP:
• To develop a fully automated thermal energy plant for heating and cooling production.
• To achieve a 75% reduction in GHG emissions compared to the plant before refurbishment.
• For the plant to only be based on local energy sources.
• To investigate utilizing the local main sewage pipe as an energy reservoir interacting with a heat pump. The system for heat exchange with sewage is presented in Figure 1.
• To be finished and in operation by May 2017.
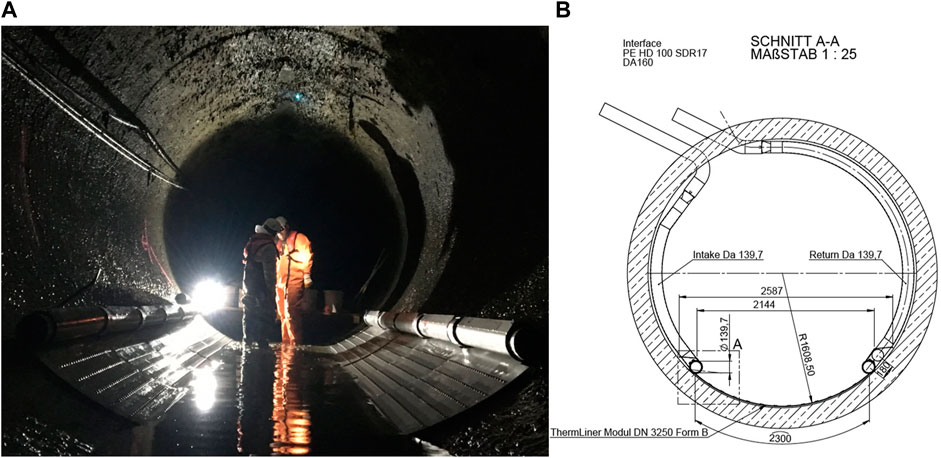
FIGURE 1. Sewage heat exchanger system—360 kW design heat extraction—(A) - from installation in 2017, (B), system specific design principle.
A concept study performed between October 2015 and January 2016 defined the main plant configuration (Fadnes and Havellen, 2016). Several energy production technologies were evaluated separately, and the final system configuration was determined based on the skill and experience of the engineering team. Life cycle costs and GHG emissions reductions were determined for the final concept.
Several local energy sources and systems were investigated, such as geothermal, air, seawater, and sewage heat pumps, solar thermal, grey water recycling, biogas, bio-oil, electrical boilers, photovoltaics, and a local windmill. The final system setup is presented in Figure 2 and consists of the following sources and production units:
• Two heat pumps connected to heat exchangers mounted in the local sewage canal supply the base load heat, DHW, and total cooling load. The system for heat exchange with sewage, see Figure 1, was considered unique in a Norwegian setting, defined as a “smart city” concept, and will be the topic of investigation in a future publication.
• Solar thermal collectors contribute to covering the heat and DHW demand.
• A grey water recycler preheats cold water for DHW.
• A natural gas boiler run on biogas acts as peak load and backup for heat and DHW demands.
• An electrical boiler acts as a backup unit.
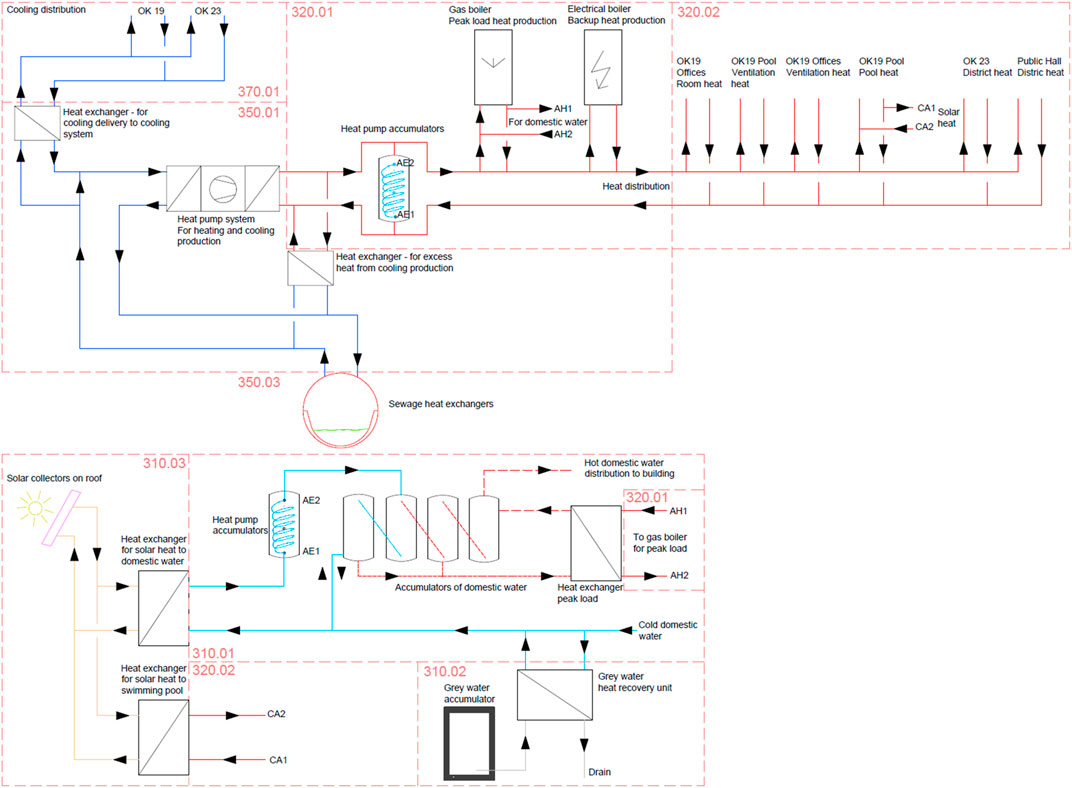
FIGURE 2. Principal system sketch of the TriCEP—top - heating and cooling production and distribution systems; bottom - DHW production system with solar heating, grey water recycling, gas boiler heat exchanger.
The concept study found a reduction of GHG emissions of 80% to be within reach with acceptable life cycle costs.
4.2 Baseline energy demand and GHG emissions
Before the refurbishment, the plant consisted of a natural gas and an electric boiler. In addition, electric panel ovens heated one of the buildings. A mixed original heat factor of 0.185 kg CO2/kWh produced waterborne energy, represented the GHG emissions of the old waterborne system. Local chillers supplied the cooling demands, which were assumed to have an average cooling COP of 2,5 when calculating the electricity demand and GHG emissions.
In addition to refurbishing the thermal energy plant, the municipality removed all existing electric panel ovens, installed a waterborne heat distribution system, demolished all local cooling equipment, and established new cooling pipes between the plant and the buildings. Table 2 presents the project’s official baseline energy demands and resulting GHG emissions.
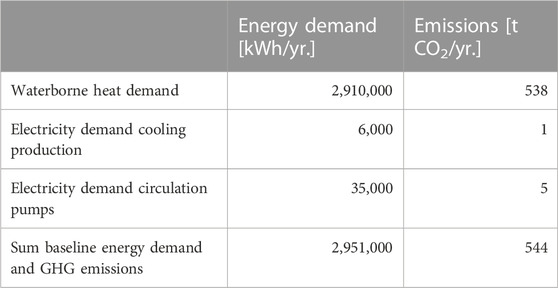
TABLE 2. Project-defined baseline energy demand and GHG emissions.
4.3 Overall thermal energy plant design
Figure 2 presents the main components, system configuration, and flow directions in the TriCEP. The upper part of the figure shows the heating and cooling production system, while the bottom part shows the DHW system. The two systems are physically connected at three locations, denoted AE1/2, AH1/2, and CA1/2.
Two heat pumps, each with a nominal capacity of 250 kW, are the primary heating and cooling production units. They interact with sewage heat exchangers through a 20% mono-ethylene glycol-water brine circulating between the evaporator and sewage. While producing heat, the heat pumps work against an accumulator system on the condenser side. If the heat pumps cannot meet their setpoint, the gas boiler supplies the peak heat. The boiler, which has a nominal capacity of 1,000 kW, also acts as the backup unit. In cooling mode, the heat pumps disconnect from the heating system, and the excess heat at the condenser transfers to the sewage. The boiler provides the heat demand.
The energy modeling software Simien (2022), based on the Norwegian standard NS3031:2014 Calculation of energy performance of buildings—Method and data (Norsk Standard, 2014), was used to evaluate the energy demand profiles for heating and cooling. The design team finetuned the model input parameters in cooperation with the municipal operators and verified the simulation results against historical data. The heat pump capacity of 500 kW was determined based on an energy balance for the heat production system for each hour of the year. Assuming a constant heating COP at every timestep and investigating for several values of maximum heat pump capacity
where scop(t) is the average hourly COP, assumed to be constant,
Ideally, optimizing investment cost for a given capacity and the resulting SPFplant and energy cost should lead to the selection of heat pump capacity. However, the industrial partner used rules of thumb:
• The heat pumps should have sufficient capacity to meet the complete cooling demand.
• At least 90% of the heat demand, excluding DHW, should be met by the heat pumps.
A capacity of 500 kW met both criteria. Then, using the relationships above and the benchmarking parameters presented in chapter 3.2, the design SCOP and SPFplant were determined. These are presented in the design part of Table 4.
There is a significant consumption of DHW for showering in a public swimming pool (Yuan et al., 2021). Compared to the building heat distribution system at 55°C, DHW is produced at a higher temperature, in the range of 65°C–70°C (Toffanin et al., 2021). Ambient temperature conditions do not influence the DHW demand profile; instead, the demand closely follows the swimming pool’s opening hours (Delgado Marín et al., 2019) and is relatively constant over the year. In the TriCEP, cold water is preheated by heat exchange against grey water from the pool showers, increasing the temperature from the municipal water feed level of 5–10 to 20°C–25°C. Nine thermal accumulators, 1,000 L each, are heated by either 180 m2 of solar thermal collectors, the heat pumps, or the gas boiler. The distributed DHW holds a temperature of about 60°C (Toffanin et al., 2021). All accumulators are heated to 70°C using the gas boiler as a safety measure to destroy legionella bacteria.
4.4 Control strategy, energy meters, and sensors
The industrial partner designed the TriCEP control strategy, which consists of standard setpoint and rule-based control schemes. The most important principles are summarized below.
• Ambient temperature control. The end points of a linear correlation between the ambient temperature and the production temperature of each heat pump and the gas boiler can be set manually in the BAS. The cooling production temperature is constant, but the setpoint can be changed.
• The heat pumps can be set to prioritize heat or cooling production from a rule scheme. The scheme is based on the ambient temperature, selected system temperatures, and several time limits. In addition, the BAS allows for a manual switch if the operator observes that the chosen setpoints give unfavorable system conditions.
• Circulation pumps operate at a constant speed, except for the distribution loop pumps. Here pressure difference sensors control the flow rates. The differential pressure targets can be manually set from the BAS.
• The operator must manually set whether to prioritize solar or heat pump heating for DHW. If the latter, solar heating is rerouted to the return pipe of the pool heat exchanger. There are several rules and time limits in the Solar System to ensure that heat is not withdrawn from the system and dispatched and lost to the air through the solar collectors, for example, during the night.
• In general—all setpoints can manually be overwritten in the BAS.
• The plant is equipped with the following meters and sensors:
oSixteen thermal energy meters, consisting of a flow meter, two temperature sensors, and a calculator unit, measure energy production and distribution in the system.
oFour electrical energy meters measure electricity consumption, 1 m per heat pump, one for the electrical boiler, and one for the rest of the consumption, mainly circulation pumps.
oTwo external energy meters from the energy supplier measure total electricity consumption and biogas consumption.
oSeventy-nine temperature sensors, excluding the temperature sensors connected to the thermal energy meters.
oSix absolute pressure sensors, one for each separate water system.
oEight differential pressure sensors, one for each heating and cooling distribution loop.
oOne flow meter measures the flow of the inlet DHW water.
oTwo float switches in the grey water accumulator.
oThirty-three frequency converters are connected to circulation pumps and provide information about pump power consumption.
5 Discussion of operational energy results and GHG reductions
TriCEP officially started producing thermal energy in May 2017 and has since been operating. Here follows a discussion of the accumulated energy data for the four full years of operation, 2018–2021. The municipality has yet to realize the plant’s full potential. Delays in the refurbishment project in the building which houses the TriCEP led to the plant first supplying the complete building cluster with energy in March 2019. The installation of the solar collector system first took place during the summer of 2019. When the plant finally was completed, the COVID-19 pandemic shut down the swimming pool for long stretches in 2020 and 2021. The shutdown influenced the DHW demand, the energy production from the solar collectors, and the contribution from the grey water recycler. Later, the municipality temporarily removed another building temporarily due to a new refurbishment.
Tables 3–6 present selected energy data, while Table 7 shows the resulting GHG emissions. The most representative year for demand evaluations is 2019, as all buildings were in standard operation most of the year. Unfortunately, none of the years give a good representation of the solar collector and the grey water recycling systems.
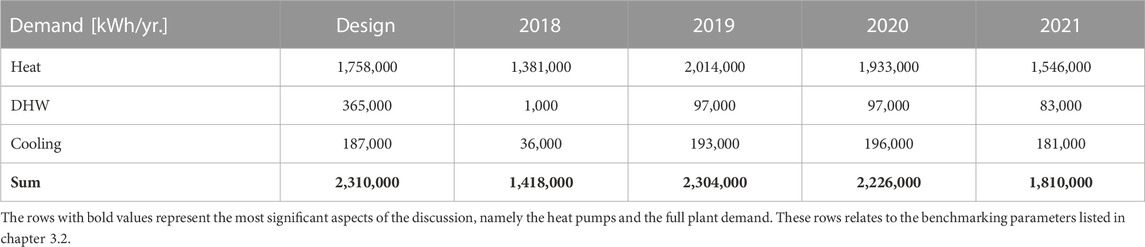
TABLE 3. Design demands and results from 2018 until 2021.
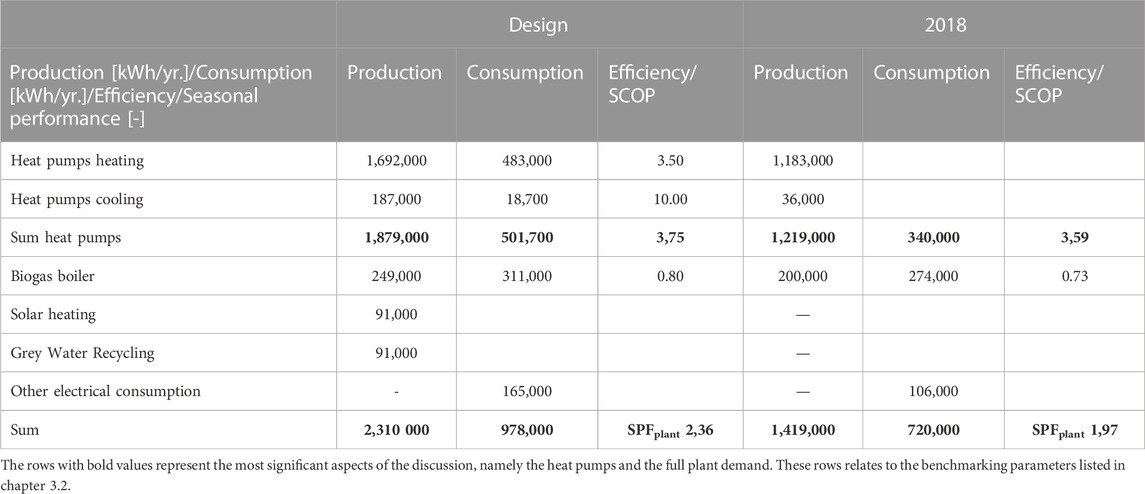
TABLE 4. Energy production and consumption for production units, design targets and results 2018.
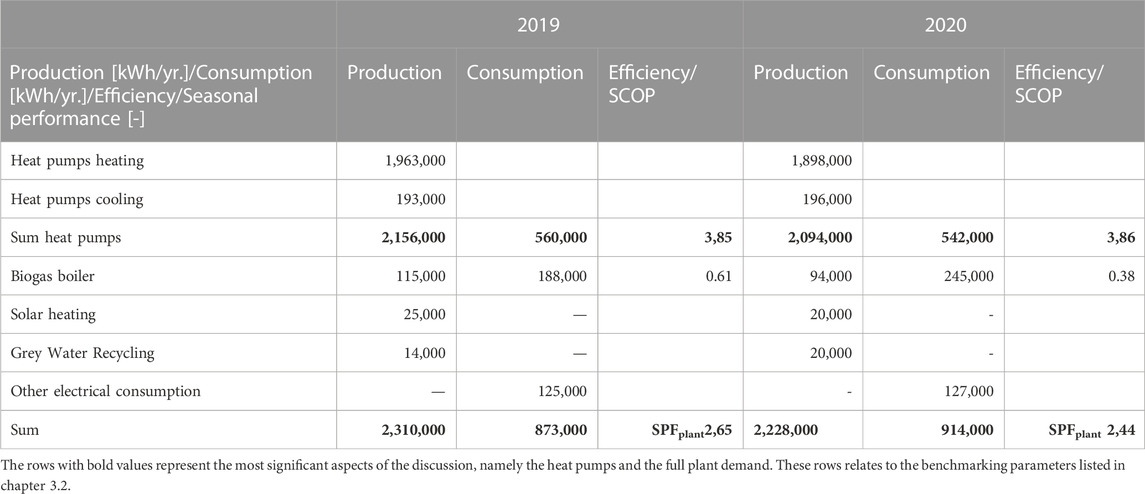
TABLE 5. Energy production and consumption for production units, results 2019 and 2020.
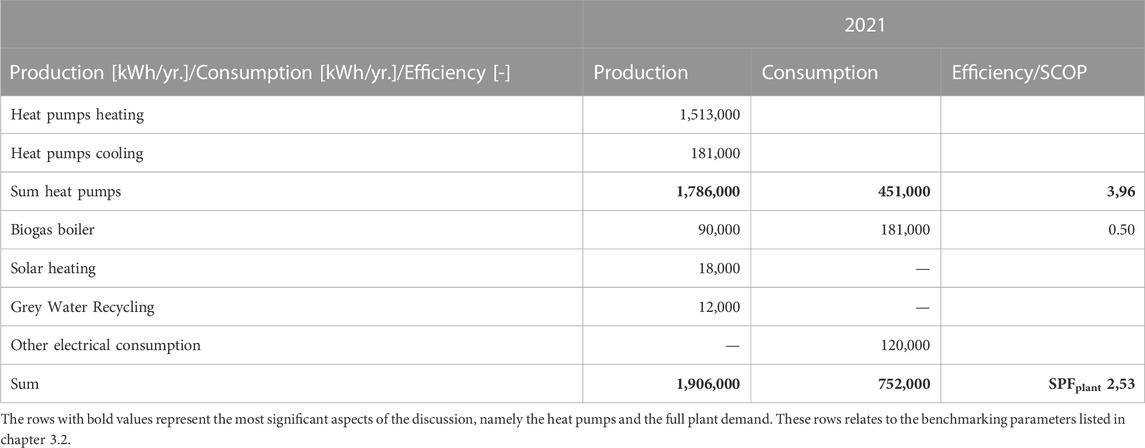
TABLE 6. Energy production and consumption for production units, results 2021.
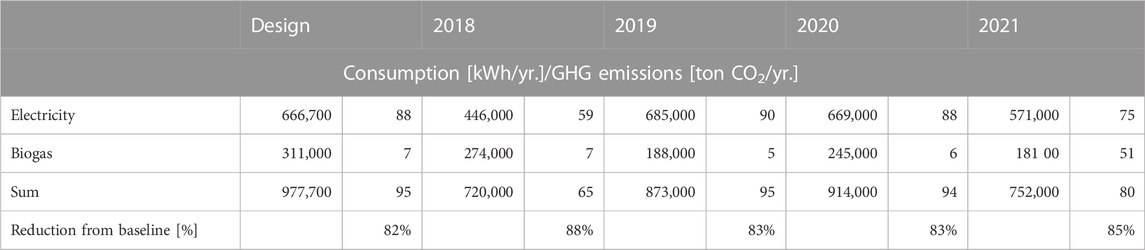
TABLE 7. Historical GHG emissions.
The plant has met the primary target for reduction in GHG emissions every year. This trend was expected when the plant only supplied two of the three buildings. However, even when the total production was relatively close to the design demand, the reductions were higher than the target value. The heat pumps have contributed to more than 90% of the demand most years with high SCOP. Thus, we regard the heat pump system as successful. Still, in Chapter 6, we present observations that indicate there is potential for improvements in this part of the system.
It is impossible to separate when the heat pump electricity consumption goes to heating, cooling, or both simultaneously from the energy meter configuration. In addition, no accurate measurement of the heat pump contribution to DHW exists. Thus, it is impossible to determine the SCOP for heating and cooling production separately. In Tables 4, 6, the row Heat pumps heating represents data from thermal energy meters at each heat pump condenser. In contrast, the row Heat pumps cooling represents summarized data from thermal energy meters in the cooling distribution loops. Registered condenser heat could be from periods without a heat demand and the system in cooling mode, representing excess heat transferred to the sewage. A small continuous cooling demand occurred while the heat pumps operated in heat mode; therefore, the was some simultaneous heat and cooling production. For this discussion, the rows representing the heat pumps give an adequate understanding of their contribution to system. A more precise energy meter setup is recommended for future plants.
The DHW demand in Table 3 is the official reported DHW demand and is calculated from the sum of measured grey water recycling, solar heating, and thermal energy from the gas boiler to the DHW system. The heat pumps’ contribution to DHW is not part of the sum because it cannot be read from the EMS or the BAS. The official reported DHW demand has been lower than the design value all years. The lower demand may be due to the pandemic, but even in 2019, it was lower than the design estimation. The difference between 2019 and 2020/2021 is not significant. Solar heating and grey water recycling have produced significantly less energy than the design targets, which should be inspected closely. Some assumptions, further detailed in a future publication, are presented below.
• The number of pool visitors and the assumed showering time per visitor were lower than the numbers used for design.
• Since grey water recycling is closely related to hot water consumption, lower consumption of hot water leads to less cold water passing through the recycler. In addition, the placement of the grey water recycler in the configuration should be investigated.
• The solar heating efficiency is closely related to the temperature difference between the ambient air and the heat carrier fluid. The higher the temperature difference is, the lower the efficiency (Zijdemans, 2014). Therefore, a lower DHW demand than the design value may have led to higher temperatures in the accumulators and lower efficiency in the Solar System. In addition, the municipality experienced fouling inside several solar collectors, which the supplier and responsible piping company currently investigate.
• The system has a hot water circulator in continuous operation. Thus, there is heat loss from the DHW system, 24/7, even in periods with little activity in the swimming pool. The circulator may explain why the demands in 2020 and 2021 were close to 2019.
The grey water recycler and solar thermal collectors were first set in operation during the summer of 2019 and had no contribution in 2018 and the first half of 2019. There is some energy consumption related to system-specific circulation pumps, but all pumps are lumped together in the row Other electrical consumption in Tables 4, 6.
A separate electricity meter captures all plant electricity consumption except for the heat pump compressor power and electrical boiler consumption, representing the
The biogas boiler efficiency is relatively low. During low heat demand periods, the boiler operates for 5-to-10-min intervals every fourth hour, supplying heat to the DHW system. This short operational span may cause a high loss as the boiler stops before it practically begins to operate (Soma, 2005). A closer investigation should be performed.
6 Investigations of the current TriCEP operation with emphasis on the sewage heat pumps
The overall conclusion is that the main parts of the TriCEP work. Especially the heat pumps provide a high share of the demand with a satisfactory SCOP, leading to a SPFplant that has been higher than the design target each year except the first. Solar heating and grey water recycling have not contributed as expected, but the DHW demand has been lower than the design estimation. The gas boiler efficiency is so low that some inquiries should be made. Overall, the TriCEP fulfills its main operational intention, supplying renewable heating and cooling with a low contribution to GHG emissions. The municipality of Stavanger’s initial conclusion has similarly been that the plant works as intended and that it is an advantage that the operators can prioritize their time solving daily challenges in other, older municipal buildings. If any faults occur in the TriCEP, a notice is given to the operator immediately from the BAS. So far, they have easily fixed most errors.
The municipality of Stavanger is responsible for more than 220 buildings, including schools, kindergartens, nursing homes, community buildings, and ice rinks. The oldest buildings are more than 70 years old, while the newest is an advanced fire station from 2021. Theoretical knowledge, practical experience, system understanding, and sufficient time are needed to operate advanced HVAC systems effectively. The TriCEP has no inherent smartness in its control, and the responsible municipal operators must set specific control parameters as they see best. Future energy prices and weather forecasts influence the optimal setpoint values for these parameters (Wang et al., 2022). However, the operators now primarily define the setpoints based on their “gut feeling” and previous experience. Even a highly qualified and experienced operational organization should welcome tools that help the operators perform their work more effectively.
6.1 Evaluation of operational data and identification of potential system improvements
When the municipality gave the industrial and academic partners access to the TriCEP BAS and EMS, we were able to prioritize time to study the data, investigate the daily operation, and have fruitful discussions with the operators. As the heat pumps have produced more than 90% of the annual thermal energy demand, our main priority is to ensure that they are appropriately utilized. The heat pumps’ mode, heating or cooling, and temperature production setpoints are available for the operator to define. Several unsatisfactory operational conditions were identified.
6.1.1 Switching between heating and cooling mode
The operators report that the pre-set values controlling the automatic switch between heating and cooling modes have not worked satisfactorily, especially on days with both heating and cooling demands. They changed mode as they saw best but may have forgotten to follow up when more pressing priorities in other municipal buildings occurred. Figure 3 presents 25 June 2021, an example of a day with several suboptimal operational situations due to the automatic mode switch. The green and grey curves are metered condenser heat production and electricity consumption, the red and blue curves are outgoing condenser and evaporator temperatures, representing produced heating and cooling temperatures, the yellow curve is the temperature setpoint, and the brown is ambient temperature. When the yellow curve is high at ca. 50°C, the heat pumps are in heat mode, and when the curve is low at ca. +10°C, the heat pumps are in cooling mode.
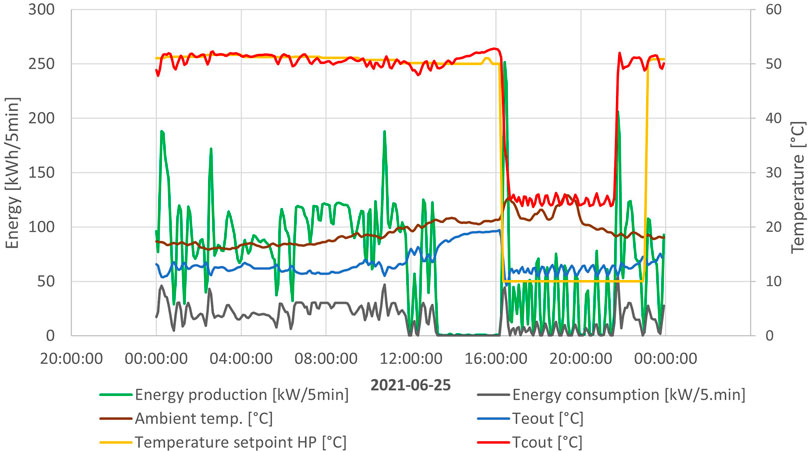
FIGURE 3. Example of day where the automatic switch between heating and cooling mode leads to suboptimal system operation.
Production peaks occurred after the switch, which can be explained by the system configuration. Thus, we consider the peaks a result of a flawed design. A more dynamic setpoint control, where the setpoint is gradually changed instead of abruptly, could eliminate this pattern without physical changes in the system.
No cooling was produced during the daytime when the municipal employees were at the office. Cooling production started at 16:20 when most had gone home. The heat pumps started and stopped continuously in cooling mode, indicating a low demand, perhaps not even an actual demand.
There was significant heat production during the night. However, as an ambient temperature curve controls the temperature setpoint, it is uncertain whether the actual demand was this high on a summer day with ambient temperatures never below +16°C.
In cooling mode, the gas boilers supply the heating system. Thus, if the automatic switch does not happen fast enough and the operator forgets to change it manually, biogas may be used instead of the heat pumps, leading to unnecessary high operational costs.
6.1.2 DHW production—Source priority and heat pump temperature setpoint
A manual control action decides whether the heat pumps or the solar heating are prioritized for the intermediate temperature levels in the DHW system. The industrial plant designer did not manage to write a general rule to set this priority. Instead, the operators must manually choose priority, using the weather forecast and season as help. The choice is complex, and if the control is not followed-up, an unsatisfactory operation may occur for extended periods. If the system is in solar mode and no contribution from the Sun is available, the biogas boiler will supply the DHW demand even when the heat pumps are available. If the system is in heat pump mode, available solar heat may be thrown away. Thus, a tool to help select and set the priority automatically would help the operators.
By standard design, the heat pumps produce heat at lower temperatures when the ambient temperature is high. However, they can be given a constant setpoint at a maximum of 60°C, but this action increases their energy consumption. However, since the DHW holds a distribution temperature of 60°C, and if the electricity prices are low or no solar heat is available, the action may be advantageous compared to using the biogas boiler for DHW. An economic evaluation based on energy prices, weather forecasts, and demand estimations should ideally provide the final answer from day to day.
6.1.3 Peaks due to the current heat pump control setup
We have documented peaks in Figure 3, and within the dashed rectangle in Figure 4, we present another example of how peaks may occur. A quick change in the outgoing condenser temperature led to the heat pump first reducing its capacity before immediately going to maximum capacity again. These quick changes in the system temperatures and the resulting peaks indicate that calibrating the heat pumps’ response to temperature changes should be further investigated.
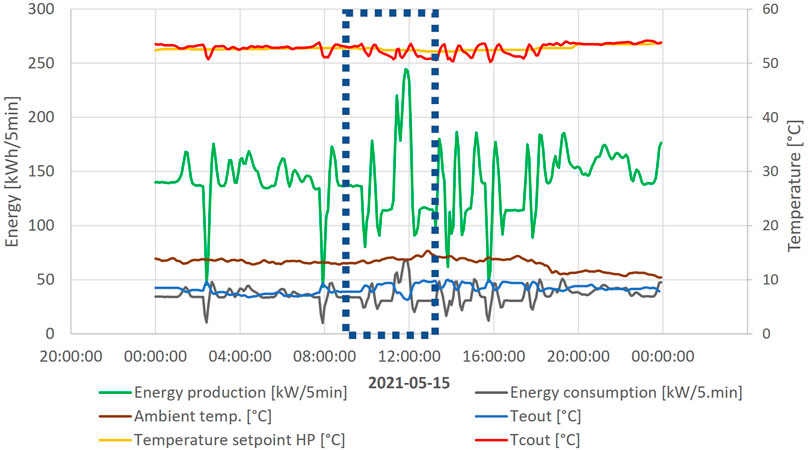
FIGURE 4. Example of typical operation leading to heat pump peaks.
6.1.4 Monitoring and fault detection—A practical example
We have experienced that AI can provide powerful tools for monitoring and fault detection in gas turbine systems. Furthermore, the literature review has clarified that similar methods apply to thermal energy plants and heat pump systems. This section presents a practical example from the TriCEP operation, which a precise predictive model should have been able to recognize.
The filter in the brine system between the heat pumps and the sewage tunnel was clogged with dirt, leading to an operational situation with negative implications for the system The conservation of energy relation for a control volume with one inlet and one outlet with negligible changes in kinetic and potential energies, assuming steady conditions and the absence of any work interactions, defines the relationship between the flow rate, the temperature difference between inlet and outlet, and the heat transfer (Çengel, 2006):
where
The circulation pumps operate at constant flow rates; thus, the maximum temperature difference between the supply and return pipes occurs at the maximum heat extraction from the sewage. During a random check of the BAS, the industrial partner noticed that the temperature difference was higher than expected and suggested a reduction of the flow rate using Eq. 8. Unfortunately, no digital flow measurement was available in this part of the system, and thus no warning had been given to the operators.
The photo on the left in Figure 5 shows that the filter was clogged giving the temperature difference below. After cleaning the filter, the temperature difference dropped to the level on the figure’s right side. Manual measurement of the flow rate documented that the flow had doubled after the cleaning. The heat pumps were not operating at maximum capacity, which is why the temperature difference is lower than the design value reported in chapter 6.3. The consequence of a reduced flow rate is that the evaporation temperature decreases, which leads to higher energy consumption in the heat pump process (Coker, 2015).
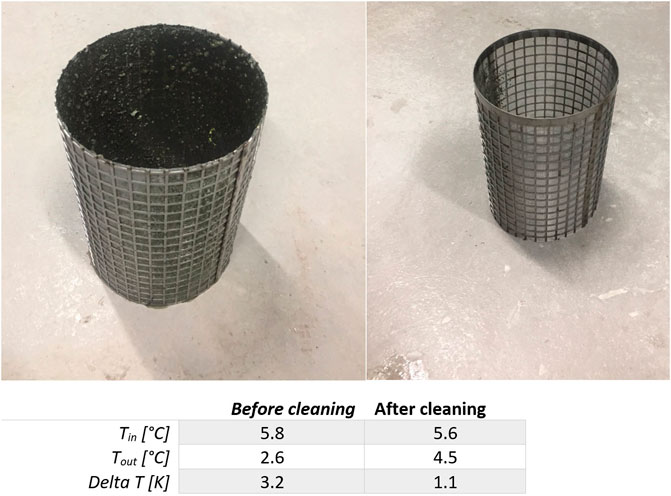
FIGURE 5. Example of influence of clogged filter on temperature difference in sewage heat pump brine system—before and after cleaning.
This observation is not advanced, but a competent person must follow up the system closely. In addition, the operators cannot be expected to remember all design temperature levels by heart. Thus, if a predictive model had been available, it could have reacted immediately when the temperature difference began to deviate from the model, and the filter cleaning could have been performed earlier than it did. Unfortunately, detailed system data from 2018 is unavailable, and it is unknown how the long system was operating before the operator cleaned the filter.
6.2 Energy cost
When performing the concept study for TriCEP, the industrial partner operated with an average electricity cost of ca. 0.1 Euro/kWh in the life cycle cost analysis. The Norwegian and European electricity prices have increased significantly in the last year (Møller and Øverås, 2022). Averaging the electricity spot price for the first 8 months of 2022 in the Stavanger region, the cost of 1 kWh equals almost 0,16 euros in addition to network tariffs and governmental fees. The electricity prices also vary from hour to hour. Figure 6 presents examples of the electricity spot price for selected days, summer and fall of 2022 in Stavanger (Lyse, 2022). A conversion rate of 0,1 Euro per NOK was used in the figure.
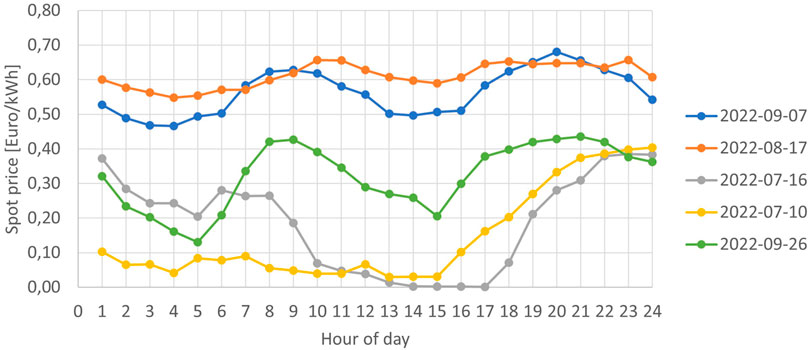
FIGURE 6. Examples of variations in electricity spot price in Stavanger in 2022.
For a system as advanced as the TriCEP, the type of operation which is best suited for a day with an energy cost close to zero during daytime and 0,4 EURO/kWh during afternoon and night-time is not necessarily the best for a day where the price is constantly close to 0,5 EURO/kWh. The energy prices do not influence the automatic operation of the system, and the operators have no tool to help them decide how to define setpoints based on future energy prices.
6.3 Evaluation of the potential for introducing smart technology in the TriCEP
Even though the average heat pump production and consumption results are close to the design targets, there is randomness and suboptimal operation in this part of the system. The analysis of Busato et al. of a multi-source heat pump system revealed that not only is a good plant design and control logic necessary, but an in-depth energy analysis based on operational monitoring is critical to keep the energy efficiency at or above the design value (Busato et al., 2021).
Both the limits controlling the switch between heating and cooling priority and the heat pump setpoint control can be improved and help to set the priority of energy source for DHW is desired. The literature indicates that MPC is a promising tool that could lead to more efficient operation and help the operators determine the setpoints based on mathematical optimization. Killian and Kozek stated that MPC can be integrated into existing control systems for supervisory control while retaining the existing local control loops (Killian and Kozek, 2016), thus enabling retrofitting with little influence on the existing control system.
Building MPC is generally more expensive than traditional rule-based control due to increased engineering costs and additional software and hardware. The increased engineering costs are primarily a result of the model development process (Killian and Kozek, 2016). Our experience is that the type of non-linear model development a thermal energy plant like TriCEP would require is beyond most Norwegian building projects’ economic scope and available project time. The TriCEP supplies three buildings with thermal energy at several temperature levels; the buildings are of different ages and have different energy standards with separate, independent control systems. In addition, the plant has ambient temperature-induced and process demands, such as computer cooling, pool water heating, and DHW. The TriCEP consists of custom-made equipment in a non-standardized overall system configuration. The custom-built heat pumps have four compressors each and inverter control; only their design points are officially defined for the operator. Their operation in off-design needs to be clarified, as the manufacturer has not made a product-specific model available. The heat pumps were specified to produce 250 kW heat with condenser and evaporator inlet/outlet temperatures of +40/46°C/+5/+1°C, respectively. Figure 7 documents the measured energy production of one of the heat pumps between September 2021 and August 2022 and shows that production as high as 250 kW never occurred. The heat pump operated at other temperature levels than the design point.
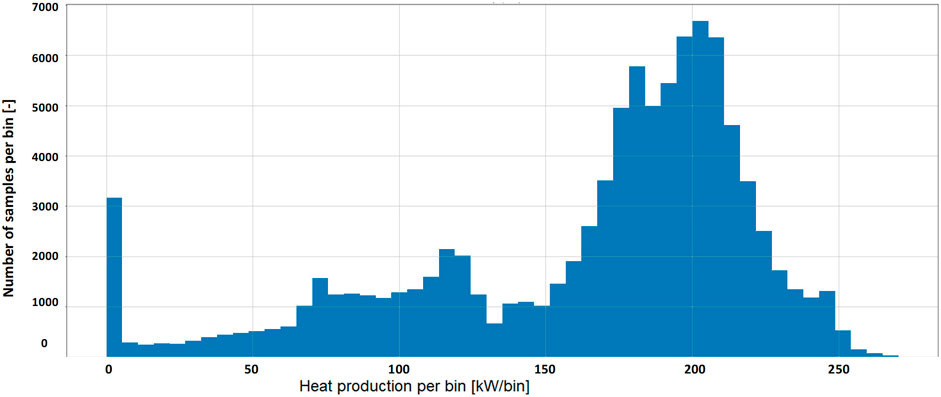
FIGURE 7. Measured thermal energy production [kW] for heat pump 350.01-IK001, sorted into 50 bins of ca. 5 kW per bin.
No analytical model of either the heat pumps or the plant is available. No one has evaluated the defined ambient temperature curves controlling the production setpoint of the heat pumps and the gas boiler analytically. Furthermore, other factors than the ambient temperature influence the heat demand, such as solar radiation, plant setpoints, room and water temperature, and night setback (Lazzarin and Noro, 2018). Even with time and money, developing an accurate physical model of the system takes time and effort.
The data from the energy meters and sensors in the plant, combined with AI methods, provide the project partners with promising tools to increase the control and management of the TriCEP. We aim to develop a data-driven model which can accurately predict the process. Based on the research group’s experience, the modeling approach will be ANN of the various subsystems, using a similar methodology as Assadi and Fast at the hybrid power plant Västhamnsverket (Assadi and Fast, 2006). In addition to being a tool for real-time monitoring, we will investigate if the model can be used to develop optimization suggestions based on MPC principles. Given the TriCEP’s design target of reducing GHG emissions, this is a crucial optimization goal that we will see against the energy cost.
Teng et al. stated that today’s computing power and research experience have made training data-driven models as easy as loading a dataset and pressing a button. However, they warned that too much research goes into making advanced data-driven models, in contrast to ensuring the quality of the industrial data (Teng et al., 2021). In addition to modeling, data acquisition, data cleaning, and industrial implementation demand attention. Introducing domain knowledge by an expert can further improve data-driven modeling (Singh et al., 2022), and even basic system knowledge can lead to simplifications and more specificity in model development (Mahbub et al., 2016). Stoustrup et al. emphasized that advanced theoretical control solutions must be industrially feasible. They suggested that industrial and academic partnerships should have an explicit project phase investigating going from an advanced control solution of high complexity to a solution with the complexity required for industrial implementation (Stoustrup, 2013).
The partners who make up the authoring team of this article, inspired by the warnings and recommendations from the literature, aim to keep a practical perspective throughout the whole project. Therefore, instead of delving deep into advanced modeling, we attempt to find a level that is enough to provide the operators with valuable information but keeping it as simple as a municipal consulting contract can afford to include. This strategy allows us to investigate if we can develop AI for thermal energy systems as a product or concept for sale.
7 Conclusion
The TriCEP is a unique thermal energy system by Norwegian standards due to the heat pump reservoir technology, the combination of several renewable sources, and the municipal owner’s principle of sharing their data and opening their fully operational plant for research purposes.
This article has documented that the municipality of Stavanger can report significant reductions in GHG emission compared to their baseline and heat pumps which produce thermal energy with consistently high SCOP. Still, there is a potential to improve the operation. The potential can be achieved by spending more resources following up and maintaining the plant manually or by continuing to investigate the potential of AI methods. The examples from the open literature presented in the article indicate that AI-based modeling and control of thermal energy plants and heat pump systems is a growing field of research (Ahmad et al., 2016), which may ultimately provide operators with tools for advanced holistic management of the systems. In addition to serving as a monitoring system capable of detecting faults, a predictive model can help operators make intelligent decisions based on mathematical optimizations. Several control actions ideal for evaluation using MPC in TriCEP have been identified, such as.
• Determining when the heat pumps should prioritize heating and cooling.
• Determining when the heat pumps and the solar collectors should be prioritized for DHW heating.
• Continuously evaluating and updating the temperature setpoints of the heat pumps and gas boiler to consider influences beyond the ambient temperature, which controls the setpoints today.
The first companies to provide services and expertise related to MPC can expect to acquire a significant market share (Killian and Kozek, 2016). For the industrial partner defining a new market segment focusing on the practical implementation of AI and holistic management of thermal energy plants appears alluring. Concrete project results for a consultancy company will include knowledge of necessary sensor setup, data capture and processing methods, model development, optimization methodologies, and practical implementation skills. The results should culminate in standard project building blocks that several employees can utilize.
For the municipal partner, managing this specific energy plant is important due to the potential to reduce operational costs, emissions, equipment wear, and free operator time. However, an even more significant advantage would be if a larger number of municipal buildings could be equipped with necessary sensors and connected to an overall “smart” management system. The TriCEP is a unique plant, but several municipal buildings have smaller heat pump systems with similar standard designs. The municipal EMS reports the energy consumption of all buildings connected to the system, see Table 8. The average electricity consumption was about 80,000 000 kWh/year in 2018–2021, and the average of the sum of biogas, natural gas, district heating, and district cooling equaled about 10,000 000 kWh/year. Thus, the annual energy consumed in the TriCEP equals ca. 1% of the total municipal energy consumption. Though primarily based on simulation, the literature reports the potential for significant reductions in energy demand and consumption using AI methods. For example, Killian and Kozek achieved energy savings between 31% and 36% in a real-life project (Killian and Kozek, 2018). We do not expect all municipal buildings to achieve the same improvement as a dedicated research project. However, even a minor reduction in some buildings would significantly contribute to the municipal energy and GHG results. Thus, if the partnership successfully develops an advantageous holistic management system for the TriCEP, we can likely develop similar systems for the smaller plants, allowing standardization for the simpler systems.
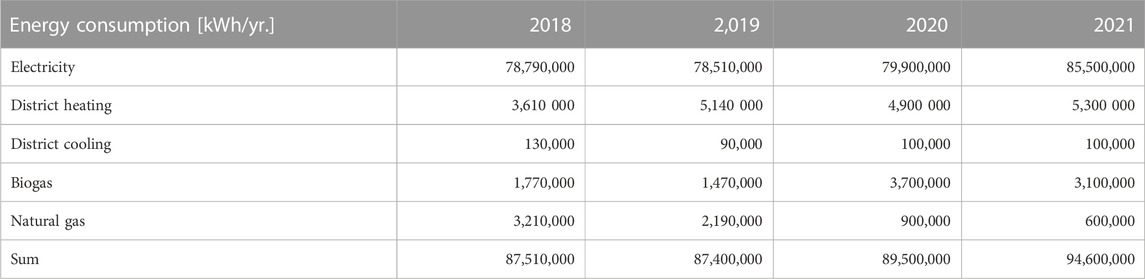
TABLE 8. Historical energy consumption all municipal buildings connected to Gurosoft EMS.
For academic institutions, participating in industrial and municipal partnerships not only provides highly relevant datasets to test and validate models against, but the industry will get a fundamentally better understanding of the possibilities within the state-of-the-art and how to utilize it. In addition, by offering academic services and developing projects with the industry, universities can offer the next-generation of engineers and energy experts a taste of what awaits them in an industrial company. This collaboration may help build even stronger connections, which is highly important considering the current global energy targets.
Data availability statement
The original contributions presented in the study are included in the article/supplementary material, further inquiries can be directed to the corresponding author.
Author contributions
FSF: Conceptualization, data collection and processing, formal analysis, writing—original draft preparation. MA: Conceptualization, writing—review and editing, supervision, validation. EO: Data collection and processing and writing—review.
Funding
The research presented in this article has been financed by Norconsult AS and the Research Council of Norway.
Acknowledgments
The authors would like to thank municipal employees in Stavanger for discussions and advice. The authors appreciate the feedback and suggestions received from colleagues and friends.
Conflict of interest
Author FSF is employed by Department of Energy and Smart Technology, Norconsult AS, Sandvika, Norway.
The remaining authors declare that the research was conducted in the absence of any commercial or financial relationships that could be construed as a potential conflict of interest.
Publisher’s note
All claims expressed in this article are solely those of the authors and do not necessarily represent those of their affiliated organizations, or those of the publisher, the editors and the reviewers. Any product that may be evaluated in this article, or claim that may be made by its manufacturer, is not guaranteed or endorsed by the publisher.
References
Aasland, T. (2022). in Redegjørelse i Stortinget om kraftsituasjonen 19. september 2022 (Oslo: Ministry of Petroleum and Energy). Available at: https://www.regjeringen.no/en/dep/oed/id750/.
Ahmad, M. W., Mourshed, M., Yuce, B., and Rezgui, Y. (2016). Computational intelligence techniques for HVAC systems: A review. Build. Simul. 9 (4), 359–398. doi:10.1007/s12273-016-0285-4
Ahmed, F., Fattani, M. T., Ali, S. R., and Enam, R. N. (2022a). Strengthening the bridge between academic and the industry through the academia-industry collaboration plan design model. Front. Psychol. 13, 875940. doi:10.3389/fpsyg.2022.875940
Ahmed, A. A., Assadi, M., Kalantar, A., Sliwa, T., and Sapińska-Śliwa, A. (2022b). A critical review on the use of shallow geothermal energy systems for heating and cooling purposes. Energies 15, 4281. doi:10.3390/en15124281
Andresen, T., Nekså, P., and Stene, J. (2002). “Heat pumps in smart energy-efficient buildings A state-of-the-art report,” in Smart energy-efficient buildings. NTNU and SINTEF.
Arteconi, A., Brandoni, C., Rossi, G., and Polonara, F. (2013). Experimental evaluation and dynamic simulation of a ground coupled heat pump for a commercial building. Int. J. Energy Res. 37. doi:10.1002/er.3059
Bechtler, H., Browne, M. W., Bansal, P. K., and Kecman, V. (2001). New approach to dynamic modelling of vapour-compression liquid chillers: Artificial neural networks. Appl. Therm. Eng. 21, 941–953. doi:10.1016/s1359-4311(00)00093-4
Behzadi, A., Holmberg, S., Duwig, C., Haghighat, F., Ooka, R., and Sadrizadeh, S. (2022). Smart design and control of thermal energy storage in low-temperature heating and high-temperature cooling systems: A comprehensive review. Renew. Sustain. Energy Rev. 166, 112625. doi:10.1016/j.rser.2022.112625
Bellanco, I., Fuentes, E., Vallès, M., and Salom, J. (2021). A review of the fault behavior of heat pumps and measurements, detection and diagnosis methods including virtual sensors. J. Build. Eng. 39, 102254. doi:10.1016/j.jobe.2021.102254
Busato, F., Lazzarin, R., and Noro, M. (2021). The control of renewable energies to improve the performance of multisource heat pump systems: A two-case study. Appl. Sci. 11, 6653. doi:10.3390/app11146653
Casteleiro-Roca, J. L., Quintián, H., Calvo-Rolle, J. L., Corchado, E., del Carmen Meizoso-López, M., and Piñón-Pazos, A. (2016). An intelligent fault detection system for a heat pump installation based on a geothermal heat exchanger. J. Appl. Log. 17, 36–47. doi:10.1016/j.jal.2015.09.007
Çengel, Y. A. (2006). Heat and mass transfer: A practical approach. lacklick, Ohio, U.S.A.: McGraw-Hill Science Engineering.
Coker, A. K. (2015). Ludwig's applied process design for chemical and petrochemical plants (fourth edition). Oxford: Gulf Professional Publishing.
Cotrufo, N., Saloux, E., Hardy, J. M., Candanedo, J. A., and Platon, R. (2020). A practical artificial intelligence-based approach for predictive control in commercial and institutional buildings. Energy Build. 206, 109563. doi:10.1016/j.enbuild.2019.109563
Delgado Marín, J. P., Vera García, F., and García Cascales, J. R. (2019). Use of a predictive control to improve the energy efficiency in indoor swimming pools using solar thermal energy. Sol. Energy 179, 380–390. doi:10.1016/j.solener.2019.01.004
Dones, R., Heck, T., and Hirschberg, S. (2004). Greenhouse gas emissions from energy systems, comparison and overview. Elsevier.
Drgoňa, J., Arroyo, J., Cupeiro Figueroa, I., Blum, D., Arendt, K., Kim, D., et al. (2020). All you need to know about model predictive control for buildings. Annu. Rev. Control 50, 190–232. doi:10.1016/j.arcontrol.2020.09.001
Eddy, M. A. (2022). “How Europeans are responding to exorbitant gas and power bills,” in The New York times.
Eom, Y. H., Yoo, J. W., Hong, S. B., and Kim, M. S. (2019). Refrigerant charge fault detection method of air source heat pump system using convolutional neural network for energy saving. Energy 187, 115877. doi:10.1016/j.energy.2019.115877
Escrivá-Escrivá, G., Segura-Heras, I., and Alcázar-Ortega, M. (2010). Application of an energy management and control system to assess the potential of different control strategies in HVAC systems. Energy Build. 42 (11), 2258–2267. doi:10.1016/j.enbuild.2010.07.023
Esen, H., and Inalli, M. (2010). ANN and ANFIS models for performance evaluation of a vertical ground source heat pump system. Expert Syst. Appl. 37 (12), 8134–8147. doi:10.1016/j.eswa.2010.05.074
Esen, H., and Inalli, M. (2009). Modelling of a vertical ground coupled heat pump system by using artificial neural networks. Expert Syst. Appl. 36 (7), 10229–10238. doi:10.1016/j.eswa.2009.01.055
Esen, H., Inalli, M., Sengur, A., and Esen, M. (2008a). Artificial neural networks and adaptive neuro-fuzzy assessments for ground-coupled heat pump system. Energy Build. 40 (6), 1074–1083. doi:10.1016/j.enbuild.2007.10.002
Esen, H., Inalli, M., Sengur, A., and Esen, M. (2008b). Forecasting of a ground-coupled heat pump performance using neural networks with statistical data weighting pre-processing. Int. J. Therm. Sci. 47 (4), 431–441. doi:10.1016/j.ijthermalsci.2007.03.004
Esen, H., Inalli, M., Sengur, A., and Esen, M. (2008c). Performance prediction of a ground-coupled heat pump system using artificial neural networks. Expert Syst. Appl. 35 (4), 1940–1948. doi:10.1016/j.eswa.2007.08.081
European Commission (2020). In focus: Energy efficiency in buildings. Brussels: European Commission. [Online]. Available: https://ec.europa.eu/info/news/focus-energy-efficiency-buildings-2020-lut-17_en [Accessed].
Fadnes, F. S., and Havellen, V. (2016). RIV-R01-D02-Konseptvalg teknisk løsning av nytt energianlegg i Stavanger.
Gallagher, C. V., Leahy, K., O’Donovan, P., Bruton, K., and O’Sullivan, D. T. J. (2019). IntelliMaV: A cloud computing measurement and verification 2.0 application for automated, near real-time energy savings quantification and performance deviation detection. Energy Build. 185, 26–38. doi:10.1016/j.enbuild.2018.12.034
Gaur, A. S., Fitiwi, D. Z., and Curtis, J. (2021). Heat pumps and our low-carbon future: A comprehensive review. Energy Res. Soc. Sci. 71, 101764. doi:10.1016/j.erss.2020.101764
Gurosoft (2022). Gurusoft EOS - veien til redusert forbruk. [Online]. Available: https://www.gurusoft.no/gurusoft-eos?parent=10001 [Accessed].
Harsem, T. T., Nourozi, B., Behzadi, A., and Sadrizadeh, S. (2021). Design and parametric investigation of an efficient heating system, an effort to obtain a higher seasonal performance factor. Energies 14, 8475. doi:10.3390/en14248475
Haykin, S. (2009). Neural networks and learning machines. Upper Saddle River, NJ: Pearson Education, Inc.
Killian, M., and Kozek, M. (2016). Ten questions concerning model predictive control for energy efficient buildings. Build. Environ. 105, 403–412. doi:10.1016/j.buildenv.2016.05.034
Killian, M., and Kozek, M. (2018). Implementation of cooperative Fuzzy model predictive control for an energy-efficient office building. Energy Build. 158, 1404–1416. doi:10.1016/j.enbuild.2017.11.021
Lazzarin, R., and Noro, M. (2018). Lessons learned from long term monitoring of a multisource heat pump system. Energy Build. 174, 335–346. doi:10.1016/j.enbuild.2018.06.051
Lyse (2022). Strømprisene - time for time. [Online]. Available: https://www.lyse.no/strom/strompriser?postnummer=4005 [Accessed].
Mahbub, M. S., Wagner, M., and Crema, L. (2016). Incorporating domain knowledge into the optimization of energy systems. Appl. Soft Comput. 47, 483–493. doi:10.1016/j.asoc.2016.06.013
Mamo Fufa, S., Schlanbusch, R. D., Sørnes, K., Inman, M. R., and Andresen, I. (2016). A Norwegian ZEB definition guideline.
Máša, V., Stehlík, P., Touš, M., and Vondra, M. (2018). Key pillars of successful energy saving projects in small and medium industrial enterprises. Energy 158, 293–304. doi:10.1016/j.energy.2018.06.018
Mayer, B., Killian, M., and Kozek, M. (2015). Management of hybrid energy supply systems in buildings using mixed-integer model predictive control. Energy Convers. Manag. 98, 470–483. doi:10.1016/j.enconman.2015.02.076
Mayer, B., Killian, M., and Kozek, M. (2017). Hierarchical model predictive control for sustainable building automation. Sustainability 9. doi:10.3390/su9020264
Mohanraj, M., Jayaraj, S., and Muraleedharan, C. (2012). Applications of artificial neural networks for refrigeration, air-conditioning and heat pump systems—a review. Renew. Sustain. Energy Rev. 16 (2), 1340–1358. doi:10.1016/j.rser.2011.10.015
Møller, U., and Øverås, A. (2022). Derfor er strømprisen uvanlig høy [Online]. Oslo: Energi Norge. Available: https://www.energinorge.no/fagomrader/strommarked/derfor-er-stromprisen-hoyere-i-ar-enn-i-fjor/ [Accessed].
Municipality of Stavanger (2019). Energisentralen. [Online]. Available: https://triangulum.no/prosjekt/energisentralen/ [Accessed].
Municipality of Stavanger (2020). Fra kloakk til energi. [Online]. Available: https://www.stavanger.kommune.no/samfunnsutvikling/prosjekter/triangulum/energisentralen/ [Accessed].
Nikpey, H., Assadi, M., and Breuhaus, P. (2013). Development of an optimized artificial neural network model for combined heat and power micro gas turbines. Appl. Energy 108, 137–148. doi:10.1016/j.apenergy.2013.03.016
Nikpey, H., Hölle, M., Hönen, H., and Assadi, M. (2020). A novel approach based on artificial neural network for calibration of multi-hole pressure probes. Flow Meas. Instrum. 73, 101739. doi:10.1016/j.flowmeasinst.2020.101739
Norsk Standard (2014). NS 3031: 2014–Calculation of energy performance of buildings — method and data. Oslo: Norwegian Standards.
Norwegian Ministry of Trade, Industry and Fisheries (2022). 3 milliarder til å trygge arbeidsplasser og forsterke energiomstillingen.
Noye, S., Rubén, M., Carnieletto, L., De Carli, M., and Castelruiz Aguirre, A. (2022). A review of advanced ground source heat pump control: Artificial intelligence for autonomous and adaptive control. Renew. Sustain. Energy Rev. 153, 111685. doi:10.1016/j.rser.2021.111685
Opalic, S. M., Goodwin, M., Jiao, L., Nielsen, H. K., Pardiñas, Á. Á., Hafner, A., et al. (2020). ANN modelling of CO2 refrigerant cooling system COP in a smart warehouse. J. Clean. Prod. 260, 120887. doi:10.1016/j.jclepro.2020.120887
Perera, A. T. D., Wickramasinghe, P. U., Nik, V. M., and Scartezzini, J.-L. (2019). Machine learning methods to assist energy system optimization. Appl. Energy 243, 191–205. doi:10.1016/j.apenergy.2019.03.202
Puttige, A. R., Andersson, S., Östin, R., and Olofsson, T. (2022). Modeling and optimization of hybrid ground source heat pump with district heating and cooling. Energy Build. 264, 112065. doi:10.1016/j.enbuild.2022.112065
Qin, S. J., and Badgwell, T. A. (2003). A survey of industrial model predictive control technology. Control Eng. Pract. 11 (7), 733–764. doi:10.1016/s0967-0661(02)00186-7
Rastegarpour, S., Scattolini, R., and Ferrarini, L. (2021). Performance improvement of an air-to-water heat pump through linear time-varying MPC with adaptive COP predictor. J. Process Control 99, 69–78. doi:10.1016/j.jprocont.2021.01.006
Reynolds, J., Rezgui, Y., Kwan, A., and Piriou, S. (2018). A zone-level, building energy optimisation combining an artificial neural network, a genetic algorithm, and model predictive control. Energy 151, 729–739. doi:10.1016/j.energy.2018.03.113
Reynolds, J., Ahmad, M. W., Rezgui, Y., and Hippolyte, J.-L. (2019). Operational supply and demand optimisation of a multi-vector district energy system using artificial neural networks and a genetic algorithm. Appl. Energy 235, 699–713. doi:10.1016/j.apenergy.2018.11.001
Runge, J., and Zmeureanu, R. (2019). Forecasting energy use in buildings using artificial neural networks: A review. Energies 12, 254. doi:10.3390/en12173254
Seborg, D. E., Edgar, T. F., Mellichamp, D. A., and Doyle, F. J. (2011). Process dynamics and control. John Wiley and Sons.
Simien (2022). Simien [online]. Available: https://simien.no/om-oss/ [Accessed].
Singh, M., Fuenmayor, E., Hinchy, E. P., Qiao, Y., Murray, N., and Devine, D. (2021). Digital twin: Origin to future. Appl. Syst. Innov. 4, 36. doi:10.3390/asi4020036
Singh, V., Mathur, J., and Bhatia, A. (2022). A comprehensive review: Fault detection, diagnostics, prognostics, and fault modeling in HVAC systems. Int. J. Refrig. 144, 283–295. doi:10.1016/j.ijrefrig.2022.08.017
Soma, M. H. (2005). in EUs bygningsdirektiv - delprosjekt (DP) 3-ettersyn kjelanlegg. Editor N. Energi (Oslo: NVE).
Stoustrup, J. (2013). Successful industry/academia cooperation: From simple via complex to lucid solutions. Eur. J. Control 19 (5), 358–368. doi:10.1016/j.ejcon.2013.06.001
Sun, Z., Jin, H., Gu, J., Huang, Y., Wang, X., and Shen, X. (2019). Gradual fault early stage diagnosis for air source heat pump system using deep learning techniques. Int. J. Refrig. 107, 63–72. doi:10.1016/j.ijrefrig.2019.07.020
Swider, D. J., Browne, M. W., Bansal, P. K., and Kecman, V. (2001). Modelling of vapour-compression liquid chillers with neural networks. Appl. Therm. Eng. 21 21, 311–329. doi:10.1016/s1359-4311(00)00036-3
Teng, S. Y., Touš, M., Leong, W. D., How, B. S., Lam, H. L., and Máša, V. (2021). Recent advances on industrial data-driven energy savings: Digital twins and infrastructures. Renew. Sustain. Energy Rev. 135, 110208. doi:10.1016/j.rser.2020.110208
The Research Council of Norway (2019). Industrial Ph.D. Scheme – doctoral projects in industry [online]. Oslo: The Research Council of Norway. Available: https://www.forskningsradet.no/en/apply-for-funding/funding-from-the-research-council/industrial-ph.d.-scheme–doctoral-projects-in-industry/ [Accessed 01 2020].
Toffanin, R., Curti, V., and Barbato, M. C. (2021). Impact of Legionella regulation on a 4th generation district heating substation energy use and cost: The case of a Swiss single-family household. Energy 228, 120473. doi:10.1016/j.energy.2021.120473
Triangulum (2018). Triangulum - city of stavanger, Norway [online]. Stuttgart: Fraunhofer IAO. Available: https://triangulum-project.eu/?page_id=2326 [Accessed].
United Nations (2021). What is the Paris agreement? [Online]. Bonn: United Nations. Available: https://unfccc.int/process-and-meetings/the-paris-agreement/the-paris-agreement [Accessed].
Wang, Z., Calautit, J., Wei, S., Tien, P. W., and Xia, L. (2022). Real-time building heat gains prediction and optimization of HVAC setpoint: An integrated framework. J. Build. Eng. 49, 104103. doi:10.1016/j.jobe.2022.104103
Yuan, X., Lindroos, L., Jokisalo, J., Kosonen, R., Pan, Y., and Jin, H. (2021). Demand response potential of district heating in a swimming hall in Finland. Energy Build. 248, 111149. doi:10.1016/j.enbuild.2021.111149
Yunna, W., and Ruhang, X. (2013). Green building development in China-based on heat pump demonstration projects. Renew. Energy 53, 211–219. doi:10.1016/j.renene.2012.11.021
Nomenclature
Abbreviations
AI Artificial Intelligence
ANN Artificial Neural Network
BHE Borehole heat exchanger
COP Coefficient of Performance
DHW Domestic Hot Water
EU European Union
FDD Fault detection and diagnosis
GHG Greenhouse gas
GSHP Ground-source Heat Pump
HVAC Heating, ventilation, and air-conditioning
IoT Internet of Things
MPC Model Predictive Control
MAE Mean absolute error
RMS Root-Mean-Square
SCOP Seasonal Coefficient of Performance
SPFplant Seasonal Performance Factor Plant
TriCEP Triangulum Central Energy Plant
UiS University of Stavanger
ZEB Centre for Zero Emissions Buildings.
Keywords: sewage heat pumps, artificial neural network, thermal energy plant, model predictive control, operational review, holistic management strategies, academic-industrial collaborations
Citation: Fadnes FS, Olsen E and Assadi M (2023) Holistic management of a smart city thermal energy plant with sewage heat pumps, solar heating, and grey water recycling. Front. Energy Res. 11:1078603. doi: 10.3389/fenrg.2023.1078603
Received: 24 October 2022; Accepted: 07 February 2023;
Published: 22 February 2023.
Edited by:
Eugeny Kenig, University of Paderborn, GermanyReviewed by:
Olga Arsenyeva, O.M. Beketov National University of Urban Economy in Kharkiv, UkraineRui Jing, Xiamen University, China
Copyright © 2023 Fadnes, Olsen and Assadi. This is an open-access article distributed under the terms of the Creative Commons Attribution License (CC BY). The use, distribution or reproduction in other forums is permitted, provided the original author(s) and the copyright owner(s) are credited and that the original publication in this journal is cited, in accordance with accepted academic practice. No use, distribution or reproduction is permitted which does not comply with these terms.
*Correspondence: Mohsen Assadi, bW9oc2VuLmFzc2FkaUB1aXMubm8=