 Sicong Liu
 Chengzhu Gong
 Kai Pan
- 1School of Economics and Management, China University of Geosciences, Wuhan, China
- 2Center for Energy and Environmental Management and Decision-making, China University of Geosciences, Wuhan, China
- 3PetroChina Planning and Engineering Institute, China National Petroleum Corporation, Beijing, China
Frequent geopolitical events have reduced the stability of natural gas supply and caused drastic price fluctuations, which poses a new challenge to the natural gas consumer market. To improve the anti-risk ability of the natural gas industrial market, this study constructs a new customer value portrait framework to discern the industrial customer value based on different types of behavioral features and the emerging trends of the natural gas market. Specifically, we rediscover the value composition of natural gas industrial customers and establish a set of indicators to reflect the customer value in different dimensions with mixed data types. Then, a visualizable customer value classification model has been established by combining Gower’s dissimilarity coefficient with the PAM clustering algorithm. To ensure the accuracy of the clustering results, the optimal number of clusters is determined by gap statistics and elbow point, and the average silhouette method is used to detect the clustering effect as well as used in misclassified sample identification. To verify the applicability of the model, we used a certain amount of natural gas industrial customer data from a large state-owned oil and gas enterprise for application analysis and effectively divided customer value into three groups, demand-serving, demand-potential, and demand-incentive, according to their value characteristics and behavioral features. The results indicate that the framework proposed in this study can reasonably reflect and better characterize natural gas industrial customers’ value with different types of behavioral feature data, which can provide technical support for big data smart natural gas consumer marketing.
1 Introduction
Natural gas plays a significant role worldwide as well as in China, which can be used as a transitional energy source to mitigate climate change and reduce pollution, since it produces 50% less CO2 emissions than coal and 30% less emissions than oil (Howarth, 2014). Natural gas is usually used in different sectors, such as residential, industrial, and commercial, but the industrial customer accounts for the highest proportion (Farzaneh-Gord et al., 2012; Farzaneh-Gord et al., 2013; Farzaneh-Gord and Rahbari, 2018). In China, the use of natural gas is leading to an era full of opportunities and challenges under the background of globalization, accelerating energy transformation, complexity of the geopolitical environment, trial of energy security, and, especially, the balance between the downside pressure of dual-carbon goals and the need to maintain its economic development (Li, 2022). In early studies that focus on natural gas in China, domestic consumption was considered important by scholars. Later, it was proven that companies deserved more attention because they consumed much more natural gas than families (Nikolaidis et al., 2009). In the last few years, with the ownership unbundling of natural gas pipelines and storage facilities, the upstream gas suppliers have paid more attention to the downstream consumer market, and the competition among gas supply companies in the end-consumer market has become increasingly fierce; the market-oriented transaction mechanism will play an essential role for China to achieve a large-scale and efficient national allocation of new energy (Zhou et al., 2022). How to differentiate gas supply services to attract more customers according to customer characteristics has become a key concern to gas sellers. According to the China Natural Gas Development Report, in 2021, nearly 373 billion cubic meters of natural gas were consumed, that is, up to 12.7 percent year on year. In the natural gas consumption category, industrial fuels make up the bulk, which has become the core driving force of natural gas consumption growth, and industrial customers have become the main consumers. Therefore, accurately identifying the natural gas industrial customer demand characteristics and explicitly giving the industrial customer value portrait, which is of great significance to increase the comprehensive revenue of gas suppliers, enhance market competitiveness and optimize resource allocation.
With the continuous development of new technologies such as Internet and Big Data, customer classification technology, represented by customer profiling technology, has become a focus for companies in various fields to carry out differentiated marketing services. This study presents a data-mining approach to characterize the natural gas consumption behavior of industrial customers, which can visually demonstrate the characteristics of various customers' gas consumption behaviors and provide a basis for gas suppliers to differentiate their marketing services accordingly. Specifically, we summarize the current research status of the customer value-based profiling technology in the natural gas industrial sector and use big data modeling methods to build a value portrait of natural gas industrial customers. Our study could provide differentiated marketing strategy suggestions for gas sales operators based on the customer value profiling results.
Previous studies on customer value assessment are mainly divided into two categories. On the one hand, from a qualitative perspective, exploring the composition of multidimensional attributes of customer value and conducting comprehensive customer value assessment by constructing a customer demand characteristics index system, which is mainly applied to customer segmentation practice, is necessary. On the other hand, from the perspective of quantitative research, the use of mathematical methods to directly account for the currency value of customers, which is mainly used for customer value prediction, is also vital. The results predicted by those methods helped build a regional distributed energy system which could reduce emissions, reduce power consumption, and increase the safety and reliability of power grids (Hou et al., 2021). This study is centered on the construction of the value evaluation system for large industrial customers of natural gas and the classification of customer value based on customer portrait techniques. Due to the variety and diversity of data, it was hard to find out the relationships between daily phenomenon and data, but it was much easier with the help of clustering methods (Doğan, 2018). Clustering could be used to divide customer groups (Vieira et al., 2018), test habits (Garcia et al., 2017), and analyze user needs (Yang et al., 2015). CVIs (cluster validity indices) and PFCM (possibilistic fuzzy C-means algorithm) could be used to predict behaviors of the natural gas distribution network and nodal gas consumptions (Askari et al., 2015). Faced with complicated standards and needs, the PPFCI (projection pursuit fuzzy clustering model) technique was developed by combining the projection pursuit model with a fuzzy clustering iterative model (Wang and Yang, 2021). CFCM (causal fuzzy C-means) could effectively improve the scheduling accuracy and reduce the gas diffusion (Jin et al., 2018). A neuro fuzzy multivariate algorithm was developed to estimate accurate gas consumption with noisy inputs (Azadeh et al., 2013). By analyzing the data and consumer behaviors, the connection between them could be found (Beckel et al., 2014), and an accurate feature-based portrait classification could be made (Stephen et al., 2014). Dividing the samples into different groups helped distinguishing types of different features; thus, the behavioral features of different groups could be found and used to optimize resource allocation (Li, 2022). Prediction of the demand of resources by clustering can get suppliers better prepared (Rahim et al., 2019). Onur (2021) applied the intuitionistic fuzzy C-mean clustering algorithm (IFCM) to the natural gas industry to cluster and analyze consumption data of gas-using companies and develop a visual calendar diagram for corporate natural gas consumption behavior research. In addition to traditional clustering algorithms, data mining and machine learning algorithms in artificial intelligence have also been applied to customer segmentation by most scholars. Data mining could be helpful for gas consumption predictions (Palinski, 2018; Stuivenvolt-Allen and Wang, 2019). Then, the results of clustering and data mining could be used to make accurate customer portraits. Customer portraits distinguished the features of different customers and could be used to better optimize the resource allocation and response to demands (Guan et al., 2021; Chen et al., 2022). In order to effectively handle multidimensional attribute data of electric power customers and improve customer classification performance, an electric power customer classification method based on the symmetric uncertainty of feature subset generation and integrated learning was proposed to generate redundant and significant feature sets and to make customer classification decisions based on these significant feature sets (Piao et al., 2019). Dui et al. (2020) proposed an iterative decision tree (ITDT)-based customer classification method in the study of telecommunication service target customer classification, which extracts customer consumption features to effectively identify student and non-student customer groups by modeling and analyzing customer communication data provided by telecommunication operators. When faced with resource-consuming customer classifications, data mining worked well in transforming data into behavioral classifications (Cominola et al., 2019; Kang and Reiner, 2022) and could even reduce energy consumption by improving energy efficiency (Shan et al., 2022).
There are some studies on customer value assessment and customer segmentation in industrial fields such as the electric power industry; however, similar research studies on natural gas consumers are not abundant. Due to the exclusivity of electric power–customer relationships, electric power industrial customers have a single consumption choice, while natural gas customers have a variety of consumption choices due to its own commodity, which means the natural gas industry has a variety of accessible suppliers due to the storable nature of the commodity and the development of the LNG market, so there are fundamental differences in the customer value composition and customer segmentation between the two industries. In addition, the aforementioned studies rarely consider the inclusion of the customer industry-type attribute in the construction of a comprehensive customer value assessment system, and the difference in the demand behavior between customers in different industries directly affects the consumption behavior of customers and thus the accuracy of customer classification results. In addition, former studies do not take the influence of mixed data-type indicators of the clustering algorithm in implementing customer value segmentation techniques into consideration and cannot provide a similarity measure involving multiple data-type indicators.
To solve such problems by designing a model that works well in the aforementioned situations, this study developed a new framework of consumer classification and portrait evaluation, thus achieving the goal of accurately classifying industry consumers of natural gas in China by the following innovative aspects.
(1) We rediscover the value composition of natural gas industrial customers and establish a set of indicators to reflect the customer value in different dimensions with mixed data types.
(2) A visualizable customer value classification model has been established by combining Gower’s dissimilarity coefficient with the PAM clustering algorithm for better customer classification.
(3) A three-category natural gas industrial customer classification based on user value portrait was developed and was further put forward for the corresponding marketing suggestions.
Our study is closely related to the current natural gas market situation. To verify the applicability of the model, we used a certain amount of natural gas industrial customers’ behavioral feature data from a large state-owned oil and gas enterprise. The results indicate that the framework proposed in this study can reasonably reflect and better characterize the natural gas industrial customers’ value with different types of behavioral feature data, which can provide technical support for big data natural gas consumer smart marketing.
The remainder of this article is organized as follows. Section 2 elaborates on the construction of the customer value evaluation system and the customer value segmentation model for the natural gas industry. Section 3 presents the application of the model and the empirical analysis of the model using several natural gas industrial customers. Section 4 presents the value portrait and differentiated marketing services of different natural gas industrial customers, and Section 5 concludes the article.
2 Model construction
2.1 Customer value assessment model
2.1.1 Natural gas industrial customer value composition
The current customer value classifications among finance, logistics, retail, and other industrial parameters are basically based on the concept of customer lifetime value, which divides customer value into current value and potential value from the perspective of time and then is subdivided into four indicators of profit contribution, cost occupation, loyalty, and creditworthiness to characterize customer value. In terms of a natural gas industrial customer, the end-consumer markets are mainly characterized by competition among three large state-owned oil and gas companies, i.e., CNPC, SINOPEC, and CNOOC. With the advent of perfectly competitive LNG resources, some large-scale industrial customers have a variety of gas purchase options. Therefore, stability and loyalty have now become important indicators in assessing the value of natural gas industrial customers. Moreover, with the continuous attention of the society to corporate social responsibility, the reputation and social responsibility will also affect customer value. Although customer value is reflected in all aspects, in this article, we refer to other studies on the value assessment of China’s power industry customers, combined with the actual situation of the natural gas industry; the value of large industrial customers of natural gas is described in Figure 1.
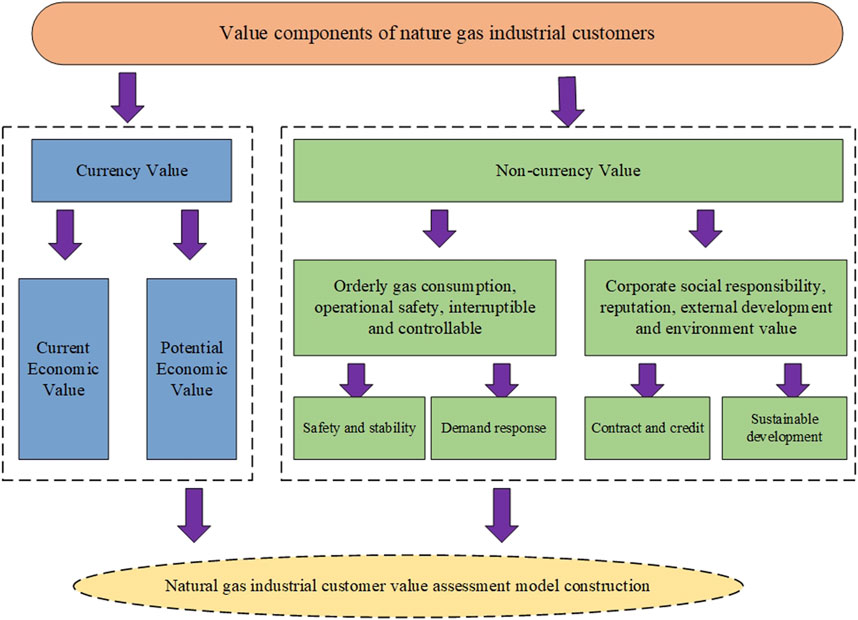
FIGURE 1. Value composition of natural gas industrial customers.
As shown in Figure 1, the value of a natural gas industrial customer consists of two aspects: currency value and non-currency value. In terms of currency value, it consists of the current economic value and potential economic value, which represent the scale and growth rate, mainly characterizing the direct economic benefits brought to gas supply enterprises by customers' current and future gas consumption behavior during the statistical period, i.e., the currency value of customers. In terms of non-currency value, we call it the orderly gas consumption value and social responsibility value. In the case of orderly gas consumption value, it consists of safety and stability value, and the demand response value, i.e., the safety and stability for an industrial customer of natural gas and the degree of customers' enthusiasm to participate in the regional gas peaking plan of gas supply enterprises and their contribution to demand response. As for the social responsibility value, it contains the contract and credit value, and the sustainable development value. The contract and credit value represents the degree of compliance and customer loyalty value of gas customers in signing transaction contracts with gas supply enterprises, while the sustainable development value is assessed from the perspective of the external environment of the gas-using enterprise and the social responsibility undertaken by the enterprise and is mainly divided into the value of energy-saving contribution and the value of sustainable development potential.
2.1.2 Indicators of customer value assessment
In order to ensure the scientific accuracy and operability of customer value segmentation modeling, quantifiable segmentation variables need to be selected to measure and evaluate the two aspects of the value composition of large natural gas industrial customers. The selection of segmentation variables is based on the principles of independence, scientificity, measurability, typicality, and comprehensiveness, to ensure the operability of the segmentation process and the accuracy of the results. By using the literature induction method and combining the existing data of relevant gas supply enterprises, this article selects the segmentation variable indicators of each value dimension and constructs a gas customer value assessment index model, as shown in Figure 2, and the meanings and data types of each sub-indicators are shown in Table 1.
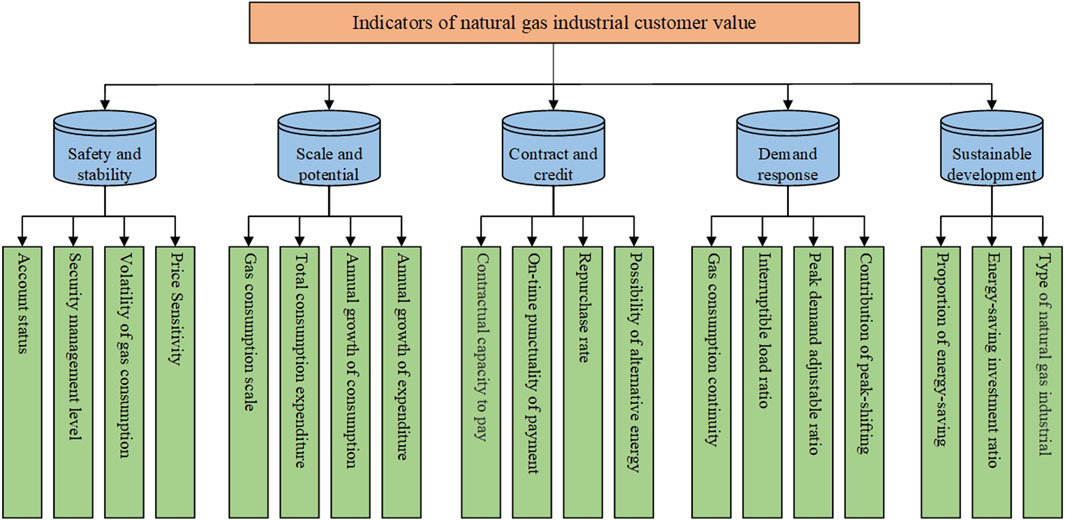
FIGURE 2. Evaluation system of natural gas industrial customer value.
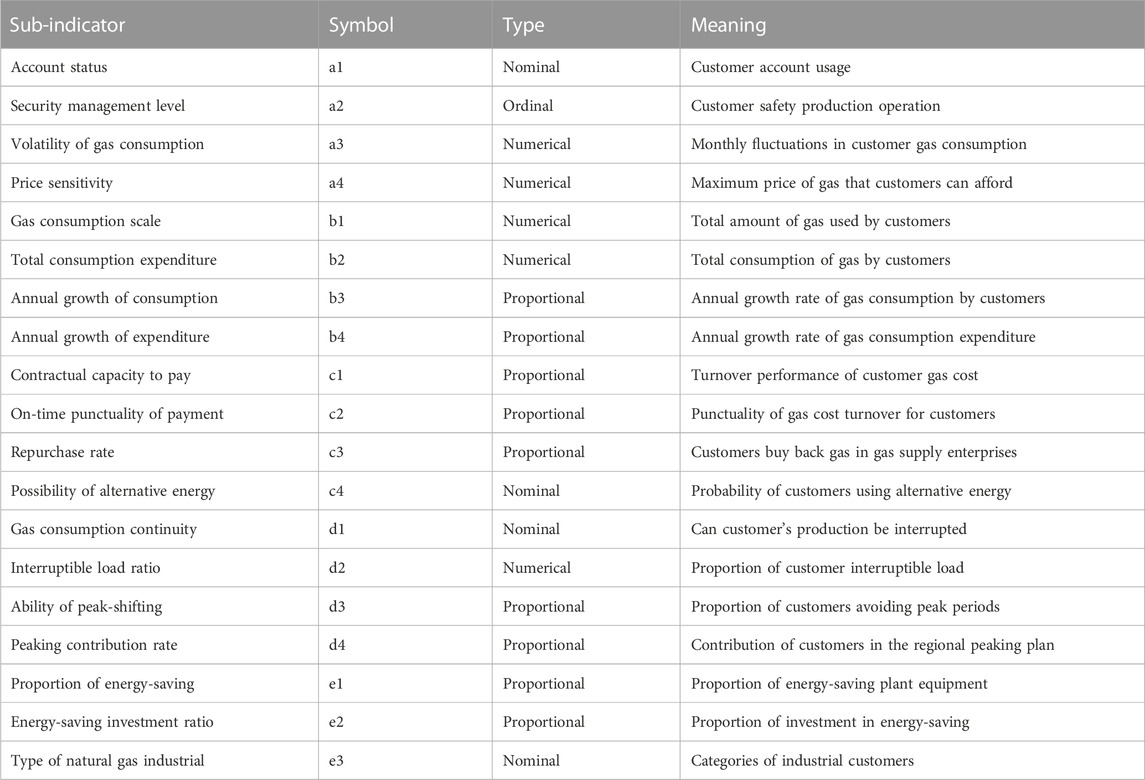
TABLE 1. Meaning of sub-indicators.
2.1.3 Processing of assessment indicators
In order to reduce the impact of autocorrelation between redundant segmentation indicator variables on the final value assessment results of large industrial customers of natural gas, the aforementioned indicator system needs to be further revised and streamlined before conducting data analysis and modeling.
2.1.3.1 Remove the invalid indicators
The missing value ratio method assumes that when a data column contains some missing values, it is less likely to contain useful information. Therefore, in order to ensure the usefulness of the information contained in the segmentation variable indicators in the index system, data columns with missing values greater than a certain threshold can be eliminated. In this study, if there are too many missing values in the sub-indicators, it signifies that the indicators lack the support of actual business data and violate the principle of measurability and operability of indicator selection and should be eliminated.
2.1.3.2 Eliminate indicators with low discrimination
The low variance filtering method assumes that if the values of a column in the dataset are essentially the same, i.e., its variance is very low, the low variance data column carries very little useful information and cannot satisfy the basic condition that there is a clear distinction between different objects in the values of the indicator. In practice, the indicator of sample variance is used to measure each segmentation variable indicator, and the calculation method is shown in Eq. 1.
where
2.1.3.3 Eliminate indicators with high correlation
High correlation filtering considers that if two indicator variables are highly correlated with each other, they have similar trends and may carry similar information. Such variables can lead to a reduction in the performance of the classification model, so the correlation between independent numerical variables can be calculated, and when the correlation coefficient exceeds a certain threshold, the indicator variable with high correlation with the target variable is usually chosen to be retained, and the other indicator is excluded to achieve the indicator simplification goal. In this article, Pearson’s correlation coefficient is used to measure the correlation between indicator variables, which is calculated as shown in Eq. 2.
where
2.2 Customer value classification model
The customer value classification model mainly uses the clustering algorithm to rate the value of natural gas industrial customers. Because of the proposed indicators contain multiple data types in the customer value assessment model, a visualizable customer value classification model has been established by combining Gower’s dissimilarity coefficient with the PAM clustering algorithm.
2.2.1 Dissimilarity of indicators
Measuring the similarity or dissimilarity among data objects is the basic work of cluster modeling analysis, and the segmentation index variables selected in this study contain a variety of mixed types of data, such as numerical, nominal, and proportional data, so the traditional methods of measuring dissimilarity of data objects cannot be well-applied (Gower, 1971). In this article, we propose to use the
Gower’s dissimilarity coefficient assumes that the dataset contains
where
2.2.2 Optimal number of clustering
Cluster analysis is an unsupervised learning tool, and most clustering algorithms generally require a pre-determined number of clusters; different numbers of clusters are passed to the algorithm and the final output results will vary, so how to determine the optimal number of clusters becomes an urgent problem to be solved before conducting cluster analysis in this study. Tibshirani et al. (2001) proposed the
A sample dataset containing
Eq. 5 defines an in-group offset
The interval statistic
where
The basic idea of the interval statistics method is to compare the expected value of the reference dataset with the observed dataset so that the value of
In actual practice, determining the optimal number of clusters is also carried out by the
2.2.3 PAM clustering algorithm
The main purpose of building a customer classification model based on customer value is to classify and rate the value of large industrial customers of natural gas by choosing a suitable clustering algorithm. The K-means clustering algorithm has the advantage of being simple and fast and is widely used in the field of clustering analysis. However, this algorithm is sensitive to outliers in the sample because it is based on the sample mean, and extreme customer sample points can affect the accuracy of this algorithm in the actual customer segmentation practice. Thus, an improved K-means algorithm, the partitioning around medoids (PAM), has been created and applied in clustering. In the PAM clustering algorithm, we can select the actual observations in the sample as the cluster centers and optimize the new cluster centers by calculating the minimum value of clustering from each point in the class cluster to all other points except the cluster center when modifying the cluster centers. Based on this feature, the PAM makes up for the shortcomings of the K-means which is sensitive to sample noise and isolated points and makes the clustering model more robust. The customer sample information in this study is a mixed data-type attribute, and the PAM clustering algorithm can combine the
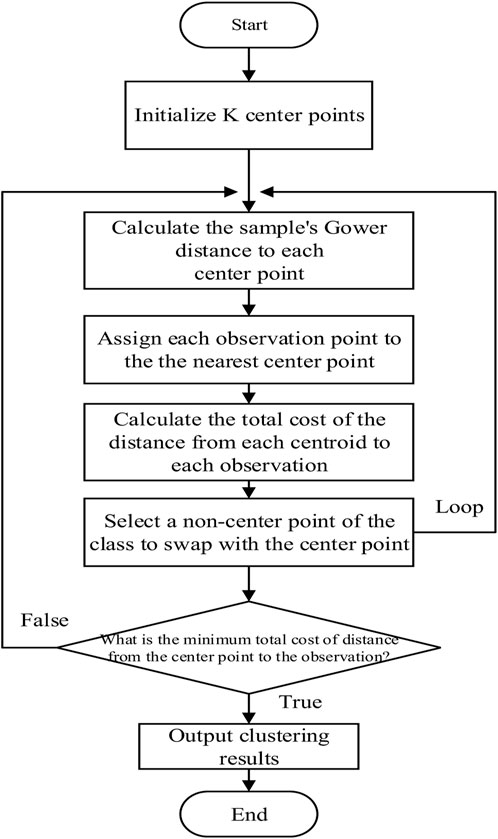
FIGURE 3. Flow chart of the PAM clustering algorithm.
2.2.4 Clustering result examination
In order to test the cluster result of the classification model, this study used Rousseeuw’s contour coefficient (
The range of the contour coefficient is [−1, 1] and when the contour coefficient is close to 1,this indicates that the sample
2.3 Customer value portrait procedure
Based on the natural gas industrial customer value assessment and classification model, we give the specific process of the natural gas industrial customer value portrait, as shown in Figure 4.
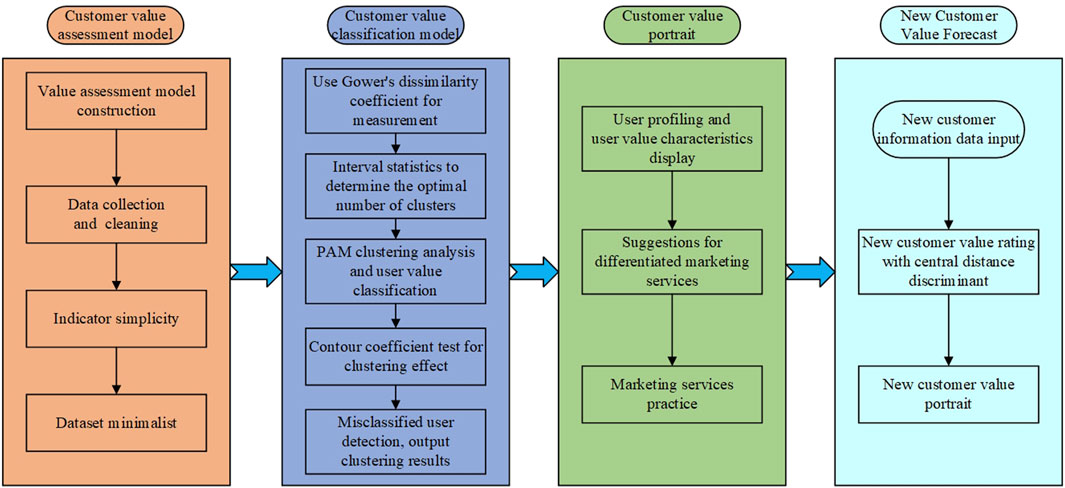
FIGURE 4. Process of the natural gas industrial customer value portrait.
Our natural gas industrial customer value portrait includes the value categories of a customer and the value dimension depiction of five aspects. According to the customer value portrait, an optimal marketing plan can be formulated to achieve the purpose of precision marketing. Moreover, when a new industrial customer appears in the market, we can easily get the value portrait of the new customer by inputting the relevant data of the new customer and making comparative analysis with existing industrial customers in our established model framework and then making corresponding marketing plans to establish a better customer relation.
3 Practical application analysis
In order to verify the practicability of the model, this study collected a certain amount of data on natural gas industrial customers from a large state-owned oil and gas enterprise. The model is implemented using R language version 4.1.2 and programmed on the RStudio platform.
3.1 Data collection
Based on the established natural gas industrial customer value assessment model, we collected 19 indicators of each customer. Considering the availability of data, this study has collected 76 natural gas industrial customers’ value characteristic data from a large state-owned oil and gas enterprise.
Based on the customer value assessment model, the derived data were sorted, and the indexes were simplified by applying the missing value ratio method, low variance filtering, and high correlation filtering in turn. After data cleaning, 21 samples with more missing values of indicators (missing ratio >80%) and a total of 55 large natural gas industrial customers were selected for analysis finally. Additionally, according to the processing of assessment indicators, the high missing rate of indicators
3.2 Clustering analysis
Based on the selected natural gas industrial customers, we further performed the clustering analysis. First, for the approximate dataset, the distance between samples is calculated according to Eq. 3 to complete the measure of mixed-attribute dissimilarity in the sample objects. Then, the interval statistics of the approximately parsimonious dataset were calculated by applying Eqs 4–6 in turn, and the
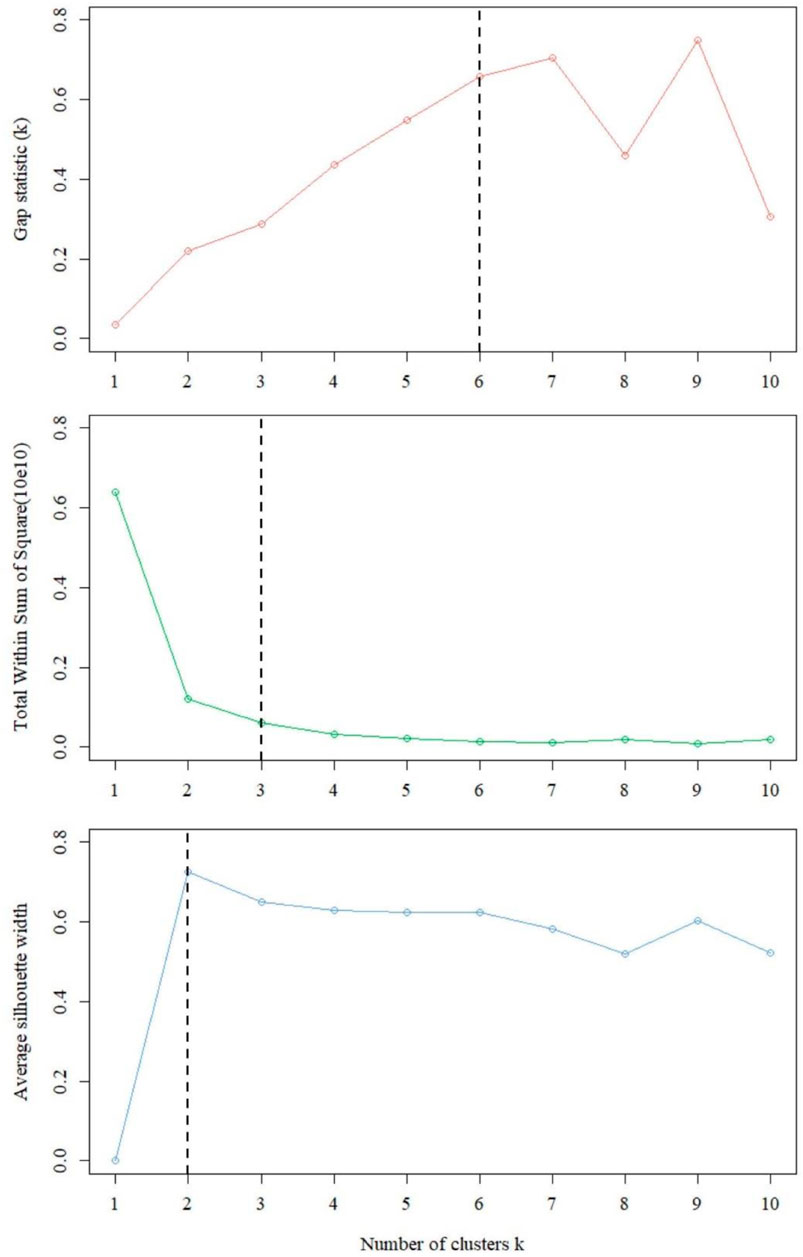
FIGURE 5. Optimal number of clusters in different methods.
As shown in Figure 5, when
The determined optimal number of clusters
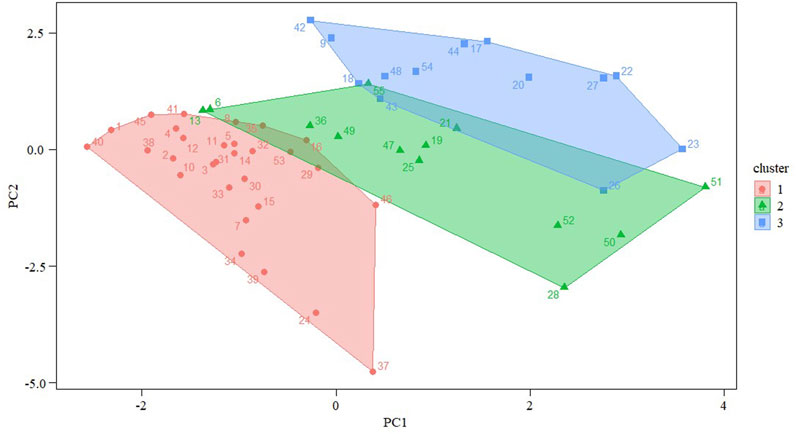
FIGURE 6. PAM clustering effect.
The PAM clustering effect was tested by applying Eq. 7 to calculate the contour coefficients of each cluster, and the contour coefficients of each cluster are plotted in Figure 7.
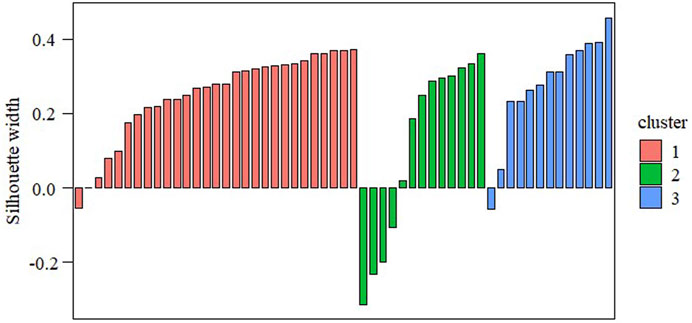
FIGURE 7. PAM clustering contour coefficient.
As shown in Figure 7, after PAM cluster analysis, the sample points with customer IDs 451, 126, and 79 were used as cluster centroids to classify large industrial customers of natural gas into three categories based on value assessment indicators, with the first category containing 29 customer samples, the second category containing 13 customer samples, and the third category containing 13 customer samples. From an overall perspective, the average contour coefficient of each cluster of clustering results reaches 0.22. Specifically, the average contour coefficient of the first category is 0.25, that of the second category is 0.12, and that of the third category is 0.28. The overall clustering effect is less satisfactory, indicating that some samples have incorrect clustering results. When the misclassified samples are found, we put those whose values are more ambiguous in the closest classification, while those that are close to the boundary point are classified into the glass industry. In terms of individual samples, there are samples with negative contour coefficients in all three clusters, as shown in Figure 7. By accurately identifying the misclassified samples with negative contour coefficients for re-clustering and classifying the customer value ratings, the classification of customer value is achieved.
4 Portrait results and discussion
4.1 Portrait result analysis
According to the customer value portrait modeling analysis, the natural gas industrial customer groups contained information of six types, i.e., glass, steel, ammonia, methanol, aluminum, and ceramics. The value level and typical characteristics of natural gas industrial customers’ value portrait are summarized in Table 2.
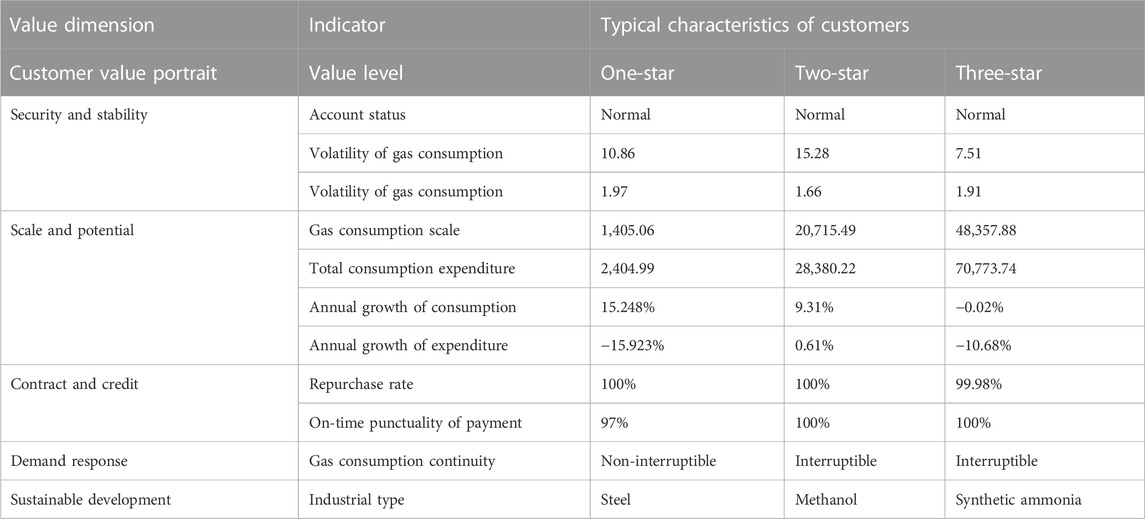
TABLE 2. Typical characteristics of different customers’ value.
Based on the modeling results, the customers’ value is rated into three levels. First, one-star customers are demand-motivated customers. Second, two-star customers are demand-potential customers. Third, three-star customers are demand-service customers. The number and percentage of different natural gas industrial customer value levels are shown in Figures 8–11.
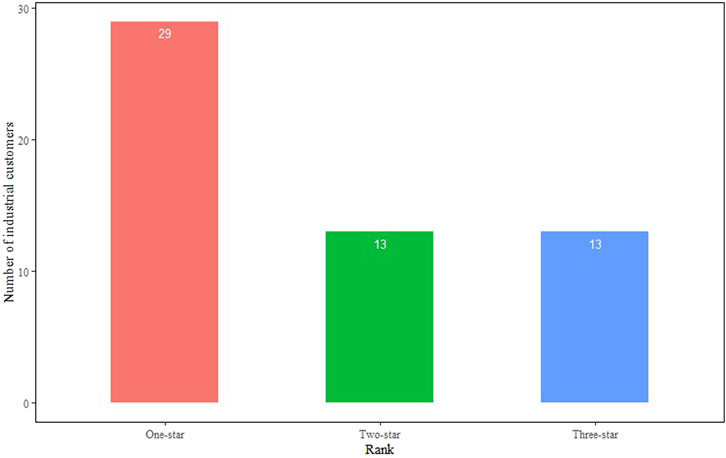
FIGURE 8. Number of natural gas customers by the value level.
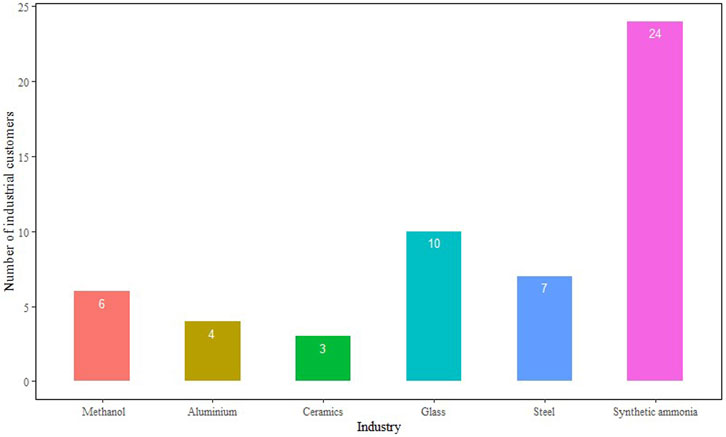
FIGURE 9. Number of natural gas customers by industrial categories.
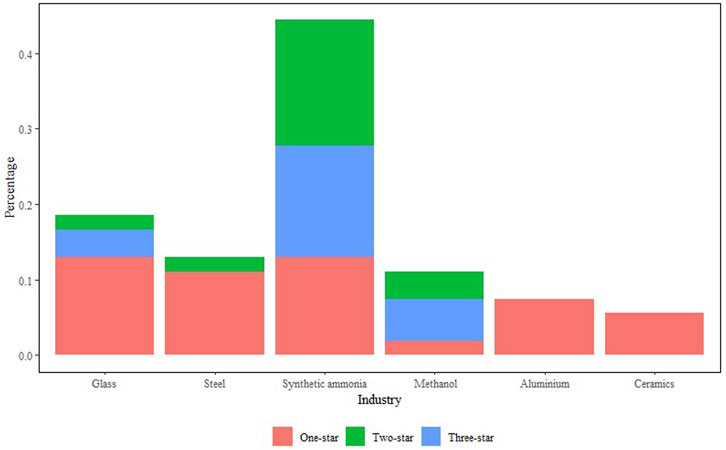
FIGURE 10. Percentage of natural gas customers by the value level and categories.

FIGURE 11. Radar chart of natural gas customer value distribution.
4.2 Suggestions for marketing
By modeling and profiling the value of large industrial customers of natural gas, combined with specific marketing practices, the following differentiated marketing services are proposed for the three types of demand-based customers.
First, the one-star customers are demand-motivated customers. One-star customers are characterized by a small gas demand and a large number of customer groups, and the marketing service priority of these customers is the lowest. Gas suppliers should actively establish a customer gas incentive system while maintaining basic services in their marketing services and can explore the gas demand of these customers in specific ways such as a gas point system to stimulate the gas demand of these customers.
Second, the two-star customers are demand-potential customers. The main difference between two-star customers and three-star customers is that the volatility of gas consumption varies widely among these customers, followed by high price sensitivity, lower maximum affordable gas prices, and medium priority for marketing services. Therefore, it is recommended that gas suppliers should grasp the seasonal fluctuations of customers’ gas consumption in addition to normal marketing services and increase gas supply services during the peak season to explore the gas demand potential of this group. At the same time, since most of the customers in this group are interruptible gas customers, they can be encouraged and guided to actively participate in the demand response programs of gas supply companies so as to bring into play the value of peaking and make this group of customers a potential customer group for future cooperation with gas supply companies.
Third, the three-star customers are demand-service customers. According to the value characteristics of three-star customers, they are the most valuable customers of gas suppliers and have the highest priority in marketing services. Gas suppliers can establish individual customer demand management systems for these customers, set up special marketing staff to provide specialist services, open green service channels, carry out regular gas delivery and maintenance services, consolidate and enhance service satisfaction and loyalty of large gas customers to gas suppliers through VIP personalized services, and increase customer viscosity.
5 Discussion and conclusion
Customers are important assets of an enterprise, to some extent. Using big data modeling to explore the consumption characteristics of industrial customers and to conduct customer value profiling is helpful in identifying customers with value to the enterprise and in providing technical assurance to achieve the dual goals of maximizing enterprise profits and maximizing customer benefits. In this article, we take large industrial customers of natural gas as the research object, summarize the experience of value profiling of industrial customers in the electric power industry and other industries, construct a customer value assessment model and a customer value classification model in two steps, and conduct empirical analysis with actual consumption data of large industrial customers of natural gas. The findings of our research show that natural gas industrial customers can be divided into three groups: one-star, two-star, and three-star customers. The more stars a user has, the higher the performance. Although the number of three-star customers is not significant, they do deserve best service, and long-term trade with them is usually steady and profitable. Paying attention to two-star customers is a good choice as well because they have big potential. We also suggest that efforts on one-star customers should be limited.
The empirical results show that the model constructed in this article can achieve a reasonable rating and classification of customer value, and the customer portrait depicted based on the value characteristics of customer groups can accurately identify valuable industrial customers for gas supply enterprises. Based on the customer results combined with specific marketing practices, this article proposes differentiated marketing services for gas supply enterprises for various types of customers of different value groups, which is important for gas supply enterprises to improve market competitiveness, increase economic benefits, and improve customer relationships. However, there is still room for further development and improvement in the construction of the customer value assessment model and the customer portrait display. Subsequent research can focus on improvement and optimization of customer value segmentation techniques and big data platform-based customer value portrait display systems to better serve the specific marketing practice of gas supply enterprises.
This article realizes the value portrait of large industrial customers of natural gas by constructing a customer value assessment system and a customer value classification model in two steps; however, there are still some aspects of the research that need to be discussed and studied further. First, more corresponding customer business data to support the four levels of value indexes involving orderly gas consumption and sustainable development are needed to stress the importance of these indicators. In follow-up studies, researchers can further improve the customer value evaluation index system and reasonably balance the integrity and accessibility of data indicators to ensure the scientific nature of customer value evaluation. Second, the weights of each indicator can be unequally treated because they have different effects. Also, subsequent research can adopt intelligent algorithms for indicator appointment to improve the model performance. Third, in consideration of the expansion of the customer scale, the stability and credibility of our framework should be further tested. We hold the opinion that our framework can work well under different situations like a bigger market with more customer information. Hopefully, a more detailed and concrete framework that can better assess customer value can be built with the support of bigger data. Finally, we can also consider trying fuzzy clustering, hierarchical clustering, and other clustering algorithms or data mining class algorithms for technical improvement as clustering methods or robust test methods in order to improve the credibility of the customer value hierarchical classification model.
Data availability statement
The original contributions presented in the study are included in the article/supplementary material, further inquiries can be directed to the corresponding author.
Author contributions
All authors listed have made a substantial, direct, and intellectual contribution to the work and approved it for publication.
Funding
This research is funded by the National Natural Science Foundation of China under Grant Nos. 71804167, 72174188.
Conflict of interest
Author KP was employed by China National Petroleum Corporation.
The remaining authors declare that the research was conducted in the absence of any commercial or financial relationships that could be construed as a potential conflict of interest.
Publisher’s note
All claims expressed in this article are solely those of the authors and do not necessarily represent those of their affiliated organizations, or those of the publisher, the editors, and the reviewers. Any product that may be evaluated in this article, or claim that may be made by its manufacturer, is not guaranteed or endorsed by the publisher.
References
Askari, S., Montazerin, N., and Zarandi, M. H. F. (2015). Forecasting semi-dynamic response of natural gas networks to nodal gas consumptions using genetic fuzzy systems. Energy 83, 252–266. doi:10.1016/j.energy.2015.02.020
Azadeh, A., Saberi, M., Asadzadeh, S. M., Hussain, O. K., and Saberi, Z. (2013). A neuro-fuzzy-multivariate algorithm for accurate gas consumption estimation in South America with noisy inputs. Int. J. Electr. Power and Energy Syst. 46, 315–325. doi:10.1016/j.ijepes.2012.10.013
Beckel, C., Sadamori, L., Staake, T., and Santini, S. (2014). Revealing household characteristics from smart meter data. Energy 78, 397–410. doi:10.1016/j.energy.2014.10.025
Chen, S. C., Gan, L., Chen, C. Y., Yu, K., Pi, H. M., Qian, Z. A., et al. (2022). Demand-response oriented multi-dimension refined portrait of adjustable resources based on load and survey data fusion. Front. Energy Res. 10, 968368. doi:10.3389/fenrg.2022.968368
Cominola, A., Nguyen, K., Giuliani, M., Stewart, R. A., Maier, H. R., and Castelletti, A. (2019). Data mining to uncover heterogeneous water use behaviors from smart meter data. Water Resour. Res. 55, 9315–9333. doi:10.1029/2019wr024897
Doğan, O. (2018). “Heuristic approaches in clustering problems,” in Handbook of research on applied optimization methodologies in manufacturing systems. Editors Ö. Faruk Yılmaz, and S. Tüfekçí (Hershey, PA, USA: IGI Global), 107–124.
Dui, P., Huang, D. S., Liu, Z. X., Zhang, H. Y., Zhang, J. G., and Yan, Q. J. (2020). “Power customer classification based on OCHNN-Kmeans and price setting of TOU,” in 5th Asia Conference on Power and Electrical Engineering (ACPEE), Chengdu, P R CHINA, 252–256.
Farzaneh-Gord, M., Deymi-Dashtebayaz, M., Rahbari, H. R., and Niazmand, H. (2012). Effects of storage types and conditions on compressed hydrogen fuelling stations performance. Int. J. Hydrogen Energy 37, 3500–3509. doi:10.1016/j.ijhydene.2011.11.017
Farzaneh-Gord, M., Rahbari, H. R., and Nikofard, H. (2013). The effect of important parameters on the natural gas vehicles driving range. Pol. J. Chem. Technol. 14, 61–68. doi:10.2478/v10026-012-0104-3
Farzaneh-Gord, M., and Rahbari, H. R. (2018). Response of natural gas distribution pipeline networks to ambient temperature variation (unsteady simulation). J. Nat. Gas Sci. Eng. 52, 94–105. doi:10.1016/j.jngse.2018.01.024
Garcia, D., Puig, V., Quevedo, J., and Cugueró, M. A. (2017). “Big data analytics and knowledge discovery applied to automatic meter readers,” in Real-time monitoring and operational control of drinking-water systems. Editors V. Puig, C. Ocampo-Martínez, R. Pérez, G. Cembrano, J. Quevedo, and T. Escobet (Cham: Springer International Publishing), 401–423.
Gower, J. C. (1971). A genera coefficien of similarity and some of its properties. Biometrics 24 (24), 623–637.
Guan, W. L., Zhang, D. L., Yu, H., Peng, B. G., Wu, Y. F., Yu, T., et al. (2021). Customer load forecasting method based on the industry electricity consumption behavior portrait. Front. Energy Res. 9, 742993. doi:10.3389/fenrg.2021.742993
Hou, J. M., Wang, J. J., Ji, C. Y., and Zhou, N. (2021). A review of regional distributed energy system planning and design. Int. J. Embed. Syst. 14, 89–100. doi:10.1504/ijes.2021.10033849
Howarth, R. W. (2014). A bridge to nowhere: Methane emissions and the greenhouse gas footprint of natural gas. Energy Sci. Eng. 2, 47–60. doi:10.1002/ese3.35
Jin, F., Zhao, J., Sheng, C. Y., and Wang, W. (2018). Causality diagram-based scheduling approach for blast furnace gas system. Ieee-Caa J. Automatica Sinica 5, 587–594. doi:10.1109/jas.2017.7510715
Kang, J., and Reiner, D. M. (2022). Off seasons, holidays and extreme weather events: Using data-mining techniques on smart meter and energy consumption data from China. Energy Res. Soc. Sci. 89, 102637. doi:10.1016/j.erss.2022.102637
Li, L. (2022). Development of natural gas industry in China: Review and prospect. Nat. Gas. Ind. B 9, 187–196. doi:10.1016/j.ngib.2022.03.001
Nikolaidis, Y., Pilavachi, P. A., and Chletsis, A. (2009). Economic evaluation of energy saving measures in a common type of Greek building. Appl. Energy 86, 2550–2559. doi:10.1016/j.apenergy.2009.04.029
Onur, D. (2021). Natural gas consumption behavior of companies by clustering analysis. Eng. Appl. Artif. Intell. 106, 104502. doi:10.1016/j.engappai.2021.104502
Palinski, A. (2018). Hurtownie danych i eksploracja danych w prognozowaniu popytu na gaz i usługi magazynowania gazu. Nafta-Gaz 74, 283–289. doi:10.18668/ng.2018.04.04
Piao, M., Piao, Y. J., and Lee, J. Y. (2019). Symmetrical uncertainty-based feature subset generation and ensemble learning for electricity customer classification. Symmetry-Basel 11, 498. doi:10.3390/sym11040498
Rahim, M. S., Nguyen, K., Stewart, R., Giurco, D., and Blumenstein, M. (2019). “Predicting household water consumption events: Towards a personalised recommender system to encourage water-conscious behaviour,” in 2019 International Joint Conference on Neural Networks (IJCNN), Budapest, Hungary, 14-19 July 2019.
Rousseeuw, P. J. (1987). Silhouettes: A graphical aid to the interpretation and validation of cluster analysis. J. Comput. Appl. Math. 20, 53–65. doi:10.1016/0377-0427(87)90125-7
Shan, X., Deng, Q., Tang, Z., Wu, Z., and Wang, W. (2022). An integrated data mining-based approach to identify key building and urban features of different energy usage levels. Sustain. Cities Soc. 77, 103576. doi:10.1016/j.scs.2021.103576
Stephen, B., Mutanen, A., Galloway, S., Burt, G. M., and Järventausta, P. (2014). Enhanced load profiling for residential network customers. IEEE Trans.29, 88–96. doi:10.1109/tpwrd.2013.2287032
Stuivenvolt-Allen, J., and Wang, S. S. Y. (2019). Data mining climate variability as an indicator of US natural gas. Front. Big Data 2, 00020. doi:10.3389/fdata.2019.00020
Tibshirani, R., Walther, G., and Hastie, T. (2001). Estimating the number of clusters in a data set via the gap statistic. J. R. Stat. Soc. Ser. B-Statistical Methodol. 63, 411–423. doi:10.1111/1467-9868.00293
Vieira, P., Jorge, C., and Covas, D. (2018). Efficiency assessment of household water use. Urban Water J. 15, 407–417. doi:10.1080/1573062x.2018.1508596
Wang, Q., and Yang, X. (2021). Evaluating the potential for sustainable development of China's shale gas industry by combining multi-level DPSIR framework, PPFCI technique and Raga algorithm. Sci. Total Environ. 780, 146525. doi:10.1016/j.scitotenv.2021.146525
Yang, J., Li, Y., Zhang, N., Yang, J., Kuang, K., Hu, Y., et al. (2015). “Analysis of urban residential water consumption based on smart meters and fuzzy clustering,” in 2015 IEEE International Conference on Computer and Information Technology; Ubiquitous Computing and Communications; Dependable, Autonomic and Secure Computing; Pervasive Intelligence and Computing, Liverpool, UK, 26-28 October 2015.
Keywords: natural gas industrial, customer value portrait, value assessment framework, PAM clustering, smart marketing
Citation: Liu S, Gong C and Pan K (2023) A combinatorial model for natural gas industrial customer value portrait based on value assessment and clustering algorithm. Front. Energy Res. 11:1077266. doi: 10.3389/fenrg.2023.1077266
Received: 22 October 2022; Accepted: 13 February 2023;
Published: 23 March 2023.
Edited by:
Yongming Han, Beijing University of Chemical Technology, ChinaReviewed by:
Yumin Zhang, Shandong University of Science and Technology, ChinaHamid Reza Rahbari, Aalborg University, Denmark
Copyright © 2023 Liu, Gong and Pan. This is an open-access article distributed under the terms of the Creative Commons Attribution License (CC BY). The use, distribution or reproduction in other forums is permitted, provided the original author(s) and the copyright owner(s) are credited and that the original publication in this journal is cited, in accordance with accepted academic practice. No use, distribution or reproduction is permitted which does not comply with these terms.
*Correspondence: Chengzhu Gong, Y2hlbmd6aHUuZ29uZ0BjdWcuZWR1LmNu