
95% of researchers rate our articles as excellent or good
Learn more about the work of our research integrity team to safeguard the quality of each article we publish.
Find out more
REVIEW article
Front. Energy Res. , 20 February 2023
Sec. Advanced Clean Fuel Technologies
Volume 11 - 2023 | https://doi.org/10.3389/fenrg.2023.1075384
This article is part of the Research Topic Advances in Process Modeling and Optimization of Clean Energy Processes View all 7 articles
Floating solar photovoltaic (FSPV) systems that allow solar panel installations on water bodies are gaining popularity worldwide as they mainly avoid land-use conflicts created by, and for their superior performance over, ground-mounted photovoltaic installations. Though many studies in the FSPV literature showed how superior FSPVs perform, we still believe there are few potential opportunities for further enhancement in performance. On the other side, the industry’s delivery of FSPV installation service to clients is often questioned, highlighting that FSPV modeling is compromised, leading to false promises on energy performance and feasibility. This might be true given the lack of modeling tools specific to FSPV. With this hypothesis, this review investigates existing modeling approaches by FSPV researchers/industry people practicing and potentially implementable energy performance enhancement strategies leading to the advancement of modeling tools. The review outcome suggested that every FSPV researcher/service provider must carefully design and optimize the FSPV system considering suitable performance enhancement strategies, for instance, replacing conventional solar panels with bifacial ones and integrating various cooling and cleaning methods. Also, while assessing the feasibility, they must follow the lifecycle-based performance indicators that broadly fall under the techno-economic-environmental and social aspects with an appropriate framework-driven assessment approach. Lastly, we have shown a conceptual FSPV project simulation tool consolidating the performance indicators and explored performance enhancement strategies that we believe would help the FSPV community.
Floating solar photovoltaics (FSPV) is an emerging installation approach in the solar photovoltaics (PV) power sector that maximizes power output when compared to its counterpart ground-mounted photovoltaics (GMPV) (Ram et al., 2018). FSPVs are generally installed on water bodies such as oceans, rivers, lakes, reservoirs, wastewater treatment, fish ponds, and others (Kumar et al., 2020a). The primary push for FSPV installation has become a reality as they provide benefits, such include land use conflict mitigation and the shading effects of PV panels lessening the rate of water evaporation (Connolly et al., 2010; Akella et al., 2009; IRENA, 2020). Due to the cooling effect caused by water, FSPVs overcome the thermal losses leading to better performance. An experimental report claims that FSPV can enhance efficiency to 11% more than GMPV (Sahin et al., 2020). On the other side, global solar policies were also in consideration for FSPV (Solangi et al., 2011). This installation approach was already influential in countries like India, Singapore, Japan, Korea, and others; additionally, it can be effective in countries that do not have enough land to install large PV plants (Deo and Tiwari, 2014; Gotmare and Prayagi, 2014; Sahu et al., 2016; Charles Lawrence Kamuyu et al., 2018). The FSPV system generally consists of several components such include pontoons, floats, mooring systems, solar PV modules, connectors, cables, power converters, and power transmission systems (Choi, 2014; Dash and Gupta, 2015). A schematic representation of a typical FSPV system is illustrated in Figure 1A. Depending upon the PV module installation approach, FSPVs can be fixed and tracking (1 or 2-axis tracking) (Choi et al., 2016; Bjørneklett, 2018); additionally, there exist few other classifications based on different components of FSPV such as floating platforms, anchoring and mooring, and electrical configuration, see Figure 1B.
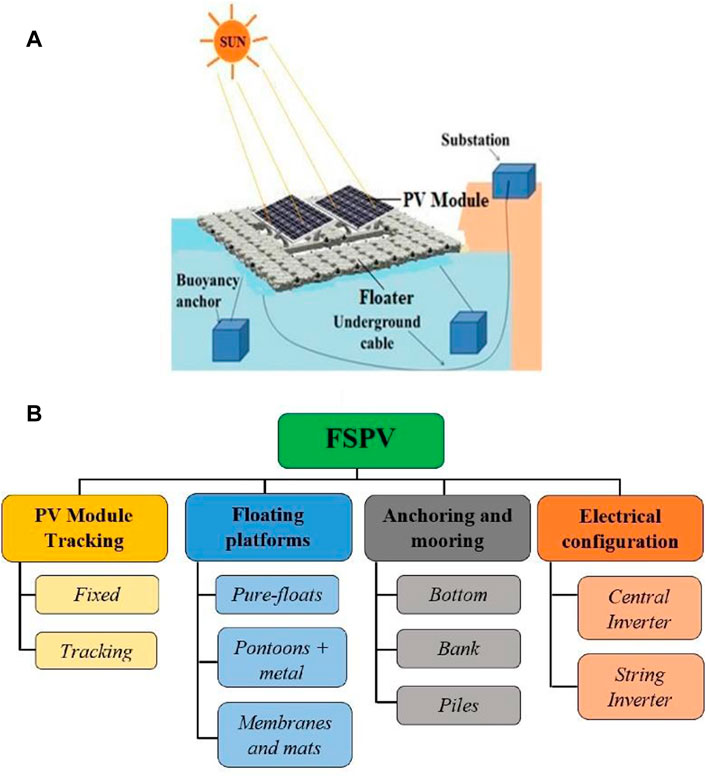
FIGURE 1. (A) A schematic representation of a typical floating solar photovoltaic system with its essential components; (B) Floating solar photovoltaic system classification based on the components. Reprinted with permission from the first author’s own source in ref (Kumar et al., 2022).
Several studies have been conducted on FSPV to analyze performance feasibility. A 10 MW FSPV project was implemented in ref (Goswami et al., 2019) that considered the technical and economic parameters to perform the feasibility analysis. The outcome showed that the FSPV system could generate 10.2% more power than land-based PV plants. As a result, the levelized tariff cost of FSPV is reduced to 39% than other types of PV plants. A combined operation of the 2 GW FSPV plant and a 1 GW pumped storage power (PSP) system is proposed in ref (Liu et al., 2019) to achieve maximum power efficiency and minimum power imbalances. The experiment includes the genetic algorithm to analyze the operation. The outcomes illustrate the improved power output as 9112.74 MW and the reduced energy imbalance as 23.06 MW. The FSPV implementation is demonstrated in ref (Oliveira-Pinto and Stokkermans, 2020), which aims to relate the technical and economic feasibility using simulation models. Results from (Oliveira-Pinto and Stokkermans, 2020) show a 1.81%–2.59% increase in power output and significantly reduced costs. A solar tracking-type FSPV system is demonstrated in (Xu et al., 2019) that adjusts the panel to the accurate positions using the mechanical approach to absorb maximum solar energy. The system minimized system costs as it does not require motors to adjust panel angles. A 3 MW FSPV system simulation implementation is proposed in (Perera and Wen, 2020) that analyzes the system’s technical, economic, and environmental feasibility; additionally, they also simulated the combined hydropower with FSPV making the cumulative capacity 15 MW. Techno-economic analysis of an FSPV plant and a wind farm is carried out in (Golroodbari et al., 2021), incorporating cable pooling to enhance solar capability. The research proves that the combined operation lessens cost with improved efficiency. They also worked on solar and wind resources’ effects on power generation. Techno-economic analysis of 1 MW FSPV plants in Korea is proposed in (Song and Choi, 2016), including a fish-eye lens and digital elevation model for shading analysis. The weather data and system operation is evaluated in the system advisor model (SAM). The simulation outcomes show that the annual power generation is 971.57 MW, and the net present value is $897,000 in 12.3 years. A combined integration of hydroelectric power and the FSPV plant is implemented in (Rauf et al., 2020), which incorporates an optimization model to maximize power output and reach peak demand. The MATLAB platform evaluates the optimization model to analyze the technical feasibility. The results claim an additional 3.5% power output for the combined operation. The study continues a technical analysis of power output and does not provide any economic or environmental views. Another combined hydroelectric power and FSPV plant operation are demonstrated in (Farfan and Breyer, 2018), aiming to reach peak demand during irradiation hours. The FSPV plant prevents the water evaporation of the reservoir from facilitating the hydropower operation. The study directs some restrictions of FSPV operation due to sessional and environmental effects. Technical analysis of an FSPV plant is represented in (Ho et al., 2015) that incorporates the double water-saturated microencapsulated phase change material (MEPCM) layer. The study analyzes the effect of integrating the MEPCM layer with the FSPV panel and the result of temperature control. The simulation result shows that the power efficiency with the MEPCM layer is increased by 2.03% during summer than the non-layered system. The reliability of the FSPV plant is proposed in (Kim et al., 2019), which determines the water level of the reservoirs through OpenAPI. The outcomes of the study provide a preliminary analysis of FSPV technical operations. A thin film FSPV concept is proposed in (Trapani and Millar, 2014) that is expected to enhance the output power by 5%. An economic analysis of the 100MW FSPV plant is demonstrated in (Zhou et al., 2009) that considers investment, maintenance cost, lifespan, payback period, operation cost, inflation rate, the rate of interest, the minimum attractive rate of return (MARR), and so on as essential parameters. The experimental outcome shows that the MARR and the interest rate increased by 8% and 2%, respectively.
Based on the literature review mentioned in Section 1.2 on the performance of FPSV, it is clear that several research works have been performed to investigate the FSPV feasibility. They mainly showed how superior FSPVs perform compared to counterpart GMPVs, but we believe there are still opportunities for further power performance enhancement. This is because most studies on FSPV performance in literature ignored systems innovation concepts that would potentially help in improving performance, for instance, cleaning systems integration, cooling systems integration apart from natural cooling, and technology upgrades in the system components (e.g., bifacial as it captures reflected components of solar radiation given water is good reflecting medium).
We also understood that individual analyses, i.e., technical, economic, and environmental, are pretty standard, and the combined analysis (i.e., FSPV system feasibility considering all analyses earlier mentioned) is infrequent, even on the industry side, which provides services to clients. On the other side, the industry’s delivery of FSPV installation service to clients is often questioned, highlighting that FSPV modeling is compromised, leading to false promises on performance and feasibility. This might be true given the lack of modeling tools specific to FSPV systems. Also, most studies ignored many key parameters that need to be accounted for while modeling, for instance, degradation and risks to the water ecosystem and other social problems. Additionally, the indicators related to lifecycle sustainability are less given importance. To put this more straightforwardly, the life cycle assessment is somewhat touched on in academia and not touched by industry service providers when delivering service to clients. In some studies, greenhouse gas emission (GHG) reduction based on electricity emission factors benchmarked to fossil fuel-based power plants was only considered in environmental assessment, which may not be suitable under current environmental, social, and governance (ESG) criteria. These insights provide that there is a robust research gap from the point of systems and approach that enhance FSPV power performance, the need for carrying out the combined analysis or integrated assessment for feasibility analysis, and the need for advancing simulation tools specific to FSPV possibly with a framework and conceptual software model.
With this hypothesis, we formulated this review to explore better feasibility assessment approaches for FSPV. For this, we first reviewed various lifecycle-based performance indicators and then identified key indicators that play a significant role in performance enhancement, followed by energy enhancement options. Second, a holistic performance framework that should be practiced in academia and industry is proposed based on the indicators. Third, we reviewed multiple modeling approaches and tools available in the literature to see whether FSPVs can be simulated (with and without adding these performance enhancement strategies), along with the respective tool capability and functionality as per our lifecycle-based performance indicators. Lastly, in the fourth step, based on the outcome of the third step, assessment approaches for FSPV and feasibility tool advancement by proposing a conceptual simulation tool specific to the FSPV project are discussed.
To better understand the FSPV project feasibility, while planning, one should investigate multiple indicators covering the lifecycle of the FSPV and various other intra/interdependent factors. The essential indicators identified for FSPV project feasibility are given in Figure 2; these are classified under the techno-economic-environmental and social analysis category.
The indicators under technical analysis are further divided into the PV array, the balance of the system (BoS), and the overall system based on the FSPV power plant architecture. For a detailed understanding of PV array performance over water bodies, it is advised to assess the array yield, reference yield, array efficiency, array capture losses, thermal capture losses, and miscellaneous losses, followed by investigating the effect of variations in the local weather parameters. Coming to FSPV as a system, especially from the BoS perspective, it is advised to assess the power converter efficiency, system losses, system efficiency, and availability factor, whereas, from an overall system point of view, it is advised to assess the final yield, performance ratio, capacity utilization factor, embodied energy, and energy payback time. Considering the installation of FSPV is also under technical analysis, it is better to assess the wind-bearing strength of the PV panels installed with mooring system support (Kumar et al., 2022).
The indicators under the economic analysis should be simple payback and discounted payback period, annual cash flow, net present value, internal return rate, and levelized cost of electricity, followed by a detailed understanding of capital recovery factor, sinking fund factor, discount rate influence, revenues from decommissioning stage of the plant, and a number of years of operation (i.e., FSPV lifetime depending upon the individual components lifetime or taking the PV array lifetime reference) (Kumar et al., 2022).
The indicators under the environmental analysis should not just be carbon dioxide (CO2) emission; instead, they should include all the impact assessment metrics of environmental life cycle assessment, see Table 1 (Kumar et al., 2020b). Additionally, CO2 mitigation potential benchmarked to national or regional energy mix based on the FSPV installation location and earned carbon credits for trading to include in the economic assessment. Also, given the FSPVs on water bodies, it would be better to investigate the threats to water bodies and downstream due to materials leaching and other harmful element releases by accounting for water-consuming clients (e.g., industry, people, and animals).
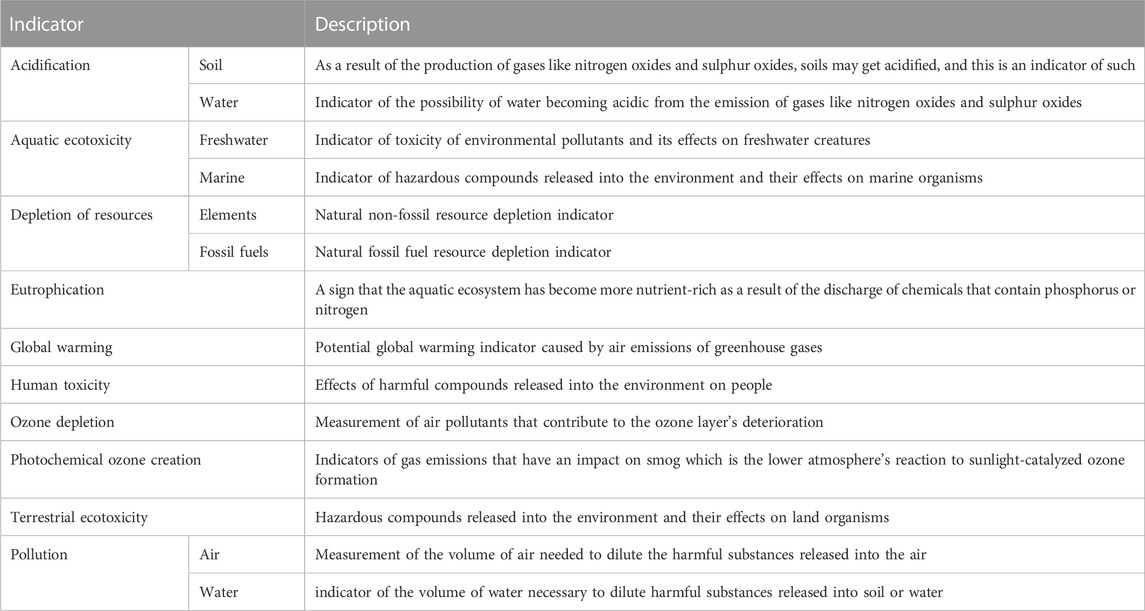
TABLE 1. Impact categories and criteria in environmental life cycle assessment (Kumar et al., 2020b).
The indicators under the social analysis can be public acceptance of the FPSV in their location, local employment creation, contribution to economic development at the local level, and transfer of technology and knowledge among the local people in the FSPV site. In addition, we should also assess the indicators related to the FSPV project life cycle by accounting for impact categories such as human rights, working conditions, cultural heritage, social-economic repercussions, and governance, considering the involved stakeholders falling broadly under groups like workers, local community, society, and value chain actors. The indicators under the above impact categories are given in Table 2 (Manik et al., 2013).
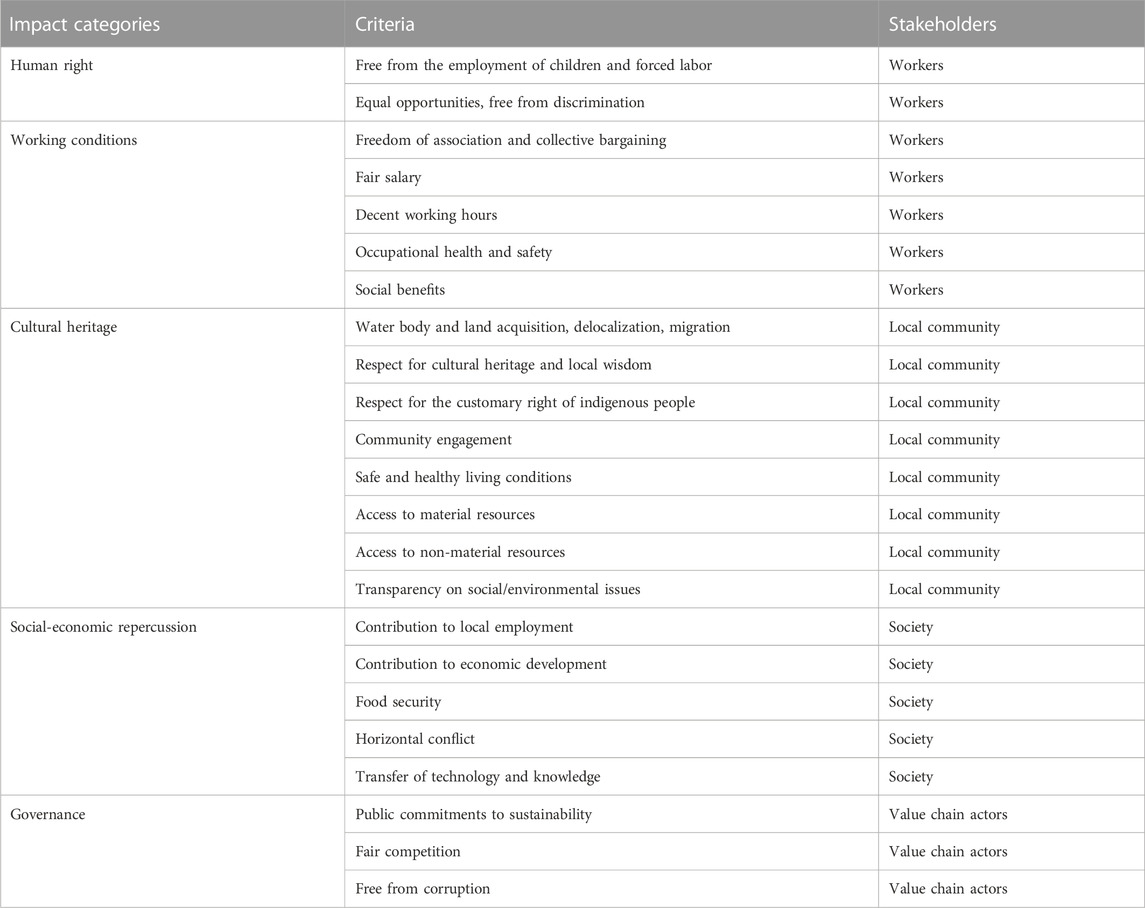
TABLE 2. Impact category and criteria in social life cycle assessment (Manik et al., 2013).
From the indicators highlighted in Section 2.1 a few indicators related to solar PV arrays can be improved with the appropriate introduction of solar panel cooling and cleaning strategies. At the same time, PV array energy can be further enhanced by replacing the conventional monofacial solar PV modules with bifacial solar PV modules.
A bifacial solar PV cell is a promising technology that enhances electric power generation in any solar PV plant by capturing the reflected component of solar radiation. Since FSPVs are installed over water bodies, there is a high scope for bifacial or dual glass modules. The bifacial solar PV modules absorb radiation utilizing both the front and rear sides of the panel. The power generated at each side can be incorporated to measure the efficiency of the PV panel, thus improving the overall PV array parameters (Raina and Sinha, 2022). To understand the role of bifacial modules in FSPV, we explored different essential factors, losses, and significant challenges of bifacial PV systems, see Figure 3. Also, mathematical modeling was presented for power performance estimation.
The power generated at the front face
where
The efficiency at the front and rear face of the PV panel can be determined using Eq. 3 and Eq. 4 (Shoukry et al., 2016; Raina and Sinha, 2023).
The bifaciality factor
The separation rate
where
Relative comparison between bifacial FSPV and mono-facial PV can be expressed in terms of bifacial gain
where
The front side irradiance
where
The irradiance gain
where
The irradiance factor
This section analyzes different techniques for FSPV cooling that minimize the PV module’s temperature and maximizes efficiency apart from the natural cooling that is possible in the FSPV ecosystem. Table 4 presents a summary of different cooling techniques with key features and efficiency, and the below sections describe each of the cooling technique.
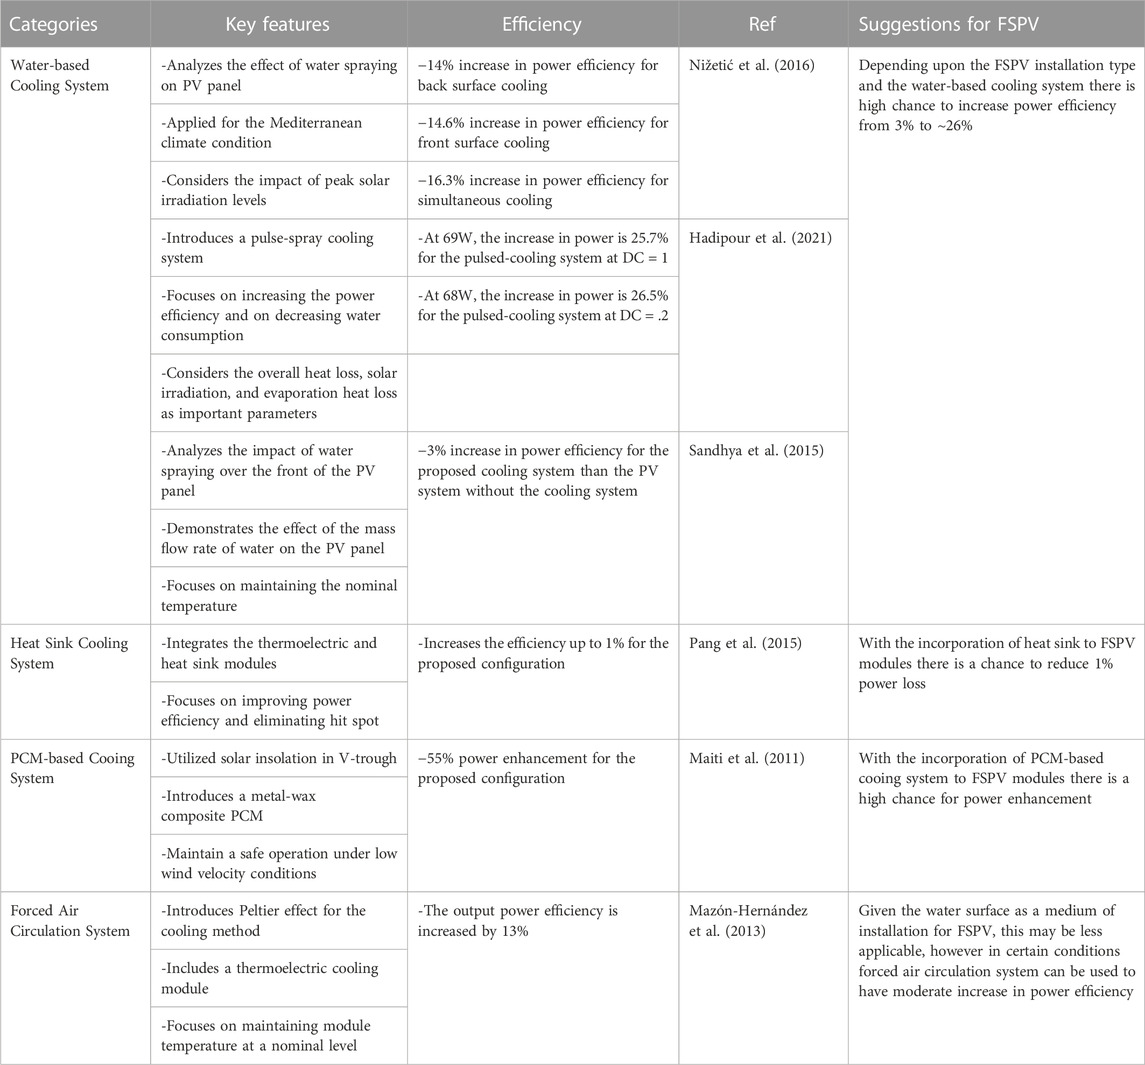
TABLE 4. Summary of different cooling techniques highlighting their key features and efficiency improvements along with applicability for FSPV.
Water veil cooling (WVC) consists of a water veil and pumping system that monitors the reflection of solar radiation and temperature changes (Cazzaniga et al., 2018). The water veil eliminates the negative effects of radiation absorption and improves output power during winter conditions. Water veils lessen the thermal shock and aging of PVs and enhance the overall efficiency of PV systems. A water spray cooling technique for PV plants is proposed in (Nižetić et al., 2016) to maintain cooling operation by spraying water on both sides of the PV panel. The experimental outcomes show a significant increment of output power. A pulsed-spray water cooling technique for PV panels is demonstrated in (Hadipour et al., 2021). The method analyzes the probable uncertainties with an infrared camera, voltmeter, amperemeter, and pyranometer. The experimental result of the process is compared with the steady-spray cooling technique to validate the reliability. A water spray cooling system is presented in (Sandhya et al., 2015) to maintain PV operating temperature at a specific level, as shown in Figure 4.
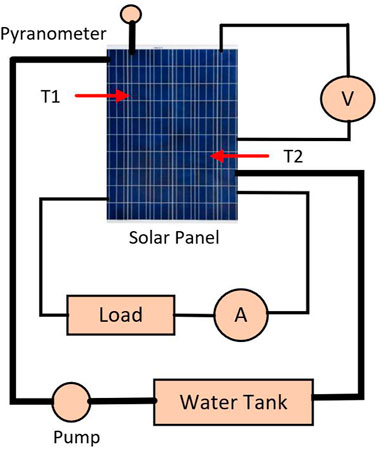
FIGURE 4. Schematic representation of a simple water-based cooling system that can be implemented for FSPV.
The forced water circulation system (FWC) system consists of a PV module, thermal collecting pipes, and a water storage tank to maximize system efficacy (Good, 2016). The pipes circulate water to utilize waste heat when the PV system is exposed to solar radiation. The waste heat is applied for other domestic applications. The water immersion cooling (WIC) technique provides the floating PV plant’s idea where the PV module is placed in a water medium. Water absorbs the extra heat from the PV module to maintain the temperature level at a specific range.
Floating Tracking Cooling Concentrator (FTCC) system consists of PV modules, water sprinklers, and solar reflectors (Jordehi, 2016). The plan illustrates the idea of the floating PV system that provides a one-axis tracking system to track solar radiation. Water sprinklers maintain the PV module’s cooling operation. The solar reflector aims to receive maximum solar radiation that can maximize the output power. An FTCC method is proposed in (Parel et al., 2015) that considers the angular distribution of light to enhance PV system efficiency. An FTCC technology is developed in (Wu et al., 2016) that includes 3-D tracking techniques.
The cooling system consists of joining a p-type semiconductor and an n-type semiconductor that considers the Peltier effect of passing heat from the high-temperature side to the low-temperature side of the PV module. The system allows p-type and n-type semiconductors to connect in series electrically and to connect in parallel thermally. The cooling system includes the PV module, insulator, heat sink, glass cover, and thermoelectric (TE) generator module (Sahay et al., 2015).
The cooling system consists of the heat sink and thermoelectric module to reduce system temperature and increase efficiency (Chen et al., 2013). TE is connected to the back part of the PV module, and two thermal resistors are connected at the top and back parts of the PV module. The temperature increases at the top of the PV module than the back parts as the PV module is exposed to solar radiation. The power generated due to the temperature difference is dissipated through the thermal resistors. The heat sink dissipates the temperature and maintains the PV system’s cooling operation (Pang et al., 2015).
The system includes phase-change material (PCM) at the back part of the PV module. PCM has heat storage capability and balances temperature by melting property when the PV module is exposed to solar radiation and temperature increases (Sharma et al., 2004). A PCM-based cooling system is proposed in (Hasan et al., 2010) that is simulated in the solar simulator platform for three different configurations. The PCM includes the Eutectic mixture of capric-lauric acid, the Eutectic mixture of capric-palmitic acid, and pure salt hydrate. A wax composite PCM matrix-based PV cooling technique is demonstrated in (Maiti et al., 2011).
The system consists of the PV module, forced circulation fan, and air channel. The air circulation fan circulates waste heat from the PV module through the air channel, which maintains the PV temperature at a nominal level and increases efficiency (Mazón-Hernández et al., 2013).
Dust on FSPV modules decreases the overall power efficiency. Hence an appropriate cleaning mechanism is required for better energy yields and smooth operation of the FSPV system. This section analyzes different FSPV panel cleaning techniques. Table 5 presents a brief summary of the cleaning techniques’ key features and energy efficiency increments.
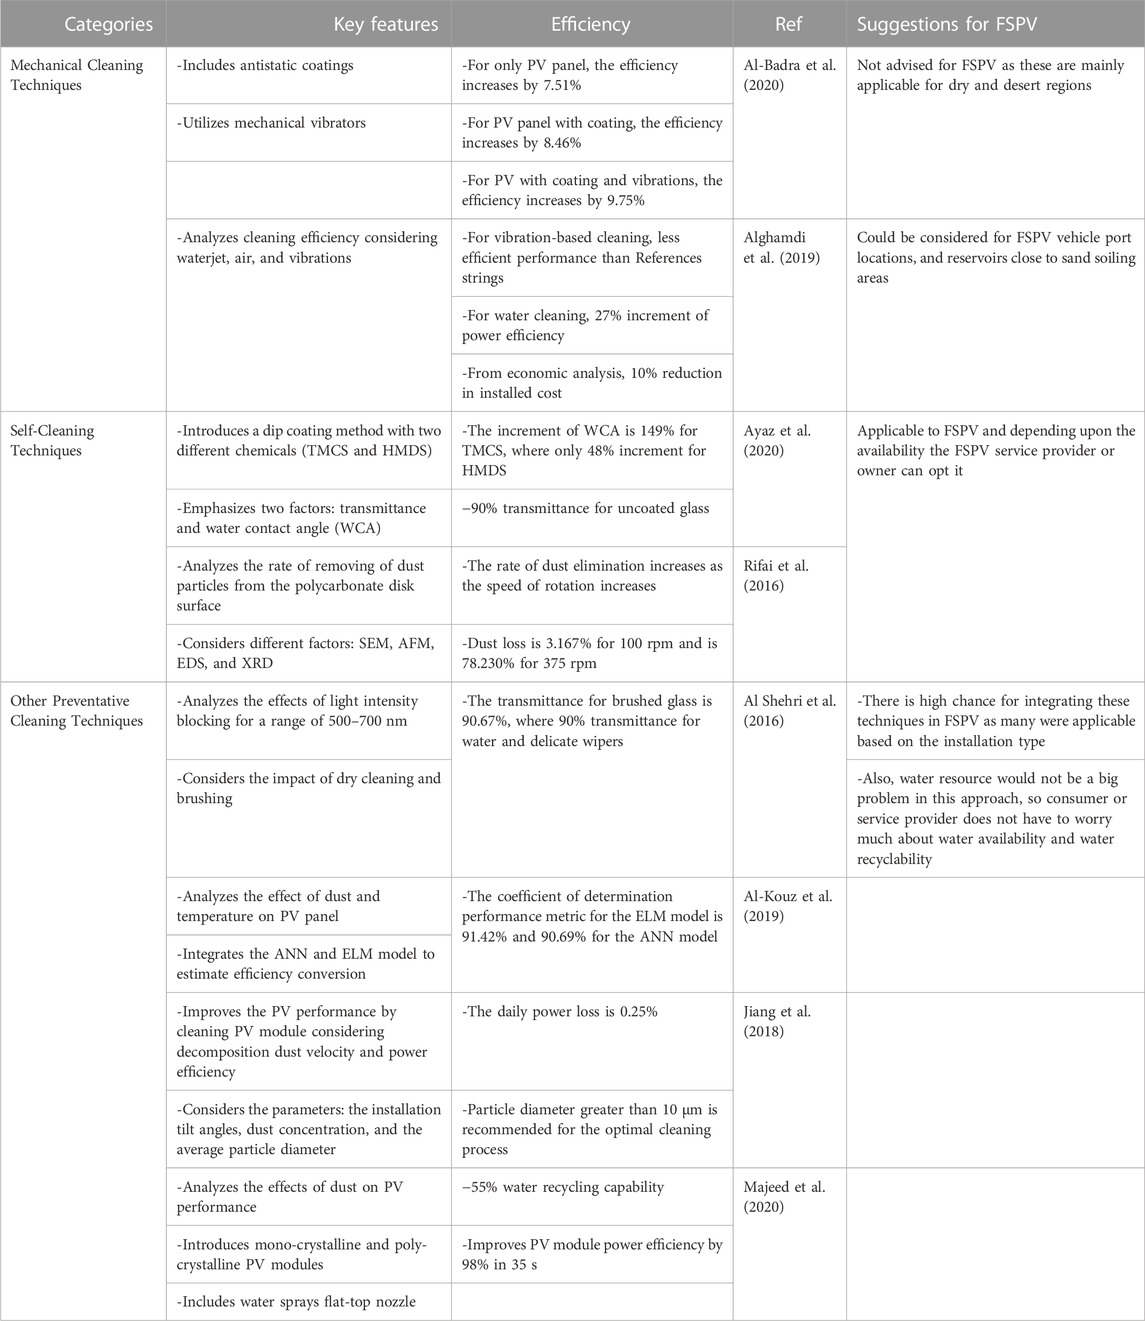
TABLE 5. Summary of different cleaning techniques highlighting their key features and efficiency improvements along with applicability to FSPV.
A cleaning technique for PV panels is demonstrated in (Al-Badra et al., 2020) that incorporates nano-coating with an automated mechanical vibrator. The method is implemented in desert conditions for three cases: PV panel without nano-coating, PV panel with nano-coating and without the mechanical vibrator, and PV panel with nono-coating and mechanical vibrator. The mechanical vibrator shakes the PV panel twice a day to clean the panel. The efficiency of the PV panel is calculated using Eq. 11
where
An automated dust cleaning method for PV modules in desert conditions is presented in reference (Alghamdi et al., 2019), as shown in Figure 5, including mechanical vibrations, air-jet, and waterjet for the cleaning system. The performance efficacy is evaluated for the three individual systems in terms of power output from the module. Both the mechanical vibrations and air-jet cleaning system cannot show significant output power improvement, while the water cleaning method improves power output by 27%. A mechanical cleaning method is proposed in (Mani and Pillai, 2010), that is, effective where the water cleaning method is not applicable. The method’s demerits are that it consumes more power and needs additional costs for mechanical device maintenance. Anderson (2010) demonstrates a mechanical PV cleaning method that enhances the cleaning efficiency by 15%. Another mechanical cleaning technique in (Moreno et al., 2006) provides a 7% increment of power efficiency.
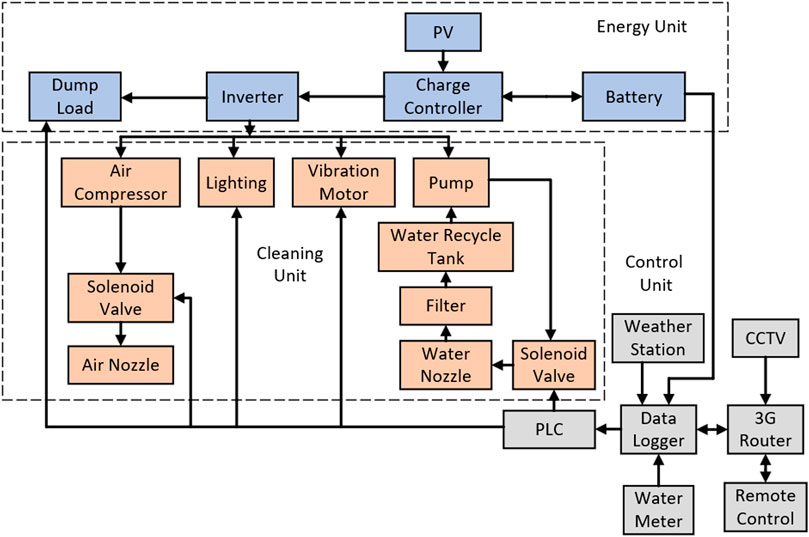
FIGURE 5. A schematic representation of an automated dust cleaning method for PV modules. Redrawn based on ref. (Alghamdi et al., 2019).
A self-cleaning technique for PV modules is proposed in (Ayaz et al., 2020) that incorporates chemicals coatings with two chemicals: trimethylchlorosilane (TMCS) and hexamethyldisilazane (HMDS). The system efficacy is compared with other methods considering some basic terms: water contact angle (WCA), spectrometry, dust measurement, and water cleaning. The analysis shows that the self-cleaning technique with TMCS provides maximum efficacy than HMDS. A self-cleaning method based on the dynamic response of a polycarbonate disk is proposed in (Rifai et al., 2016). The method analyzes different forces, such as centrifugal, gravitational, drag, adhesion, and friction forces, that generate due to the rotational motions of the dust. It considers different important factors: scanning electrons and atomic force microscopes (SEM and AFM), X-ray diffractions (XRD), and energy dispersive spectroscopy (EDS). An ultrasonic self-cleaning technique is demonstrated in (Vasiljev et al., 2013) that requires a thin water layer (<1 mm) to continue an efficient PV cleaning process.
A forced-air-based PV cleaning system for United Arab Emirates (UAE) conditions is proposed in (Assi et al., 2012) that considers PV temperatures, dust storms, and solar irradiance. The scheme improves the power output by enhancing cooling efficiency. Three individual technologies (electrodynamic screen, superhydrophobic nano-coatings, and air-blowing mechanism) based PV panel cleaning technique is demonstrated in (Alqatari et al., 2015). Each of the technologies was implemented in six different Saudi Arabia locations to verify the effectiveness of the PV cleaning system.
1) A dry cleaning technique to remove dust particles from PV modules is presented in (Al Shehri et al., 2016). The study analyzes the effect of Nylon brushes in comparison to other processes: water and delicate wipers. The experiment’s statistical data indicates the technique is an optimal dust-cleaning tool with positive potential. A computational model is proposed in (Al-Kouz et al., 2019) to analyze the effect of dust and temperature on PV panels incorporating the artificial neural network (ANN) and extreme learning machine (ELM) models. Different matrices have been taken into consideration to predict parametric values and conversion efficiency. ELM indicates the conversion efficiency of the proposed model as 91.4%. The conversion frequency is given in Eq. 12.
where
2) A simplified model is demonstrated in (Jiang et al., 2016) to estimate the PV module’s cleaning frequency in desert conditions considering two factors: dust decomposition velocity and dust decomposition density. The model analyzes the effect of different parameters: tilt angle, average particle diameter, and dust concentration on PV modules for cleaning efficacy. The model has limitations in analyzing the increment of cleaning efficiency due to rainfall over the PV panels.
The cleaning time,
where
3) A wind cleaning model based on the particle resuspension theory is proposed in (Jiang et al., 2018). The model considers adhesion force, hydrodynamic force, and torque as essential parameters. The experimental outcome illustrates that the model is effective in removing only the large particles (>1 μm). An effective cleaning method is demonstrated in (Majeed et al., 2020) that continues the experiment for two cases: mono-PV and poly-PV systems. A flat-fan nozzle is included for water spraying to the PV panel. The experimental study illustrates that the cleaning techniques enhance the power efficiency by 98% and minimize cost. A PV panel cleaning system is proposed in (Moharram et al., 2013) that focuses on perceiving non-pressurized water and surfactants’ influence on PV panels’ cleaning purposes. The method aims to minimize the usage of water for cleaning. Experimental results show that the surfactants keep a feasible efficiency of the process, and the non-pressurized water lessens the efficiency by 50%.
Based on the explored indicators for FSPV feasibility in Section 2.1 and potential energy enhancement strategies discussed in Section 2.2 this section presented a holistic framework for FSPV feasibility assessment and questions whether the existing modeling tools are suited or not. The proposed framework considering techno-economic-environmental and social indicators along with system optimization features is shown in Figure 6.
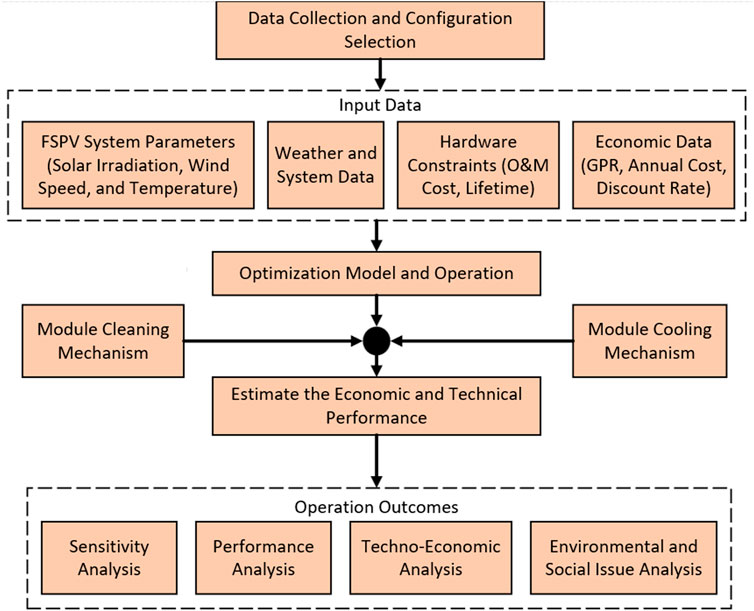
FIGURE 6. A holistic framework proposed for FSPV feasibility assessment considering techno-economic-environmental and social indicators.
To answer the question whether the existing solar modelling tools can model FSPV as per the proposed framework in Figure 6 or not, we reviewed various existing solar simulation tools mainly considering life cycle feasibility indicators mentioned in Section 2.1. Different simulation software tools are available in the market for determining the feasibility of a solar PV alone or solar PV-based hybrid renewable energy system. Table 6 provided a comparison study of 16 popular and less popular tools.
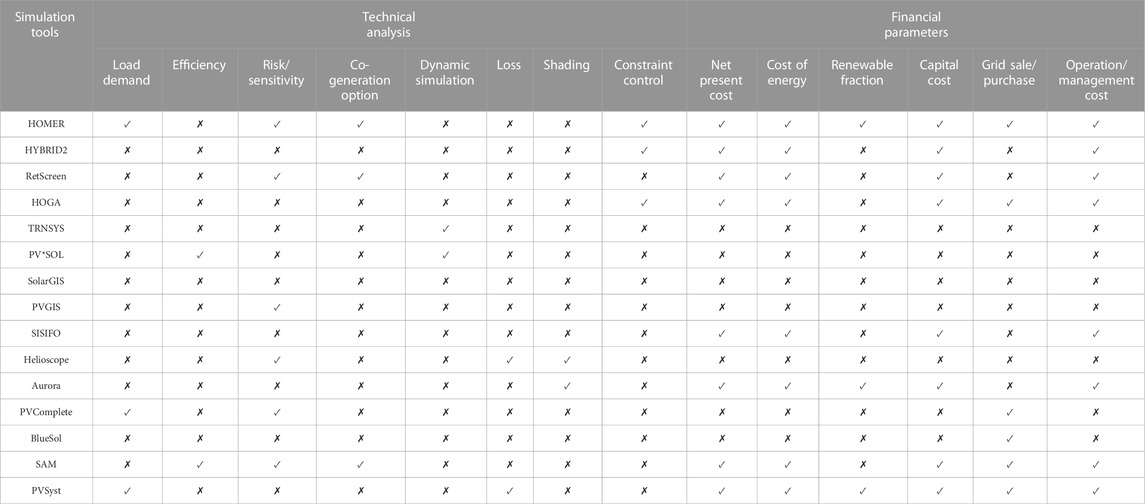
TABLE 6. A comparison of sixteen software illustrating the fundamental idea of important parameters and different analyses.
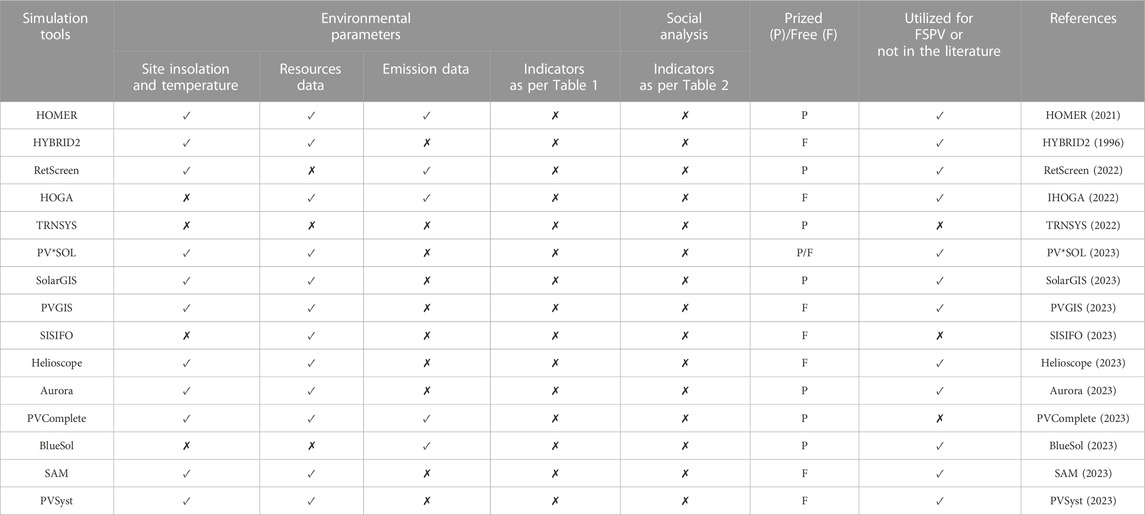
TABLE 6. A comparison of sixteen software illustrating the fundamental idea of important parameters and different analyses.
From Table 6, it can be understood that these tools mainly provide the simulation design, the possibility for optimization based on several variables, an economic assessment in some cases, and a rarely environmental assessment which is again limited to CO2 mitigation. However, the technical, financial, and environmental analysis types vary differently for different simulation tools, methods and indicators are not comprehensive. It is seen that social analysis is something nowhere possible with existing PV project feasibility assessment tools. Accounting for the FSPV project lifecycle-based indicators (as shown in Section 2.1.) from different angles under one tool is quite complicated. Also, none of the existing tools have the capability to simulate or analyze all the indicators. So, researchers and industry people using these tools in a way have limited themselves with this; as a result, compromised planning is seen. However, in reality, the FSPV planning should be done holistically, that is, only possible with a framework’s support; at least then, researchers and industry people will not stop themselves with the capabilities provided by the tools.
Based on the observations from Section 3, we propose three assessment approaches for FSPV feasibility. These include the feasibility assessment of FSPV by mathematical modeling, integrated assessment approaches for floating solar photovoltaic plants (see Figure 7), and a conceptual model of the tool for designing a new tool (see Figure 8).
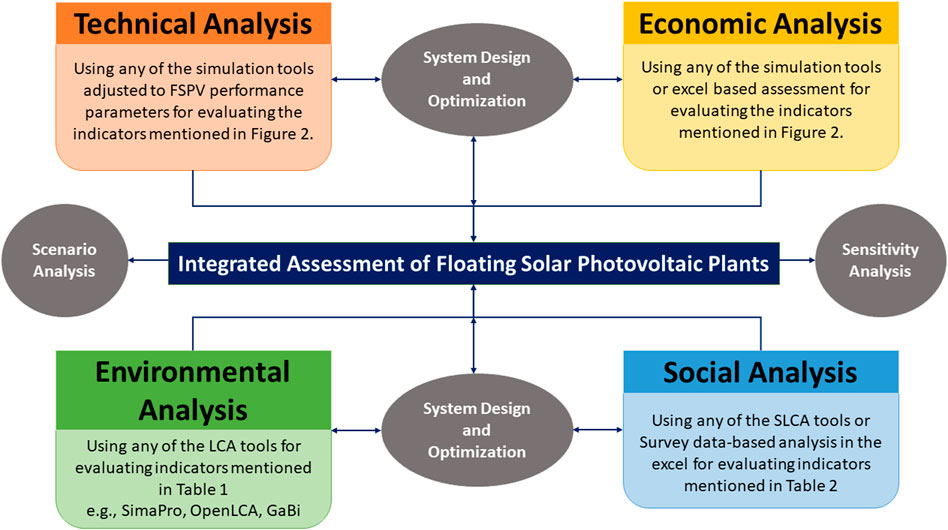
FIGURE 7. Integrated assessment of floating solar photovoltaic plants as per techno-economic-environmental and social framework.
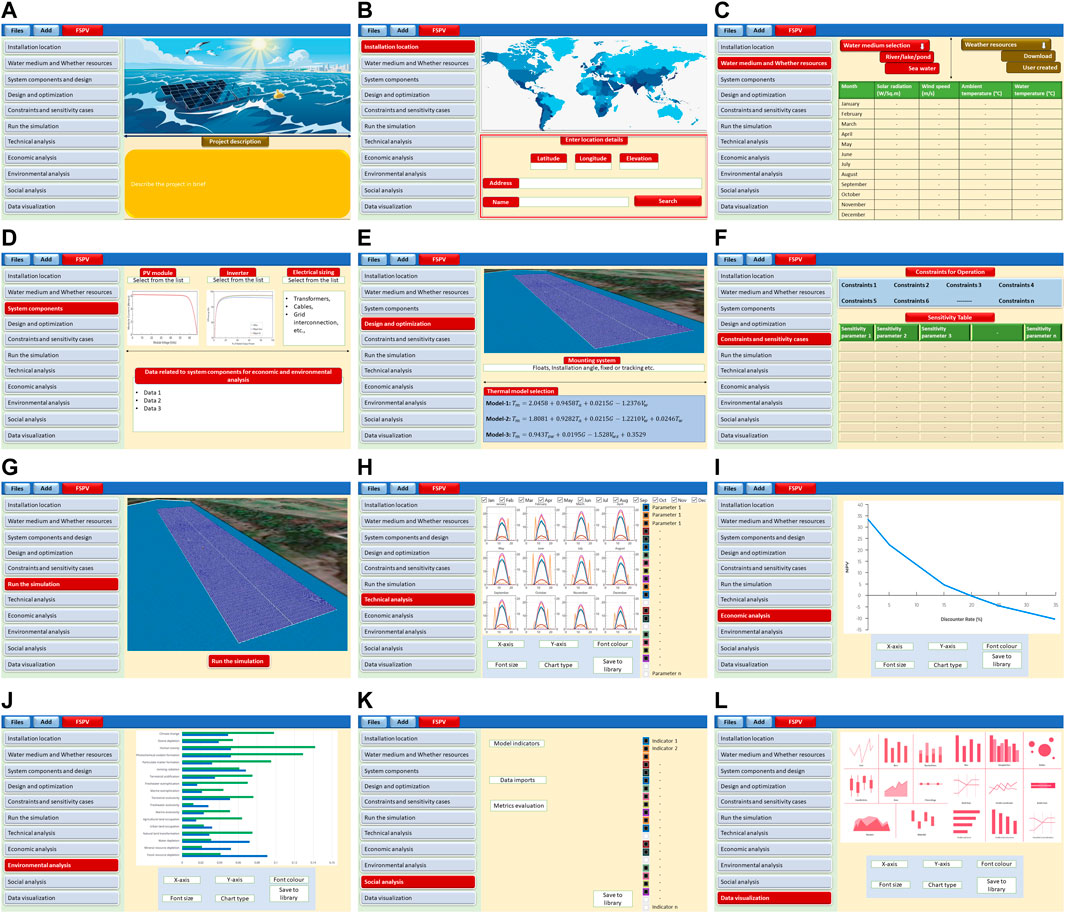
FIGURE 8. The conceptual model of the FSPV simulation modelling tool as per techno-economic-environmental and social framework. (A) Opening page for FSPV modelling and analysis; (B) Installation location window; (C) Water medium and Whether resources window; (D) System components; (E) Design and optimization window; (F) Constraints and sensitivity cases; (G) Run the simulation window; (H) Technical analysis window; (I) Economic analysis window (J) Environmental analysis window (K) Social analysis window (L) Data visualiazaiton window. Note: The performance modelling concept and design layout of the tool was adopted from author’s own source in ref (Kumar et al., 2022) with permission from different publisher.
Among all the modeling approaches, mathematical modeling is quite popular and very traditional. There are already very well-established modeling options for PV systems. These can be adopted for FSPV with slight adjustments in parameter modeling, for instance, temperature models specific to FSPV. Following this modeling, performance indicators can be estimated as per IEA standards. Similarly, economic modeling is quite well-established and can be done mathematically. However, coming to environmental and social analysis, it is quite difficult for mathematical models as they need a lot of data and modeling from a life cycle perspective. Nevertheless, some methods, like embodied energy and carbon, can be adopted. Social analysis as per indicators mentioned in Table 2 can be done by conducting a survey.
The integrated assessment approach shown in Figure 7 can be applied to understand the FSPV feasibility holistically. In this approach, the first system design has to be done separately, for which technical-economical-environmental-social analysis has to be done by picking the right tools. While doing each analysis, data collection and processing is again a crucial step. For instance, in the case of techno-economic analysis, existing tools mentioned in Table 6 with slight modifications can be used. For environmental analysis, first the life cycle inventory data sets have to be created following the guidelines for each component in FSPV. Once the LCI is created, one can use tools like SimaPro (2023); OpenLCA (2022); GaBi (2023) for doing the life cycle assessment. For social analysis, the survey can be conducted, and the surveyed data can be used in excel for assessment. In integrated assessments, there is a possibility for scenario and sensitivity analysis, and based on that system can be optimized or redesigned.
The last model is the proposed conceptual simulation tool for advancing the FSPV simulations. The main objective behind this conceptualization was to bring all analysis (techno-economic-environmental and social) under one roof. In Figure 8, a twelve-window simulation tool is presented. Each window of the simulation tool is briefly explained below:
It is the first window showing summary of the tool capability, with a space to describe about the project, see Figure 8A.
It is the second window asking to enter about the installation location details, see Figure 8B.
It is the third window showing the options related water medium (for instance, river, lake, ocean etc.) and weather resources with a load capability, see Figure 8C.
It is the fourth window providing an option to select system components from the built-in data base or allowing the user to custom built the components based on technical data, see Figure 8D. Additionally, this window also allows us to enter the data inventory needed for economic assessment and environmental setup.
It is the fifth window that allow user to design the FSPV system with optimization capability, see Figure 8E.
It is the sixth window allowing the user to add some constraints for facilitating the FSPV design and optimization; see Figure 8F. Additionally, this window also allows the user to build sensitivity cases around FSPV.
It is the seventh window that allows the user to carry out a simulation by clicking the run command. Additionally, this window shows the FSPV design summary; see Figure 8G.
It is the eighth window presenting the technical analysis results summary with options for parametric analysis on technical indicators. This window also facilitates data exports; see Figure 8H.
It is the ninth window presenting the economic analysis results summary with options for parametric analysis of economic indicators. This window also facilitates data exports; see Figure 8I.
It is the 10th window presenting the environmental analysis results summary with options for parametric analysis of environmental indicators. This window should also facilitate data exports; see Figure 8J. If integrating life cycle assessment modeling in the tool is difficult means, it is advised to enable API options from already existing tools like SimaPro, (2023); OpenLCA, (2022); GaBi, (2023).
The 11th window allows the user to enter the data to process estimating the metrics. It presents the social analysis results summary with options for parametric analysis of social indicators. This window also facilitates data exports; see Figure 8K.
It is the 12th window allowing the user to carry out data visualization with data export options ad report generation; see Figure 8L.
This review showed how FSPV overcomes many performance-related challenges in GMPV. Also, it suggests a detailed investigation of all the feasibility indicators, especially from a lifecycle perspective, while modeling or planning FSPV. These indicators are explored and presented under four different analysis categories. The review outcome also suggested that using bifacial solar PV would be much better for FSPV and the possible integration of cooling and cleaning infrastructure to enhance energy production, keeping the design forefront from a feasibility point of view. Lastly, this review also presented the option of using an integrated assessment approach so that we no need to compromise on the performance and feasibility at their true level. This way, the industry’s false promises on performance reporting to the clients can be overcome. This study also explored the conceptual model bringing all the analysis under one roof and its integration with other existing tools to ensure a detailed performance modeling.
Overall, we believe this review would take the concept of FSPV to an advanced level both at the practical implementation and academic level by exploring new options for modeling and precise prediction of performance, and a holistic understanding of the feasibility. Our future work will be on implementing and validating the proposed conceptual tool.
Review concept was formulated by NM; original draft was written by NM, SI, and AP followed revisions from AS, MB, and SK. All the authors have read and approved the final version.
This work was supported by Science, Technology & Innovation Funding Authority (STDF) under grant (43180).
The authors declare that the research was conducted in the absence of any commercial or financial relationships that could be construed as a potential conflict of interest.
All claims expressed in this article are solely those of the authors and do not necessarily represent those of their affiliated organizations, or those of the publisher, the editors and the reviewers. Any product that may be evaluated in this article, or claim that may be made by its manufacturer, is not guaranteed or endorsed by the publisher.
Akella, A., Saini, R., and Sharma, M. P. (2009). Social, economical and environmental impacts of renewable energy systems. Renew. Energy 34 (2), 390–396. doi:10.1016/j.renene.2008.05.002
Al Shehri, A., Parrott, B., Carrasco, P., Al Saiari, H., and Taie, I. (2016). Impact of dust deposition and brush-based dry cleaning on glass transmittance for PV modules applications. Sol. Energy 135, 317–324. doi:10.1016/j.solener.2016.06.005
Al-Badra, M., Abd-Elhady, M., and Kandil, H. (2020). A novel technique for cleaning PV panels using antistatic coating with a mechanical vibrator. Energy Rep. 6, 1633–1637. doi:10.1016/j.egyr.2020.06.020
Al-Kouz, W., Al-Dahidi, S., Hammad, B., and Al-Abed, M. (2019). Modeling and analysis framework for investigating the impact of dust and temperature on PV systems' performance and optimum cleaning frequency. Appl. Sci. 9 (7), 1397. doi:10.3390/app9071397
Alghamdi, A. S., Bahaj, A. S., Blunden, L. S., and Wu, Y. (2019). Dust removal from solar PV modules by automated cleaning systems. Energies 12 (15), 2923. doi:10.3390/en12152923
Alqatari, S., Alfaris, A., and de Weck, O. L. (2015). “Cost and performance comparative model of dust mitigation technologies for solar PV in Saudi Arabia,” in International conference on environment and renewable energy, Cambridge.
Anderson, M. (2010). “Robotic device for cleaning photovoltaic panel arrays,” in Mobile robotics: Solutions and challenges (Singapore: World Scientific), 367–377.
Assi, A., Hassan, A., Al-Shamisi, M., and Hejase, H. (2012). “Removal of air blown dust from photovoltaic arrays using forced air flow of return air from air conditioning systems,” in 2012 International Conference on Renewable Energies for Developing Countries (REDEC), Beirut, Lebanon, 28-29 November 2012 (IEEE), 1–5.
Aurora (2023). How to sell with aurora in 20 minutes. Available at: https://aurorasolar.com/.
Ayaz, A., Ahmad, H., Ahmad, F., Khan, A., hasnain Tarmazi, S., and Gul, R. M. (2020). Self-cleaning of glass surface to maximize the PV cell efficiency IOP conference series: Materials science and engineering. IOP Publ. 899 (1), 012006. doi:10.1088/1757-899x/899/1/012006
Bjørneklett, B. (2018). Offshore floating solar-a technical perspective. p. v. Tech. Power 16 (16), 6–9.
BlueSol (2023). Photovoltaic design software. Available at: http://www.bluesolpv.com/dnnsite/default.aspx.
Castillo-Aguilella, J. E., and Hauser, P. S. (2016). Multi-variable bifacial photovoltaic module test results and best-fit annual bifacial energy yield model. Ieee Access 4, 498–506. doi:10.1109/access.2016.2518399
Cazzaniga, R., Cicu, M., Rosa-Clot, M., Rosa-Clot, P., Tina, G., and Ventura, C. (2018). Floating photovoltaic plants: Performance analysis and design solutions. Renew. Sustain. Energy Rev. 81, 1730–1741. doi:10.1016/j.rser.2017.05.269
Charles Lawrence Kamuyu, W., Lim, J. R., Won, C. S., and Ahn, H. K. (2018). Prediction model of photovoltaic module temperature for power performance of floating PVs. Energies 11 (2), 447. doi:10.3390/en11020447
Chen, H.-T., Lai, S.-T., and Haung, L.-Y. (2013). Investigation of heat transfer characteristics in plate-fin heat sink. Appl. Therm. Eng. 50 (1), 352–360. doi:10.1016/j.applthermaleng.2012.08.040
Choi, Y.-K. (2014). A study on power generation analysis of floating PV system considering environmental impact. Int. J. Softw. Eng. its Appl. 8 (1), 75–84. doi:10.14257/ijseia.2014.8.1.07
Choi, Y. K., Choi, W. S., and Lee, J. H. (2016). Empirical research on the efficiency of floating PV systems. Sci. Adv. Mater. 8 (3), 681–685. doi:10.1166/sam.2016.2529
Connolly, D., Lund, H., Mathiesen, B. V., and Leahy, M. (2010). A review of computer tools for analysing the integration of renewable energy into various energy systems. Appl. energy 87 (4), 1059–1082. doi:10.1016/j.apenergy.2009.09.026
Dash, P., and Gupta, N. (2015). Effect of temperature on power output from different commercially available photovoltaic modules. Int. J. Eng. Res. Appl. 5 (1), 148–151.
Deo, A., and Tiwari, G. (2014). “Performance analysis of 1.8 kW p rooftop photovoltaic system in India,” in 2nd International Conference on Green Energy and Technology, Dhaka, Bangladesh, 05-06 September 2014 (IEEE), 87–90.
Farfan, J., and Breyer, C. (2018). Combining floating solar photovoltaic power plants and hydropower reservoirs: A virtual battery of great global potential. Energy Procedia 155, 403–411. doi:10.1016/j.egypro.2018.11.038
GaBi (2023). Life cycle assessment product sustainability (GaBi) software. Available at: https://sphera.com/life-cycle-assessment-lca-software/.
Golroodbari, S., Vaartjes, D., Meit, J., van Hoeken, A., Eberveld, M., Jonker, H., et al. (2021). Pooling the cable: A techno-economic feasibility study of integrating offshore floating photovoltaic solar technology within an offshore wind park. Sol. Energy 219, 65–74. doi:10.1016/j.solener.2020.12.062
Good, C. (2016). Environmental impact assessments of hybrid photovoltaic–thermal (PV/T) systems–A review. Renew. Sustain. Energy Rev. 55, 234–239. doi:10.1016/j.rser.2015.10.156
Goswami, A., Sadhu, P., Goswami, U., and Sadhu, P. K. (2019). Floating solar power plant for sustainable development: A techno-economic analysis. Environ. Prog. Sustain. Energy 38 (6), e13268. doi:10.1002/ep.13268
Gotmare, J. A., and Prayagi, S. (2014). Enhancing the performance of photovoltaic panels by stationary cooling. Int. J. Sci. Eng. Technol. 2 (7), 1465–1468.
Gu, W., Ma, T., Li, M., Shen, L., and Zhang, Y. (2020). A coupled optical-electrical-thermal model of the bifacial photovoltaic module. Appl. Energy 258, 114075. doi:10.1016/j.apenergy.2019.114075
Hadipour, A., Zargarabadi, M. R., and Rashidi, S. (2021). An efficient pulsed-spray water cooling system for photovoltaic panels: Experimental study and cost analysis. Renew. Energy 164, 867–875. doi:10.1016/j.renene.2020.09.021
Hasan, A., McCormack, S., Huang, M., and Norton, B. (2010). Evaluation of phase change materials for thermal regulation enhancement of building integrated photovoltaics. Sol. Energy 84 (9), 1601–1612. doi:10.1016/j.solener.2010.06.010
Helioscope (2023). The #1 sales & design software for C&I solar. Available at: https://www.helioscope.com/.
Ho, C., Chou, W.-L., and Lai, C.-M. (2015). Thermal and electrical performance of a water-surface floating PV integrated with a water-saturated MEPCM layer. Energy Convers. Manag. 89, 862–872. doi:10.1016/j.enconman.2014.10.039
HOMER (2021). Optimize the value of your hybrid power system—From utility-scale and distributed generation to standalone microgrids. Available at: https://www.homerenergy.com/.
HYBRID2 (1996). The hybrid system simulation model. Available at: https://www.nrel.gov/docs/legosti/old/21272.pdf.
IHOGA (2022). Simulation and optimization of stand-alone and grid-connected hybrid renewable systems. Available at: https://ihoga.unizar.es/en/.
IRENA (2020). Renewable capacity statistics 2020. Abu Dhabi, UAE: International Renewable Energy Agency.
Jiang, Y., Lu, L., Ferro, A. R., and Ahmadi, G. (2018). Analyzing wind cleaning process on the accumulated dust on solar photovoltaic (PV) modules on flat surfaces. Sol. Energy 159, 1031–1036. doi:10.1016/j.solener.2017.08.083
Jiang, Y., Lu, L., and Lu, H. (2016). A novel model to estimate the cleaning frequency for dirty solar photovoltaic (PV) modules in desert environment. Sol. Energy 140, 236–240. doi:10.1016/j.solener.2016.11.016
Jordehi, A. R. (2016). Parameter estimation of solar photovoltaic (PV) cells: A review. Renew. Sustain. Energy Rev. 61, 354–371. doi:10.1016/j.rser.2016.03.049
Kim, S.-M., Oh, M., and Park, H.-D. (2019). Analysis and prioritization of the floating photovoltaic system potential for reservoirs in Korea. Appl. Sci. 9 (3), 395. doi:10.3390/app9030395
Kreinin, L., Bordin, N., Eisenberg, N., Grabitz, P., Hasenauer, S., Obhof, D., et al. (2012). in Industrial production of bifacial solar cells: Design principles and latest achievements (Konstanz: Bifi Workshop).
Kumar, N. M., Chakraborty, S., Yadav, S. K., Singh, J., and Chopra, S. S. (2022). Advancing simulation tools specific to floating solar photovoltaic systems–Comparative analysis of field-measured and simulated energy performance. Sustain. Energy Technol. Assessments 52, 102168. doi:10.1016/j.seta.2022.102168
Kumar, N. M., Chopra, S. S., Chand, A. A., Elavarasan, R. M., and Shafiullah, G. (2020). Hybrid renewable energy microgrid for a residential community: A techno-economic and environmental perspective in the context of the SDG7. Sustainability 12 (10), 3944. doi:10.3390/su12103944
Kumar, N. M., Chopra, S. S., and Rajput, P. (2020). “Life cycle assessment and environmental impacts of solar PV systems,” in Photovoltaic solar energy conversion (Massachusetts, United States: Academic Press), 391–411.
Kutzer, M., Fülle, A., Jahnke, A., Becker, J., Hahn, H., Wendt, S., et al. (2016). Ertra gssteigerung durch bifaciale Modultechnologie.
Liu, L., Sun, Q., Li, H., Yin, H., Ren, X., and Wennersten, R. (2019). Evaluating the benefits of integrating floating photovoltaic and pumped storage power system. Energy Convers. Manag. 194, 173–185. doi:10.1016/j.enconman.2019.04.071
Maiti, S., Banerjee, S., Vyas, K., Patel, P., and Ghosh, P. K. (2011). Self regulation of photovoltaic module temperature in V-trough using a metal–wax composite phase change matrix. Sol. energy 85 (9), 1805–1816. doi:10.1016/j.solener.2011.04.021
Majeed, R., Waqas, A., Sami, H., Ali, M., and Shahzad, N. (2020). Experimental investigation of soiling losses and a novel cost-effective cleaning system for PV modules. Sol. Energy 201, 298–306. doi:10.1016/j.solener.2020.03.014
Mani, M., and Pillai, R. (2010). Impact of dust on solar photovoltaic (PV) performance: Research status, challenges and recommendations. Renew. Sustain. energy Rev. 14 (9), 3124–3131. doi:10.1016/j.rser.2010.07.065
Manik, Y., Leahy, J., and Halog, A. (2013). Social life cycle assessment of palm oil biodiesel: A case study in jambi province of Indonesia. Int. J. Life Cycle Assess. 18 (7), 1386–1392. doi:10.1007/s11367-013-0581-5
Mazón-Hernández, R., García-Cascales, J. R., Vera-García, F., Káiser, A., and Zamora, B. (2013). Improving the electrical parameters of a photovoltaic panel by means of an induced or forced air stream. Int. J. Photoenergy 2013, 1–10. doi:10.1155/2013/830968
Moharram, K., Abd-Elhady, M., Kandil, H., and El-Sherif, H. (2013). Influence of cleaning using water and surfactants on the performance of photovoltaic panels. Energy Convers. Manag. 68, 266–272. doi:10.1016/j.enconman.2013.01.022
Moreno, L., Cabas, R., and Fernandez, D. (2006). “Low mass dust wiper technology for MSL rover,” in Proceeding of the 9th ESA Workshop on Advanced Sapace Technologies for robotics and Automation, Noordwijk, The Netherlands, November 28-30, 2006, 28–30.
Nižetić, S., Čoko, D., Yadav, A., and Grubišić-Čabo, F. (2016). Water spray cooling technique applied on a photovoltaic panel: The performance response. Energy Convers. Manag. 108, 287–296. doi:10.1016/j.enconman.2015.10.079
Ohtsuka, H., Sakamoto, M., Koyama, M., Tsutsui, K., Uematsu, T., and Yazawa, Y. (2001). Characteristics of bifacial solar cells under bifacial illumination with various intensity levels. Prog. Photovoltaics Res. Appl. 9 (1), 1–13. doi:10.1002/pip.336
Oliveira-Pinto, S., and Stokkermans, J. (2020). Assessment of the potential of different floating solar technologies–Overview and analysis of different case studies. Energy Convers. Manag. 211, 112747. doi:10.1016/j.enconman.2020.112747
OpenLCA (2022). We are happy to announce the release of our newest version: openLCA 1.11. Available at: https://www.openlca.org/.
Pang, W., Liu, Y., Shao, S., and Gao, X. (2015). Empirical study on thermal performance through separating impacts from a hybrid PV/TE system design integrating heat sink. Int. Commun. Heat Mass Transf. 60, 9–12. doi:10.1016/j.icheatmasstransfer.2014.11.004
Parel, T. S., Pistolas, C., Danos, L., and Markvart, T. (2015). Modelling and experimental analysis of the angular distribution of the emitted light from the edge of luminescent solar concentrators. Opt. Mater. 42, 532–537. doi:10.1016/j.optmat.2015.02.011
Perera, H. M. R., and Wen, H. (2020). “Simulation evaluation of floating photovoltaic power system,” in 2020 12th IEEE PES Asia-Pacific Power and Energy Engineering Conference (APPEEC), Nanjing, China, 20-23 September 2020 (IEEE), 1–6.
PV*SOL (2023). PV*SOL online is a free tool for the calculation of PV systems. Available at: https://pvsol-online.valentin-software.com/.
PVComplete (2023). Enabling seamless solar design from concept to construction. Available at: https://pvcomplete.com/.
PVGIS (2023). PVGIS online tool. Available at: https://joint-research-centre.ec.europa.eu/pvgis-photovoltaic-geographical-information-system_en.
PVSyst (2023). A full package for the study of your photovoltaic systems. Available at: https://www.pvsyst.com/.
Raina, G., Sharma, S., and Sinha, S. (2022). Analyzing the impact of dust accumulation on power generation and bifacial gain. IEEE Trans. Industry Appl. 58 (5), 6529–6535. doi:10.1109/tia.2022.3189613
Raina, G., and Sinha, S. (2022). A comprehensive assessment of electrical performance and mismatch losses in bifacial PV module under different front and rear side shading scenarios. Energy Convers. Manag. 261, 115668. doi:10.1016/j.enconman.2022.115668
Raina, G., and Sinha, S. (2023). Experimental investigations of front and rear side soiling on bifacial PV module under different installations and environmental conditions. Energy Sustain. Dev. 72, 301–313. doi:10.1016/j.esd.2023.01.001
Ram, J. P., Manghani, H., Pillai, D. S., Babu, T. S., Miyatake, M., and Rajasekar, N. (2018). Analysis on solar PV emulators: A review. Renew. Sustain. Energy Rev. 81, 149–160. doi:10.1016/j.rser.2017.07.039
Rauf, H., Gull, M. S., and Arshad, N. (2020). Complementing hydroelectric power with floating solar PV for daytime peak electricity demand. Renew. Energy 162, 1227–1242. doi:10.1016/j.renene.2020.08.017
RetScreen (2022). The RETScreen® Clean Energy Management Software platform enables low-carbon planning, implementation, monitoring and reporting. Available at: https://www.nrcan.gc.ca/maps-tools-and-publications/tools/modelling-tools/retscreen/7465.
Rifai, A., Dheir, N. A., Yilbas, B. S., and Khaled, M. (2016). Mechanics of dust removal from rotating disk in relation to self-cleaning applications of PV protective cover. Sol. Energy 130, 193–206. doi:10.1016/j.solener.2016.02.028
Sahay, A., Sethi, V., Tiwari, A., and Pandey, M. (2015). A review of solar photovoltaic panel cooling systems with special reference to Ground coupled central panel cooling system (GC-CPCS). Renew. Sustain. Energy Rev. 42, 306–312. doi:10.1016/j.rser.2014.10.009
Sahin, A. Z., Uddin, M. A., Yilbas, B. S., and Al-Sharafi, A. (2020). Performance enhancement of solar energy systems using nanofluids: An updated review. Renew. Energy 145, 1126–1148. doi:10.1016/j.renene.2019.06.108
Sahu, A., Yadav, N., and Sudhakar, K. (2016). Floating photovoltaic power plant: A review. Renew. Sustain. energy Rev. 66, 815–824. doi:10.1016/j.rser.2016.08.051
SAM (2023). System advisor model. Available at: https://sam.nrel.gov/.
Sandhya, S., Starbell, R. N., and Wessley, G. J. J. (2015). “Study on performance enhancement of PV cells by water spray cooling for the climatic conditions of Coimbatore, Tamilnadu,” in 2015 International Conference on Innovations in Information, Embedded and Communication Systems (ICIIECS), Coimbatore, 19-20 March 2015 (IEEE), 1–5.
Sharma, S. D., Kitano, H., and Sagara, K. (2004). Phase change materials for low temperature solar thermal applications. Res. Rep. Fac. Eng. Mie Univ. 29 (1), 31–64.
Shoukry, I., Libal, J., Kopecek, R., Wefringhaus, E., and Werner, J. (2016). Modelling of bifacial gain for stand-alone and in-field installed bifacial PV modules. Energy Procedia 92, 600–608. doi:10.1016/j.egypro.2016.07.025
SimaPro (2023). LCA software for informed change-makers. Available at: https://simapro.com/.
Singh, J. P., Walsh, T. M., and Aberle, A. G. (2014). A new method to characterize bifacial solar cells. Prog. Photovoltaics Res. Appl. 22 (8), 903–909. doi:10.1002/pip.2341
SISIFO (2023). Simulation for the quality and bankability of PV systems. Available at: https://www.sisifo.info/en/default.
Solangi, K., Islam, M., Saidur, R., Rahim, N., and Fayaz, H. (2011). A review on global solar energy policy. Renew. Sustain. Energy Rev. 15 (4), 2149–2163. doi:10.1016/j.rser.2011.01.007
SolarGIS (2023). Weather data and software for solar power investments. Available at: https://solargis.com/.
Song, J., and Choi, Y. (2016). Analysis of the potential for use of floating photovoltaic systems on mine pit lakes: Case study at the Ssangyong open-pit limestone mine in Korea. Energies 9 (2), 102. doi:10.3390/en9020102
Sun, X., Khan, M. R., Deline, C., and Alam, M. A. (2018). Optimization and performance of bifacial solar modules: A global perspective. Appl. energy 212, 1601–1610. doi:10.1016/j.apenergy.2017.12.041
Trapani, K., and Millar, D. L. (2014). The thin film flexible floating PV (T3F-PV) array: The concept and development of the prototype. Renew. energy 71, 43–50. doi:10.1016/j.renene.2014.05.007
TRNSYS (2022). Transient system simulation tool. Available at: https://www.trnsys.com/.
Vasiljev, P., Borodinas, S., Bareikis, R., and Struckas, A. (2013). Ultrasonic system for solar panel cleaning. Sensors Actuators A Phys. 200, 74–78. doi:10.1016/j.sna.2013.01.009
Wu, Y., Connelly, K., Liu, Y., Gu, X., Gao, Y., and Chen, G. Z. (2016). Smart solar concentrators for building integrated photovoltaic façades. Sol. energy 133, 111–118. doi:10.1016/j.solener.2016.03.046
Xu, R., Liu, C., Liu, H., Sun, Z., Lam, T. L., and Qian, H. (2019). “Design and optimization of a wave driven solar tracker for floating photovoltaic plants,” in 2019 IEEE/ASME International Conference on Advanced Intelligent Mechatronics (AIM), Hong Kong, China, 08-12 July 2019 (IEEE), 1293–1298.
Keywords: floating photovoltaic plant, bifacial floating solar, PV cooling, dust cleaning, soiling, solar plant simulation
Citation: Kumar NM, Islam S, Podder AK, Selim A, Bajaj M and Kamel S (2023) Lifecycle-based feasibility indicators for floating solar photovoltaic plants along with implementable energy enhancement strategies and framework-driven assessment approaches leading to advancements in the simulation tool. Front. Energy Res. 11:1075384. doi: 10.3389/fenrg.2023.1075384
Received: 20 October 2022; Accepted: 27 January 2023;
Published: 20 February 2023.
Edited by:
Sudhakar Babu Thanikanti, Chaitanya Bharathi Institute of Technology, IndiaReviewed by:
Masoud Dashtdar, Islamic Azad University, IranCopyright © 2023 Kumar, Islam, Podder, Selim, Bajaj and Kamel. This is an open-access article distributed under the terms of the Creative Commons Attribution License (CC BY). The use, distribution or reproduction in other forums is permitted, provided the original author(s) and the copyright owner(s) are credited and that the original publication in this journal is cited, in accordance with accepted academic practice. No use, distribution or reproduction is permitted which does not comply with these terms.
*Correspondence: Nallapaneni Manoj Kumar, bW5hbGxhcGFuMi1jQG15LmNpdHl1LmVkdS5oaw==; Salah Kamel, c2thbWVsQGFzd3UuZWR1LmVn
Disclaimer: All claims expressed in this article are solely those of the authors and do not necessarily represent those of their affiliated organizations, or those of the publisher, the editors and the reviewers. Any product that may be evaluated in this article or claim that may be made by its manufacturer is not guaranteed or endorsed by the publisher.
Research integrity at Frontiers

Learn more about the work of our research integrity team to safeguard the quality of each article we publish.