 Tzu-Shun Lin
 Haroon S. Kheshgi1
 Atul K. Jain
94% of researchers rate our articles as excellent or good
Learn more about the work of our research integrity team to safeguard the quality of each article we publish.
Find out more
ORIGINAL RESEARCH article
Front. Energy Res. , 24 February 2023
Sec. Bioenergy and Biofuels
Volume 11 - 2023 | https://doi.org/10.3389/fenrg.2023.1070186
Annual U.S. production of bioethanol, primarily produced from corn starch in the U.S. Midwest, rose to 57 billion liters in 2021, which fulfilled the required conventional biofuel target set forth by the Energy Independence and Security Act (EISA) of 2007. At the same time, the U.S. fell short of the cellulosic or advanced biofuel target of 79 billion liters. The growth of bioenergy grasses (e.g., Miscanthus and switchgrass) across the Central and Eastern U.S. has the potential to feed enhanced cellulosic bioethanol production and, if successful, increase renewable fuel volumes. However, water consumption and climate change and its extremes are critical concerns in corn and bioenergy grass productivity. These concerns are compounded by the demands on potentially productive land areas and water devoted to producing biofuels. This is a fundamental Food-Energy-Water System (FEWS) nexus challenge. We apply a computational framework to estimate potential bioenergy yield and conversion to bioethanol yield across the U.S., based on crop field studies and conversion technology analysis for three crops—corn, Miscanthus, and two cultivars of switchgrass (Cave-in-Rock and Alamo). The current study identifies regions where each crop has its highest yield across the Center and Eastern U.S. While growing bioenergy grasses requires more water than corn, one advantage they have as a source of bioethanol is that they control nitrogen leaching relative to corn. Bioenergy grasses also maintain steadily high productivity under extreme climate conditions, such as drought and heatwaves in the year 2012 over the U.S. Midwest, because the perennial growing season and the deeper and denser roots can ameliorate the soil water stress. While the potential ethanol yield could be enhanced using energy grasses, their practical success in becoming a potential source of ethanol yield remains limited by socio-economic and operational constraints and concerns regarding competition with food production.
Biomass can be converted directly into liquid fuels, also called biofuels, that are primarily used for transportation because of their portability and energy density. Worldwide demand for liquid fuels, primarily petroleum-based, is projected to grow (IEA, 2015). Bioethanol is a common type of biofuel in use today that can potentially have low life-cycle greenhouse gas emissions depending on how it is produced (Searchinger et al., 2015; Wang et al., 2015). Bioethanol produced from crops via fermentation is currently the most prevalent liquid fuel sourced from biomass. Currently, the United States is the largest bioethanol producer of any country, primarily producing its bioethanol from corn grain-, converting starch to sugar, and then to bioethanol via fermentation (RFA, 2022). Brazil is the second largest producer, driving its bioethanol from the sugar in sugar cane (Chum et al., 2011). Bioethanol is thus a potential option to supply transportation fuels in a low-carbon future. However, bioethanol production from sugar and starch is land-use intensive—i.e., the area of land used to grow feedstock crops per unit of bioethanol produced is large (Melillo et al., 2009; Zhuang et al., 2013; Song et al., 2016).
The production of bioethanol from cellulosic feedstocks, which are non-food based and include crop residues, wood residues, dedicated energy crops, and industrial and other wastes (rather than just from simple sugars and starch), has the potential to decrease bioethanol’s land-use intensity. In the recent decade, the number of cellulosic bioethanol plants in the U.S. has increased (Brown et al., 2015), rising from 76 kL in 2012 to 38 × 103 kL in 2017 and after that decreasing to about 7.8 × 10³ kL in 2020 (EPA, 2022). In 2021, bioethanol production further decreased to 2.2 × 10³ kL (RFA, 2022). The overall U. S. ethanol production by corn grain starch accounts for 93.8%, cellulosic biomass accounts for 3.9%, and beverages, food waste, non-corn grain starch, and sugar account for the rest 2.3% (RFA, 2022). According to Energy Independence and Security Act (EISA, 2007), the annual production of renewable fuels of 136 billion liters, including 79 billion liters of cellulosic or advanced biofuels, is expected to be produced in the U.S. by 2022. The annual U.S. production of bioethanol, primarily produced from corn starch in the U.S, rose to 57 billion liters in 2021 (USDA, 2022) (Supplementary Figure S1), which fulfilled the required conventional biofuel target set forth by the EISA (2007). However, the U.S. fell short of the cellulosic or advanced biofuel target of 79 billion liters. The U.S. to meet its goals would depend on increased production of crop yields, such as of corn (Zea mays), and the conversion efficiencies of cellulosic feedstock, such as the perennial grasses Miscanthus (Miscanthus
Multiple studies point to Miscanthus’s high maximum biomass yield compared to switchgrasses and corn (Jain et al., 2010; Song et al., 2016). Observation-based estimates for Miscanthus were on average 22 Mg/ha/yr compared to 10 Mg/ha/yr for switchgrass (Heaton et al., 2008; Myers et al., 2012). One study which reports side-by-side trial results in central Illinois showed that Miscanthus produced 60 percent more biomass than corn (Dohleman and Long, 2009). Several crop productivity modeling studies have estimated the spatial variations for bioenergy feedstock for Miscanthus and switchgrasses in the United States. Using the process-based crop-growth land surface model employed here (see Section 2.1), Song et al. (2015, 2016) estimated the average annual yield ranges between 2–25 Mg/ha/yr for Miscanthus, 2–15 Mg/ha/yr for Cave-in-Rock (which has high yields over the same land region as Miscanthus), and 4–17 Mg/ha/yr for Alamo. Most other modeling studies estimated the highest yield values for these bioenergy crops consistent with these estimates (Thomson et al., 2009; Jager et al., 2010; Behrman et al., 2013; Zhuang et al., 2013), but there were a few exceptions. For example, model-based values reported by Miguez et al. (2011) and VanLoocke et al. (2012) were as high as 40.5 Mg/ha/yr and 36 Mg/ha/yr for Miscanthus, and 20 Mg/ha/yr and 16 Mg/ha/yr for switchgrass, respectively.
Few published studies compared the bioethanol yields produced from bioenergy crops’ biomass with bioethanol yields produced from corn grain and stover in the United States. Zhuang et al. (2013) compared modeled potential bioethanol yield of corn, switchgrass and Miscanthus limited to regions where corn is currently grown and found that Miscanthus had higher bioethanol yield.
The aim of this study is twofold: 1) to calculate the spatial distribution of the potential bioethanol yield (per unit land area) of cellulosic bioethanol plants, with feedstocks including corn grain and stover, and perennial bioenergy grasses, including Miscanthus, Cave-in-Rock, and Alamo, across the Central and Eastern U.S; and 2) to calculate the effects of growing corn and perennial bioenergy grasses on surface hydrological components and the impacts of extreme drought and heat on bioethanol yield. To accomplishes these aims, the calculations are performed using a crop growth land surface model, Integrated Science Assessment Model (ISAM) along with estimates of harvest fractions and biomass-to-bioethanol conversion factors. This study is part of a larger study on the Climate-induced Extremes on the Food, Energy, Water Systems (C-FEWS) and the Role of Engineered and Natural Infrastructure (Vörösmarty et al., 2022) that examines food and bioenergy crop yields in the U.S. Midwest and Northeast for a range of different model simulations and outcomes.
Potential crop yield estimates for this study are generated using the Integrated Science Assessment Model (ISAM) at 0.1o × 0.1o spatial resolution. The model is a coupled biogeochemical and biophysical model (Jain et al., 2009; Song et al., 2013; Barman et al., 2014a; Barman et al., 2014b; Song, 2015; Song et al., 2015; Song et al., 2016). It accounts for natural plant function types and specific food/bioenergy crops, including corn, Miscanthus, and two cultivars of switchgrass, upland (Cave-in-Rock), and lowland (Alamo) ecotypes. ISAM’s biophysical component consists of carbon assimilation, energy balance, and hydrological cycle processes, which are fully coupled through a coupled leaf temperature-photosynthesis-stomatal conductance scheme (Barman et al., 2014a; Barman et al. 2014b). ISAM’s biogeochemical component consists of a dynamic vegetative carbon, nitrogen, structure (leaf area, canopy height, and root depth) growth scheme, and a crop-specific phenology scheme (Song et al., 2013; Song, 2015; Song et al., 2015; Song et al., 2016; Gahlot et al., 2020; Lin et al., 2021), and coupled soil C and N dynamics (Yang et al., 2009) (Figure 1).
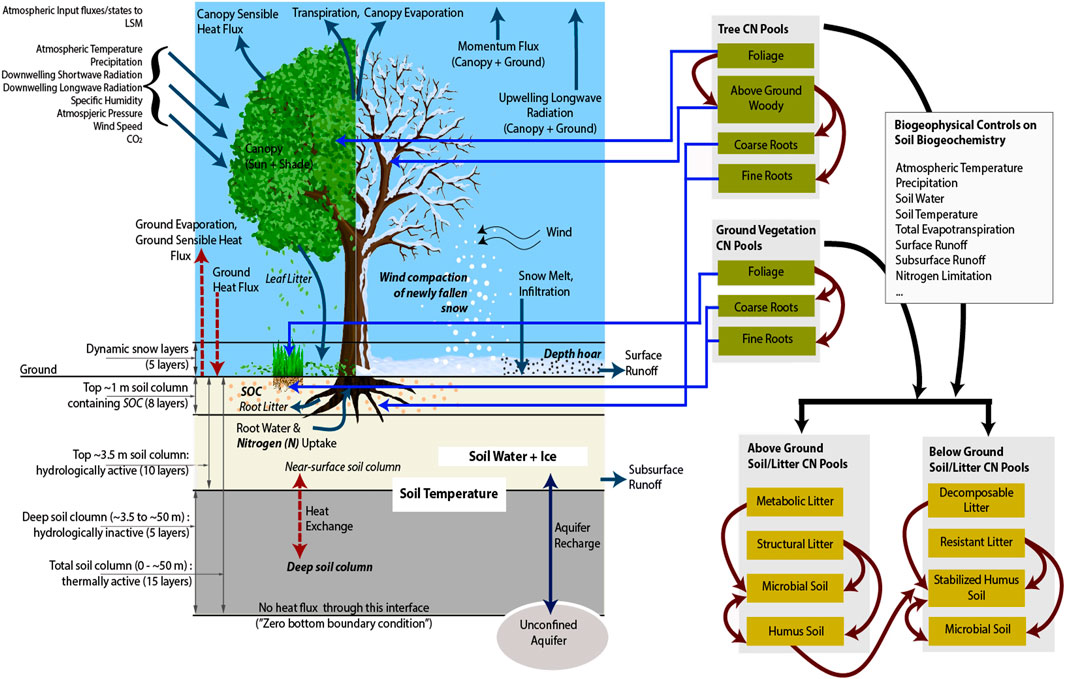
FIGURE 1. Conceptual diagram of coupled biogeophysics and biogeochemistry ISAM land model.
A series of earlier published studies have carried out ISAM model calibration and validation of various model processes and fluxes for bioenergy and row crops at several sites. Specifically, we evaluated ISAM’s ability to simulate spatial and temporal variability in carbon assimilation rates, leaf area index, aboveground and belowground biomasses, biomass yield, evapotranspiration, soil water content, nitrogen fertilization effect on biomass yield, and nitrogen leaching. The site-level input data set and model evaluation results can be found in Song et al. (2013), Song et al. (2015), Song (2015), Song et al. (2016).
We use ISAM to estimate the growth of three bioenergy grasses and corn at 0.1o x 0.1o spatial resolution covering the Central and Eastern U.S., and specifically Midwestern U.S., a predominant corn growing region. The growth depends on the survival rates of these crops (under the assumption of no irrigation), which depend upon the latitude of origin and their varied adaptability to different environmental conditions, such as winter hardiness, day length, and hot, dry and cold conditions, and N fertilizer application rates (Song et al., 2013; Song et al. 2015; Song et al. 2016). The western United States, where bioenergy grasses could not survive due to drier conditions (Casler, 2012), is excluded from this study.
The potential bioethanol yield (liters (L) ethanol per hectare) was estimated by multiplying the ISAM estimated aboveground dry biomass density at harvest time averaged over 40 years (dry Mg/hectare), harvest fractions (fraction of aboveground biomass), and the conversion factor of corn biomass and cellulosic biomass (L ethanol/dry Mg), [i.e., (dry Mg/hectare) x fraction x (L ethanol/dry Mg)], as summarized in Table 1.It is important to note that while producing bioethanol from corn grain has been in commercial practice for decades, producing it from cellulosic matter is a less mature technology.
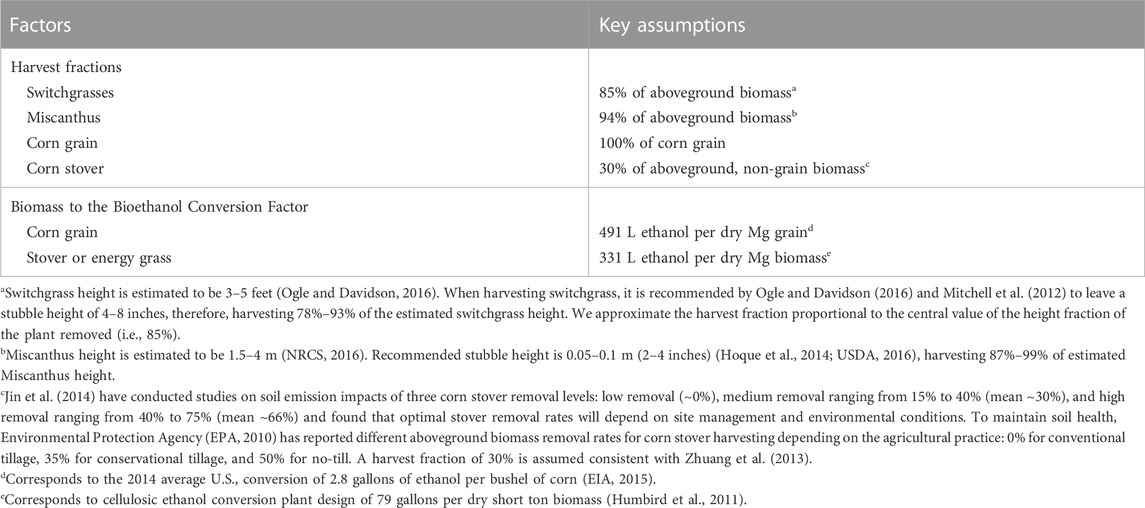
TABLE 1. Key assumptions of harvest fractions and biomass-to-bioethanol conversion factors (i.e., the volume of bioethanol produced per unit biomass).
While the conversion factor for corn grain given in Table 1 is derived from current commercial practice (EIA, 2015), the assumed conversion factor for cellulosic bioethanol is drawn from a cellulosic bioethanol conversion plant design (Humbird et al., 2011). The high fraction of starch in corn grain, which can easily be converted to sugar for fermentation to bioethanol, leads to a higher conversion factor for corn grains than for corn stover or bioenergy grasses.
We performed four ISAM simulations over the period 1980–2019 by assuming that the existing unmanaged (e.g., forest, grasses, including the marginal land) and managed (e.g., row crops and pasture) vegetation types at each model pixel in the Central and Eastern U.S. are completely replaced by each of the following bioenergy crops or their cultivars, one at a time: Miscanthus, switchgrass upland cultivar (Cave-in-Rock), switchgrass lowland cultivar (Alamo) and corn. Each model simulation is driven by spatial and hourly temporal resolution data from the NLDAS-2 for climate variables (Xia et al., 2012) and soil texture data from the GSDE (Shangguan et al., 2014).
For all crops, nitrogen fertilizer is added to decrease nitrogen limitation. The N fertilizer application rates for bioenergy grasses for the current study are compiled based on previous studies, which vary spatially from 20 to 60 kg N ha-1yr-1 for Miscanthus, 40–120 kg N ha-1yr-1 for two switchgrass cultivars as described in Song et al. (2016). The N fertilizer application rates for corn are taken from the USDA-ERS (2021). Irrigation is applied for corn in areas equipped for irrigation (Lin et al., 2021).
Corn is planted yearly during the spring based on the crop progress report from the United States Department of Agriculture (USDA) National Agricultural Statistics Service (NASS) and harvested when the crop becomes mature. We assume 30% of aboveground biomass removal rates for corn stover consistent with Zhuang et al. (2013); Jin et al. (2014) (Footnote “c” of Table 1)
Unlike corn, the three perennial bioenergy grasses (Miscanthus, Cave-in-Rock, and Alamo) are planted in 1980, and a fraction (see Table 1) of aboveground biomass is harvested each year in late winter. The non-harvested aboveground biomass for each bioenergy crop is returned to the soil as litter and decomposes over time.
The potential bioethanol yield for each bioenergy crop at each 0.1 ° × 0.1 ° grid cell is reported in the next section as the arithmetic mean of estimated bioethanol productivity over the study period (the 40 years from 1980 through 2019) and includes in this period the establishment of perennial grasses where yield is often lower over the first year or two after planting, than later in the period. We also investigate the extreme drought and heat impact on bioethanol yields based on the C-FEWS framework. We draw on C-FEWS framework simulations of food, energy, and water systems from Vörösmarty et al. (2022).
The ISAM estimated potential annual bioethanol yield per hectare is shown for the different crops across the Central and Eastern U.S. landscape in Figure 2.
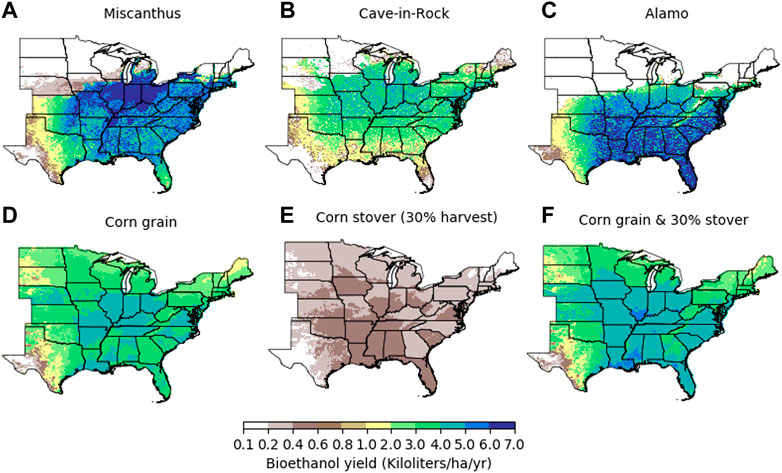
FIGURE 2. The distribution of potential annual bioethanol yield for Miscanthus (A), Cave-in-Rock (B), Alamo (C), corn grain (D), corn stover (E), and corn grain plus 30% stover (F). Irrigation is applied for corn in areas equipped for irrigation but not for bioenergy grasses.
Despite the higher conversion factor of corn grain biomass yield to bioethanol yield (Table 1), it has a comparable bioethanol yield to that of the other energy crops because the biomass yield of corn grain is generally smaller than the three bioenergy crops studied here. Adding the assumed harvest of 30% of corn stover with an assumed bioethanol conversion factor equal to that of other cellulosic feedstocks (see Table 1) increases the overall bioethanol yield of corn (grain plus 30% of stover harvested, Figure 2F).
The estimated maximum bioethanol yield, defined as the area of a crop with the highest ethanol yield in a grid cell, is shown in Figure 3. The potential bioethanol yield of each bioenergy peaks in different locations from north to south, with Cave-in-Rock in parts of northeast, followed by Miscanthus and corn, and Alamo furthest south (Figure 3), overlapping parts of the current corn growing land region (Figure 3).
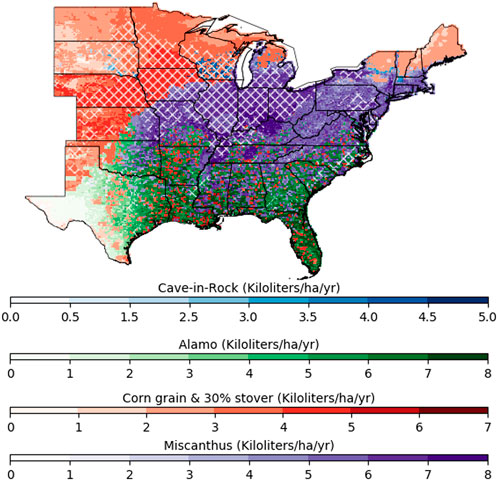
FIGURE 3. The distribution of maximum potential bioethanol yield across the modeled crops: Miscanthus, two switchgrass cultivars, upland (Cave-in-Rock) and lowland (Alamo), and corn (grains plus 30% stover harvested). The figure shows only the yield for crop or crop cultivar studied here. The current major corn growing area (i.e., the harvested area where corn is grown on over 500 ha in white) (See Supplementary Figure S2) overlays some of the highest-yielding land areas.
Miscanthus and Alamo have the highest maximum potential ethanol yield (about 8.5 kL/ha/yr) when comparing yields in the study region, but yields drop off more steeply than corn or Cave-in-Rock (Figure 4), suggesting that a limited number of grids cells in the study region can produce high bioethanol yeild from these two energy crops. The calculated highest potential yield for Cave-in-rock is about 5.7 kL/ha/yr, but the spatial variation of Cave-in-rock yield across grid cells is relatively low. It has the potential to grow on 10%–15% more grid cells than the two other bioenergy crops, particularly in the Northeast and parts of the upper Midwest (Figure 2). Corn’s (grain plus 30% of stover harvested) highest calculated maximum potential ethanol yield is about 5.6 kL/ha/yr. Across grid cells, corn’s potential yield variations are lower than the other crops, and corn can grow on more grid cells than the other three bioenergy crops. It is estimated that corn produces less bioethanol yield than any of the bioenergy grasses in 65% of grid cells in the study region, implying that growing bioenergy grasses can enhance the bioethanol yield in these areas.
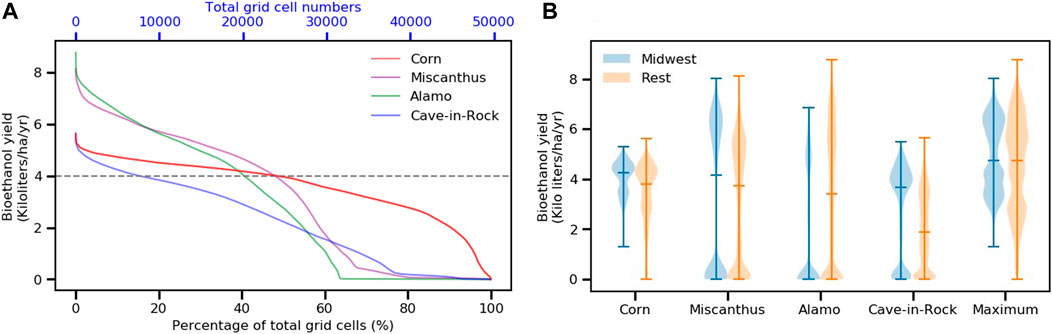
FIGURE 4. Cumulative distribution of bioethanol yields grown on modeled land grid cells in Central and Eastern United States. Curves shown correspond to bioethanol yield mapped for Miscanthus, Cave-in-Rock, Alamo, and corn (grain plus 30% of stover harvested) in Figures 2A–F.
Yield is one fundamental factor influencing the desirability of biofuels and associated crops, but it is not the only factor. Crops differ in their consumption of water and the need for added N fertilizer and associated N runoff (Heaton et al., 2008; Hickman et al., 2010; McIsaac et al., 2010; Smith et al., 2013; Zhuang et al., 2013; Song et al., 2016). Growing bioenergy crops can also reduce the annual runoff and N leaching due to higher evapotranspiration (Figure 5) than corn and biological N fixation by Miscanthus (Song et al., 2016). In addition, it is suggested energy crops require less fertilizer input than corn because they recycle nutrients to belowground roots and rhizomes before the dry shoots are harvested in late fall and early winter (Cadoux et al., 2012).
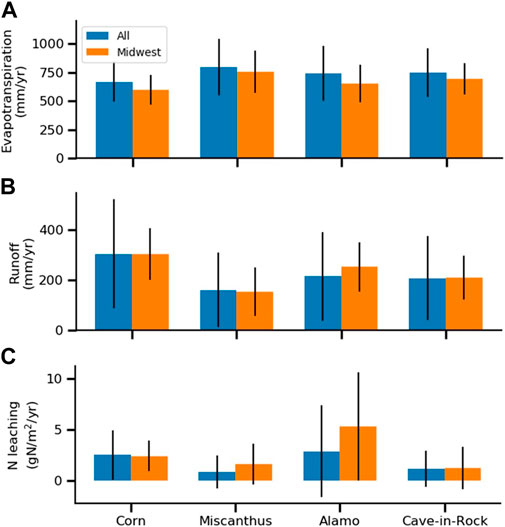
FIGURE 5. The 1980–2019 averages for (A) evapotranspiration, (B) runoff, and (C) N leaching for corn (grain plus 30% of stover harvested), and three bioenergy crops, Miscanthus, Alamo, and Cave-in-Rock. The values are plotted for the Central and Eastern United States (All) and the Midwest U.S. (Midwest). Error bars are one standard deviation (S.D.) of all grid cell values of all and Midwest regions.
Figure 5 shows the distribution of 1980–2019 mean evapotranspiration (ET), runoff (=Rsurface + Rsub_surface, where Rsurface stands for surface and Rsub_surface, sub-surface runoff), and N leaching from simulations for corn (grain plus 30% of stover harvested) and three bioenergy crops. As a whole, corn’s ET is lower (average around 700 mm/yr), whereas runoff is higher (305 mm/yr), than for three bioenergy crops (ET: 740–800 mm/yr, runoff: 161–215 mm/yr). This is because a longer growing season enables root systems to grow deeper and accumulate more biomass than corn, suggesting that the growing bioenergy crops can reduce regional water availability for human use, such as thermoelectric production and irrigation. As for nitrogen leaching, our study results show lower N leaching due to growing bioenergy crops (0.88–2.80 g N/m2/yr) compared to corn (2.58 g N/m2/yr), mainly due to modest amounts of N fertilizer for Miscanthus and switchgrasses compared to corn (Song et al., 2016).
Climate change and extremes are also expected to impact crop yields not only for food crops but also for bioenergy crops. The extremely dry and hot weather conditions, for example, in the 2012 spring and summer led to devastating crop damage in much of the Midwest (Elliott et al., 2018). We investigate this extreme year’s impact on bioethanol yield based on the aggregate metric from the C-FEWS framework (Eq. (1), Vörösmarty et al., 2022) (Appendix A).
Figure 6 shows the expected negative impact of the 2012 drought on corn-based ethanol yields in the Midwest. In current corn-harvested areas (Supplementary Figure S2), growing bioenergy crops attenuates the negative responses to the 2012 drought and heat impact, revealing bioenergy grasses are more resistant to climate variability than corn, because bioenergy grasses being grown perennially and their deep roots can extract water from the deeper moist soil layers and dampen the extreme drought and heat impacts. However, in general, growing bioenergy grasses in current corn-harvested areas over Midwest results in lower bioethanol yields than corn because bioenergy crops are not adapted to winter hardiness in the upper Midwest (i.e., Wisconsin, Minnesota, and west, north, and northeast Iowa), bioenergy grasses were damaged by extreme cold conditions, frost killing or/and over-winter injury (Figure 2).
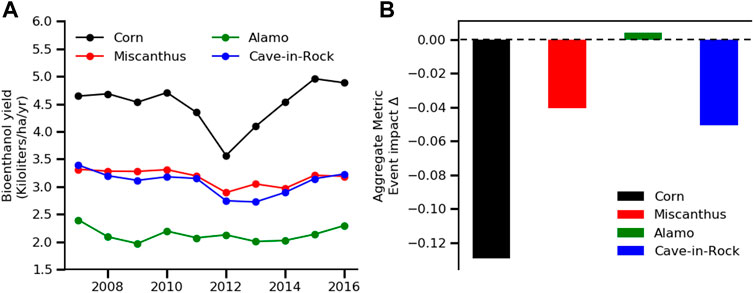
FIGURE 6. The impact 2012 Midwest drought and heat on (A) bioethanol yield for corn (grain plus 30% of stover harvested) and three bioenergy crops (Miscanthus, Alamo, and Cave-in-Rock) from 2007 to 2016. (B) Drought impact metrics in 2012 (Eq. 1 Vörösmarty et al., 2022, and also see Appendix A) are expressed as bar graphs.
Yield is one fundamental factor influencing the desirability of biofuels and associated crops, but it is not the only factor. The cost of growing and converting crops to bioethanol also differs between crops (NRC, 2011). While the conversion of corn to bioethanol would divert potential food stocks to ethanol, greater demand for corn could also result in greater production of feed by-products (e.g., distiller’s grains and solids). In contrast, the energy grasses might compete for high-productivity agricultural land (Searchinger et al., 2015). Bioethanol is one potential pathway to lower greenhouse gas emissions from transportation. However, the growth of crops and conversion to bioethanol can result in life-cycle greenhouse gas emissions which differ between crops (Searchinger et al., 2015; Song et al., 2015; Wang et al., 2015), conversion technologies (Edwards et al., 2014), and the potential use of carbon capture and storage for process emissions (Kheshgi and Prince, 2005; Luckow et al., 2010). Finally, the analysis provided here assumes current estimates of crop growth and conversion; future advances in crop and conversion technology could improve the prospects for bioethanol from each of the crops (Edmonds et al., 1996; NRC, 2011), and future climate change can also affect the growth of each crop and its consequent bioethanol yield in different ways.
The prospect of producing bioethanol, particularly from high-yield energy grasses, has motivated both a broad set of studies of biofuel’s role in addressing climate change as well as regulations to encourage their use. That prospect is better informed by estimates of the potential bioethanol yield from the energy crops being envisioned—the objective of this study—than by estimates of biomass yield. This study examines the potential bioethanol yield of corn and three energy crops (Miscanthus, Alamo, and Cave-in-Rock switchgrass) in the Central and Eastern United States. To accomplish this, a state-of-the-art crop growth model is used to estimate the biomass yield for the period 1980–2019, which is then coupled with estimates of crop-to-bioethanol conversion efficiency from recent practice and bioethanol plant design to find the following key conclusions: Each of crop considered has regions where that crop has the highest potential bioethanol yield which is mapped in Figure 3. The high-bioethanol yield regions, particularly in the southern and eastern States of the Midwest, quantified in this study tend to be where corn is currently grown well. The two energy crops cannot grow in the western parts of the Great Plains due to extremely low precipitation and poor soil texture, and in the upper part of the Midwest, north central, northeastern, and northern New England due to extreme cold conditions (Figure 2). In other regions of the study area, the bioenergy crop yields are in between the high-yielding and zero-yielding yield values. Although most bioenergy crops have the maximum potential bioethanol yields across the Midwest region, their harvest areas for high-bioethanol yields are limited, resulting in lower bioethanol yields than corn in the region. A choice to move towards energy crops (as opposed to corn alone) would likely be motivated by a balance of other factors, including economics, life-cycle emissions, competition with food production, and land use, water and climate extremes, N runoff, and the pace of crop and technology improvement into the future. We find that growing bioenergy crops improve the water quality by reducing N leaching but exacerbate water stress by reducing runoff (Figure 5). In addition, bioenergy grasses maintain stably high productivity under drought and heatwaves in the year 2012 over the Midwest. Estimating other factors is beyond the scope of this study, but their estimates would, nevertheless, be partly dependent on potential bioethanol yield.
The original contributions presented in the study are included in the article/Supplementary Material, further inquiries can be directed to the corresponding author.
Conceptualization: AJ, HK, YS, and T-SL; method development: AJ, T-SL, and YS; formal analysis: AJ, YS, and T-SL; writing/review/editing: AJ, HK, YS, T-SL, and CV; framework data and IT support: T-SL and YS; project administration: AJ; student/post-doctoral mentoring: AJ, HK, and CV. All authors have read and agreed to the published version of the manuscript.
This research was supported by the U.S. National Science Foundation’s Innovations at the Nexus of Food, Energy and Water Systems Program (INFEWS/T1 Grant #1856012).
The authors declare that the research was conducted in the absence of any commercial or financial relationships that could be construed as a potential conflict of interest.
All claims expressed in this article are solely those of the authors and do not necessarily represent those of their affiliated organizations, or those of the publisher, the editors and the reviewers. Any product that may be evaluated in this article, or claim that may be made by its manufacturer, is not guaranteed or endorsed by the publisher.
The Supplementary Material for this article can be found online at: https://www.frontiersin.org/articles/10.3389/fenrg.2023.1070186/full#supplementary-material
Barman, R., Jain, A. K., and Liang, M. (2014a). Climate-driven uncertainties in modeling terrestrial energy and water fluxes: A site-level to global-scale analysis. Glob. Change Biol. 20, 1885–1900. doi:10.1111/gcb.12473
Barman, R., Jain, A. K., and Liang, M. (2014b). Climate-driven uncertainties in modeling terrestrial gross primary production: A site level to global-scale analysis. Glob. Change Biol. 20, 1394–1411. doi:10.1111/gcb.12474
Behrman, K. D., Kiniry, J. R., Winchell, M., Juenger, T. E., and Keitt, T. H. (2013). Spatial forecasting of switchgrass productivity under current and future climate change scenarios. Ecol. Appl. 23 (1), 73–85. doi:10.1890/12-0436.1
Brown, T. R., Brown, R. C., and Estes, V. (2015). Commercial-scale production of lignocellulosic biofuels. Chem. Eng. Prog. 111, 62–64.
Cadoux, S., Riche, A. B., Yates, N. E., and Machet, J.-M. (2012). Nutrient requirements of miscanthus X giganteus: Conclusions from a review of published studies. Biomass Bioenergy 38, 14–22. doi:10.1016/j.biombioe.2011.01.015
Casler, M. D. (2012). “Switchgrass breeding, genetics, and genomics,” in switchgrass, green energy and technology. Editor A. Monti (London: Springer).
Chum, H., Faaij, A., Moreira, J., Berndes, G., Dhamija, P., Dong, H., Gabrielle, B., Goss Eng, A., Lucht, W., Mapako, M., et al. (2011). in IPCC special report on renewable energy sources and climate change mitigation. O. Edenhofer, R. Pichs-Madruga, Y. Sokona, K. Seyboth, P. Matschoss, S. Kadneret al. et al. (Cambridge UK and New York, NY, USA: Cambridge University Press).
Dohleman, F. G., and Long, S. P. (2009). More productive than maize in the Midwest: How does miscanthus do it? Plant Physiol. 150 (4), 2104–2115. doi:10.1104/pp.109.139162
Edmonds, J. A., Wise, M. A., Sands, R. D., Brown, R. A., and Kheshgi, H. (1996). Agriculture, land use, and commercial biomass energy. Richland, WA, United States: Pacific Northwest National Lab. doi:10.2172/245553
Edwards, R., Hass, H., Larive, J. F., Lonza, L., Mass, H., and Rickeard, D. (2014). Well-to-wheels report version 4. A JEC well-to-wheels analysis. Luxembourg: Publications office of the European Union.
EIA (2015). Corn ethanol yields continue to improve. Available at: http://www.eia.gov/todayinene-rgy/detail.cfm?id=21212 (Accessed MAY 13, 2015).
EISA (2007). Energy independence and security Act of 2007. Available at: https://www.govinfo.gov/content/pkg/BILLS-110hr6enr/pdf/BILLS-110hr6enr.pdf.
Elliott, J., Glotter, M., Ruane, A. C., Boote, K. J., Hatfield, J. L., Jones, J. W., et al. (2018). Characterizing agricultural impacts of recent large-scale US droughts and changing technology and management. Agric. Syst. 159, 275–281. doi:10.1016/j.agsy.2017.07.012
EPA (2010). Renewable fuels standard 2 (RFS2) regulatory impact statement. D.C., United States: United states environmental protection agency. EPA-420-R-10-006.
EPA (2022). Renewable Identification Number (RIN) generation and renewable fuel volume production by fuel type from August 2022. Washington, DC: U.S. Environmental Protection Agency.
Gahlot, S., Lin, T., Jain, A. K., Roy, S. B., Sehgal, V. K., and Dhakar, R. (2020). Impact of environmental changes and land management practices on wheat production in India. Earth Syst. Dyn. 11 (3), 641–652. doi:10.5194/esd-11-641-2020
Heaton, E. A., Dohleman, F. G., and Long, S. P. (2008). Meeting us biofuel goals with less land: The potential of Miscanthus. Glob. Change Biol. 14 (9), 2000–2014. doi:10.1111/j.1365-2486.2008.01662.x
Hickman, G. C., Vanloocke, A., Dohleman, F. G., and Bernacchi, C. J. (2010). A comparison of canopy evapotranspiration for maize and two perennial grasses identified as potential bioenergy crops. GCB Bioenergy. doi:10.1111/j.1757-1707.2010.01050.x
Hoque, M., Artz, G., and Hart, C. (2014). Estimated cost of establishment and production of Miscanthus in Iowa. United States: Lowa State University.
Humbird, D., Davis, R., Tao, L., Kinchin, C., Hsu, D., Aden, A., et al. (2011). Process design and economics for biochemical conversion of lignocellulosic biomass to ethanol. Golden, Colorado: National Renewable Energy Laboratory. NREL/TP-5100-47764.
Jager, H. I., Baskaran, L. M., Brandt, C. C., Davis, E. B., Gunderson, C. A., and Wullschleger, S. D. (2010). Empirical geographic modeling of switchgrass yields in the United States. GCB Bioenergy 2 (5), 248–257. doi:10.1111/j.1757-1707.2010.01059.x
Jain, A. K., Khanna, M., Erickson, M., and Huang, H. (2010). An integrated biogeochemical and economic analysis of bioenergy crops in the Midwestern United States. GCB Bioenergy 2 (5), 217–234. doi:10.1111/j.1757-1707.2010.01041.x
Jain, A., Yang, X., Kheshgi, H., McGuire, A. D., Post, W., and Kicklighter, D. (2009). Nitrogen attenuation of terrestrial carbon cycle response to global environmental factors. Glob. Biogeochem. Cycles 23 (4). doi:10.1029/2009gb003519
Jin, V. L., Baker, J. M., Johnson, J. M.-F., Karlen, D. L., Lehman, R. M., Osborne, S. L., et al. (2014). Soil greenhouse gas emissions in response to corn stover removal and tillage management across the US corn belt. BioEnergy Res. 7 (2), 517–527. doi:10.1007/s12155-014-9421-0
Kheshgi, H. S., and Prince, R. C. (2005). Sequestration of fermentation CO2 from ethanol production. Energy 30 (10), 1865–1871. doi:10.1016/j.energy.2004.11.004
Lin, T.-S., Song, Y., Lawrence, P., Kheshgi, H. S., and Jain, A. K. (2021). Worldwide maize and soybean yield response to environmental and management factors over the 20th and 21st centuries. J. Geophys. Res. Biogeosciences 126 (11), e2021JG006304. doi:10.1029/2021JG006304
Luckow, P., Wise, M. A., Dooley, J. J., and Kim, S. H. (2010). Large-scale utilization of biomass energy and carbon dioxide capture and storage in the transport and electricity sectors under stringent CO2 Concentration Limit scenarios. Int. J. Greenh. Gas Control 4 (5), 865–877. doi:10.1016/j.ijggc.2010.06.002
McIsaac, G. F., David, M. B., and Mitchell, C. A. (2010). Miscanthus and Switchgrass production in central Illinois: Impacts on Hydrology and inorganic nitrogen leaching. J. Environ. Qual. 39 (5), 1790–1799. doi:10.2134/jeq2009.0497
Melillo, J. M., Reilly, J. M., Kicklighter, D. W., Gurgel, A. C., Cronin, T. W., Paltsev, S., et al. (2009). Indirect emissions from biofuels: How important? Science 326 (5958), 1397–1399. doi:10.1126/science.1180251
Miguez, F. E., Maughan, M., Bollero, G. A., and Long, S. P. (2011). Modeling spatial and dynamic variation in growth, yield, and yield stability of the bioenergy crops miscanthus × giganteus and panicum virgatum across the conterminous United States. GCB Bioenergy 4 (5), 509–520. doi:10.1111/j.1757-1707.2011.01150.x
Mitchell, R., Vogel, K. P., and Uden, D. R. (2012). The feasibility of switchgrass for biofuel production. Biofuels 3 (1), 47–59. doi:10.4155/bfs.11.153
Myers, D. B., Kitchen, N. R., and Sudduth, K. A. (2012). “Issues in analysis of soillandscape effects in a large regional yield map collection,” in International conference on precision agriculture, indianapolis (Monticello, IL: Int. Soc. Prec. Agric.), 16.
NRC (National Research Council) (2011). Renewable fuel standard: Potential economic and environmental effects of U. S. Biofuel policy. Washington, DC: National Academies Press.
NRCS (2016). Swordgrass (miscanthus floridulus), invasive species fact sheet. Available at: http://www.nrcs.usda.gov/Internet/FSE_DOCUMENTS/nrcs142p2_036998.pdf.
Ogle, D., and Davidson, J. (2016). Switchgrass for the intermountain west. Available at: http://www.nrcs.usda.gov/Internet/Fse_Plantmaterials/publications/idpmstn8312.pdf.
RFA(2022). Ethanol industry outlook zeroes in on New opportunities. Washington: Renewable Fuels Association.
Searchinger, T., Edwards, R., Mulligan, D., Heimlich, R., and Plevin, R. (2015). Do biofuel policies seek to cut emissions by cutting food? Science 347 (6229), 1420–1422. doi:10.1126/science.1261221
Shangguan, W., Dai, Y., Duan, Q., Liu, B., and Yuan, H. (2014). A global soil data set for Earth system modeling. J. Adv. Model. Earth Syst. 6, 249–263. doi:10.1002/2013MS000293
Smith, C. M., David, M. B., Mitchell, C. A., Masters, M. D., Anderson-Teixeira, K. J., Bernacchi, C. J., et al. (2013). Reduced nitrogen losses after conversion of row crop agriculture to perennial biofuel crops. J. Environ. Qual. 42 (1), 219–228. doi:10.2134/jeq2012.0210
Song, Y., Cervarich, M., Jain, A. K., Kheshgi, H. S., Landuyt, W., and Cai, X. (2016). The interplay between bioenergy grass production and water resources in the United States of America. Environ. Sci. Technol. 50 (6), 3010–3019. doi:10.1021/acs.est.5b05239
Song, Y., Jain, A. K., Landuyt, W., Kheshgi, H. S., and Khanna, M. (2015). Estimates of biomass yield for perennial bioenergy grasses in the USA. Bioenergy Res. 8 (2), 688–715. doi:10.1007/s12155-014-9546-1
Song, Y., Jain, A. K., and McIsaac, G. F. (2013). Implementation of dynamic crop growth processes into a land surface model: Evaluation of energy, water and carbon fluxes under corn and soybean rotation. Biogeosciences 10 (12), 8039–8066. doi:10.5194/bg-10-8039-2013
Song, Y. (2015). The potential implications of bioenergy crop production for water and energy balance and carbon and nitrogen dynamics in the United States. PhD Thesis. Urbana, IL, USA: University of Illinois at Urbana-Champaign.
Thomson, A. M., Izarrualde, R. C., West, T. O., Parrish, D. J., Tyler, D. D., and Williams, J. R. (2009). Simulation potential switchgrass production in the United States. Richland, WA: Pacific Northwest National Laboratory. PNNL-19072.
USDA (2016). Planting and managing giant miscanthus (miscanthus x giganteus) in Missouri for the biomass crop assistance Program (BCAP). Available at: http://www.nrcs.usda.gov/Internet/Fse_documents/stelprdb1045274.pdf.
Usda-Ers, (2021). Datasets: U.S. Fertilizer use and price. Available at: http://www.ers.usda.gov/data-products/fertilizer-use-and-price.aspx.
VanLoocke, A., Twine, T. E., Zeri, M., and Bernacchi, C. J. (2012). A regional comparison of water use efficiency for miscanthus, switchgrass and maize. Agric. For. Meteorology 164, 82–95. doi:10.1016/j.agrformet.2012.05.016
Vörösmarty, C. J., Melillo, J. M., Wuebbles, D. J., Jain, A. K., Ando, A. W., Chen, M., et al. (2022). The C-FEWS framework: Supporting studies of climate-induced extremes on food, energy, and water systems at the regional scale. Front. Environ. Sci. 11. (in review). doi:10.3389/fenvs.2023.1069613
Wang, M., Han, J., Dunn, J., Cai, H., and Elgowainy, A. (2015). Well-to-Wheels energy use and greenhouse gas emissions of ethanol from corn, sugarcane, and cellulosic biomass for US use. Effic. Sustain. Biofuel Prod. 2015, 249–279. doi:10.1201/b18466-13
Xia, Y., Mitchell, K., Ek, M., Sheffield, J., Cosgrove, B., Wood, E., et al. (2012). Continental-scale water and energy flux analysis and validation for the north American land data assimilation system project phase 2 (NLDAS-2): 1. Intercomparison and application of model products. J. Geophys. Res. Atmos. 117 (D3). doi:10.1029/2011JD016048
Yang, X., Wittig, V., Jain, A. K., and Post, W. (2009). Integration of nitrogen cycle dynamics into the Integrated Science Assessment Model for the study of terrestrial ecosystem responses to global change. Glob. Biogeochem. Cycles 23 (4), 1–18. doi:10.1029/2009GB003474
We compute a
where Y is any assessment model output variable, the subscript cd is the climate drought year, b2 and a2 are the 2-year before and after values. This yields the climate extreme effect.
Keywords: bioenergy grasses, ethanol, bioethanol, corn, switchgrass, Miscanthus, ISAM
Citation: Lin T-S, Kheshgi HS, Song Y, Vörösmarty CJ and Jain AK (2023) Which crop has the highest bioethanol yield in the United States?. Front. Energy Res. 11:1070186. doi: 10.3389/fenrg.2023.1070186
Received: 17 October 2022; Accepted: 07 February 2023;
Published: 24 February 2023.
Edited by:
Junye Wang, Athabasca University, CanadaReviewed by:
Silvana Bonifacino, University of the Republic, UruguayCopyright © 2023 Lin, Kheshgi, Song, Vörösmarty and Jain. This is an open-access article distributed under the terms of the Creative Commons Attribution License (CC BY). The use, distribution or reproduction in other forums is permitted, provided the original author(s) and the copyright owner(s) are credited and that the original publication in this journal is cited, in accordance with accepted academic practice. No use, distribution or reproduction is permitted which does not comply with these terms.
*Correspondence: Atul K. Jain, amFpbjFAaWxsaW5vaXMuZWR1
Disclaimer: All claims expressed in this article are solely those of the authors and do not necessarily represent those of their affiliated organizations, or those of the publisher, the editors and the reviewers. Any product that may be evaluated in this article or claim that may be made by its manufacturer is not guaranteed or endorsed by the publisher.
Research integrity at Frontiers
Learn more about the work of our research integrity team to safeguard the quality of each article we publish.