 Chenghu Zhang
 Dezhi Zou
 Xinpeng Huang
 Yaling Wu1
- 1Harbin Institute of Technology, Harbin, Heilongjiang Province, China
- 2Inner Mongolia University of Technology, Hohhot, Inner MongoliaAutonomous Region, China
Agriculture is the main industry in northeast China. As an important part of facility agriculture, agricultural greenhouses are playing a more and more important role. Due to geographical location, Northeast China is cold in winter, and the solar radiation energy is less, therefore, the large-span greenhouses commonly used in northeast China are prone to uneven temperature and insufficient heating. In this paper, in order to solve the phenomenon of uneven air flow field, humidity field and temperature field in greenhouse, based on AIRPAK simulation, four kinds of hot air heating return air modes, such as upper air supply and lower air return mode, lower air supply and upper air return mode, two-side air supply mode and left air supply and right air return mode, we explored the influence of temperature field, humidity field and air flow field in greenhouse. The results showed that the heat load of the greenhouse in winter is 161.51 kW, using two-side air supply mode is the best way. The air supply wind speed is 1.6 m/s, and the return wind speed is 3.1 m/s. The environment of the greenhouse can be maintained at about 15°C day and night, and the relative humidity is relatively uniform. In the crop growing area, the wind speed is between 0 m/s and 0.25 m/s. According to this research, suitable crops can be selected for reasonable planting and distribution in the greenhouse to maximize productivity.
1 Introduction
In recent years, climate change, environmental damage, urbanization, desertification, deforestation, salinization and other problems caused by human activities have further aggravated the problems of agricultural productivity and food security. Countries such as the Netherlands, Israel and Japan are actively looking for ways to develop advanced greenhouses (Jensen and Malter, 1995; Yang and Rhee, 2013). By controlling parameters such as temperature (Campen et al., 2003), relative humidity (Cossu et al., 2014), and carbon dioxide concentration (Ioslovich et al., 1995), the environment in the greenhouse is close to the optimal growth conditions of greenhouse plants (Attar et al., 2014). On the other hand, energy delivery is the key to the efficient operation of modern greenhouses. Hassanien et al. (2016) investigated greenhouses in different countries and showed that the annual energy consumption per unit greenhouse area ranged from 0.1 to 528 kW h·m−2yr−1. As greenhouses grown in scale, this energy-intensive consumption posed challenges and raised widespread concerns about the environmental impact. Because the vast majority of modern greenhouses rely on burning fossil fuels and using electricity, among them, it mainly relies on traditional energy combustion (Rahman et al., 2014; Kuang et al., 2016), and 90% of CO2 emissions come from fossil fuels, which strengthens global warming and environmental degradation.
In China, greenhouses have developed rapidly in the past 30 years due to the strong demand for winter agricultural products, especially vegetables, in northern China. There are greenhouses in every province of our country, Shandong, Liaoning, Hebei and other northern provinces are the provinces with the largest area of greenhouses, which are mainly solar greenhouses in China. Chinese solar greenhouse is a unique type of greenhouse in north China, it absorbs and releases solar energy through the north wall, which has certain advantages in winter production. However, the northern wall of a traditional Chinese greenhouse does not store enough heat. As a result, most solar greenhouses in China need to be reheated in other ways. It is very important to maximize the use of heat and make the temperature and humidity field in the greenhouse reach the conditions most suitable for plant growth (Kurata et al., 1991; Van Henten et al., 2012; Wang et al., 2017).
Based on foreign high-speed development and maturity of mechanization of agricultural production, a series of greenhouse technologies used to control indoor flow field have been applied in production and life, among them, the passive greenhouse studies focused on: in most of the new type of retaining structure of the experiment, researchers have combined materials with high heat storage capacity, such as sand, concrete and phase change materials, with the north wall of the greenhouse (Ahamed et al., 2019). Ghasemi Mobtaker et al. (2016) replaced the north wall with concrete bricks in different greenhouses in Iran. The comparative experimental results show that using bricks as the north wall can reduce the energy consumption by 13.4%. Nayak and Tiwari (Nayak and Tiwari, 2008) combined the north wall of the greenhouse with photovoltaic panels to store solar energy and achieved an annual energy saving of 14.92 kW h·m-2. Berroug et al. (2011) filled the north wall of the greenhouse with CaCl2.6H2O, and the study showed that the new enclosure structure could increase the indoor temperature of the greenhouse at night by 6°C–12°C in winter. Bouadila et al. (2014) conducted a comparative experiment in Tunisia, and the experimental results show that the solar air heater can increase the night temperature of the greenhouse about 5°C after using the phase change material.
Ayad Saberian Saberian and Sajadiye. (2019) developed computational fluid dynamic models of a full scaled gable greenhouse covered by semi-transparent materials for predicting the dynamics of its microclimate during a day as well as a year were developed. The results show that natural ventilation assisted by fan in greenhouse has a good application prospect.
The shape and orientation of the greenhouse are selected by solar radiation requirements which could maximize solar energy absorption in cold areas (Akrami et al., 2020). Sethi. (2009) showed that orientation can affect heating demand by up to 2% and the greenhouse with uneven span can obtain the maximum solar radiation heat. The importance of the shape of the greenhouse to the growth of crops in the greenhouse was emphasized. Sharma and Tiwari. (1999) analyzed the thermal performance of the greenhouse envelope under summer working conditions, and obtained the ideal calculation results by using the Runge-Kutta method. Mistriotis et al. (1997) used CFD simulation method to model greenhouses with different structures, combined with the calculation results of internal energy conservation of the greenhouse, to predict the ventilation effect of the greenhouse flow field. Lucas McCartney et al. (2018) explored the influence of a natural ventilation augmented cooling (NVAC) on the airflow field inside the greenhouse through experiments, and the study showed that the design could enhance the airflow velocity inside the greenhouse. Yan et al. (2021) optimized the structure of the plate heat exchanger in a greenhouse by using phase change materials, which can reduce gas consumption by 23.7%. Badia Ghernaout et al. (2020) simulated the air flow field and temperature field in the enclosed greenhouse through CFD, and concluded that the convection coefficient of the greenhouse roof has a great influence on the air flow field and temperature field in the greenhouse. The calculated results are consistent with the experimental results, which is helpful for farmers to build the greenhouse with the material and size suitable for the external conditions. Cruz Ernesto Aguilar-Rodriguez et al. (2020) showed that the electric heater used was not enough to obtain uniform temperature in the greenhouse through CFD simulation, and in order to achieve well-distributed thermal conditions, it was necessary to consider the direction and position of the heater. Congcong Kiln (Yao, 2017) set a ventilation mode of vertical wall-hanging jet and guide plate in the greenhouse, and conducted numerical simulation of the flow field in the greenhouse. The results showed that under this ventilation mode, the airflow distribution in the crop growing area was more uniform. Cui et al., (2022) concluded through CFD simulation that the position of the return air outlet in the greenhouse has a great influence on the heating effect. When the size ratio of the air outlet is similar, the number of air outlet has a small influence on the heating capacity of the greenhouse.
Dongdong Wei. (2022) found that under the action of sunlight, the temperature at the low wall side of the greenhouse in winter is the lowest, and the air at the low wall side flows to the center of the greenhouse, resulting in the production of low temperature air mass in the center of the greenhouse. Therefore, it is very important to create a thermal environment on the low wall side, which is analyzed in this paper. Zhao. (2021) found through the experimental study that the overall cooling and dehumidification uniformity of the side-air supply greenhouse was the best, and the cooling and dehumidification wind speed was moderate, which was suitable for the ventilation requirements of temperature-humidity sensitive crops, consistent with the simulation results in this paper. En Cai Bao et al. (2018) conducted numerical simulation and experimental analysis on the heat transfer performance of the back wall of an active heat storage greenhouse, and mainly compared the heat transfer effect of three ventilation forms on the back wall. The experimental and numerical simulation results show that the convective heat transfer at the top inlet and the top outlet is the strongest, and the convective heat transfer at the side inlet and the side outlet is the lowest.
The variation of solar radiation and the shape and orientation of the greenhouse all affect the heat load in the greenhouse. According to the research, the influence of these aspects cannot be ignored in optimizing the thermal environment of the greenhouse. At present, the research on the thermal environment in the greenhouse is mainly conducted by CFD simulation. The influence of the position distribution of the heater, the size of the air supply outlet, the influence of the air supply position on creating a comfortable greenhouse thermal environment was explored. The structural study of the greenhouse found that the low wall side of the greenhouse is prone to produce uneven air flow. At present, there are studies on the location and size of air supply outlets, but there are few studies on the overall airflow field, humidity field and temperature field of air supply and return schemes.
In this study, in order to solve the problem of excessive temperature gradient in greenhouse under conventional heating mode, the heating mode of full hot air is proposed according to the space size characteristics of greenhouse. Based on the dynamic load characteristics of the greenhouse under the action of heat insulation foundation and double layer film, the hot air heating system of the greenhouse was designed. In order to study the characteristics of the air flow field, temperature field and humidity field of the greenhouse in the form of hot air heating, based on the simulation software of AIRPAK, the numerical simulation modeling and mesh division of the greenhouse in the form of hot air heating were carried out. Finally, the characteristics of air flow field, temperature field and humidity field in greenhouse during daytime and night were investigated based on AIRPAK simulation for four hot air heating return modes, namely, upper air supply and lower air return, upper air supply and lower air return, two-side air supply and left air supply and right air return.
2 Methods
2.1 Collection of local climatic conditions
The greenhouse in this study is located in Harbin City, Heilongjiang Province, China, 126°55‘41″-128°19′17″E, 45°30‘37″-46°01′20″N. As one of the major agricultural provinces in China, Heilongjiang Province is located in the northeast of China. Its climatic conditions have an extremely important impact on agricultural production, and it belongs to the continental monsoon climate in the middle temperate zone. The climate is characterized by four distinct seasons. Winter in Harbin is cold, summer is hot, winter is short, and the solar radiation energy obtained by greenhouses is less. According to data, the average temperature in January, the coldest month, is minus 19°C. Local climate data of Harbin are called through software, as shown in Figure 1.

Figure 1. Hourly dry bulb temperature in Harbin area.
According to the meteorological data of this region, it can be seen that the coldest month in Harbin is January, so the subsequent thermal balance calculation is carried out with January as the reference. According to the data from due south direction of the greenhouse, the annual total solar radiation is 881.09 kW h/m2, and the total solar radiation in the time of the supercooling season (heating season) is 193.54 kW h/m2. The temperature trend of the coldest month is shown in Figure 2.
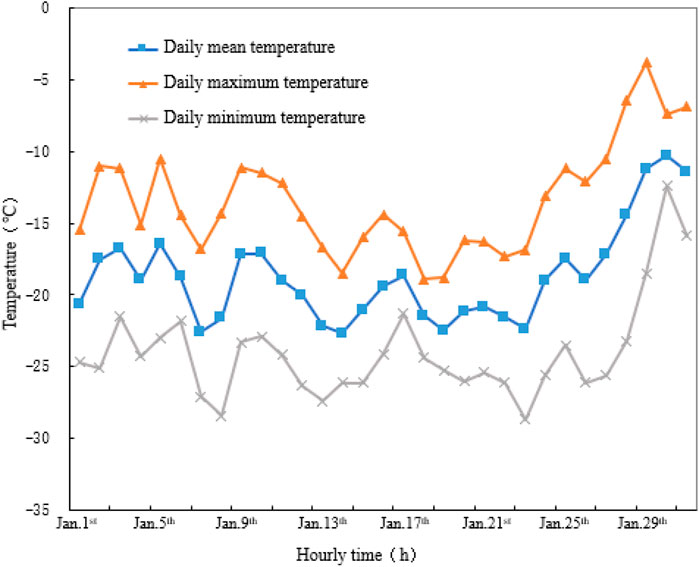
Figure 2. Temperature curve of the coldest month in Harbin.
2.2 Structural parameters and thermal parameters of the greenhouse
In this study, the length and width of the greenhouse are 54 m and 12 m, the height of the high side wall is 3.6 m, the length of the side arc is 12.3 m, the area of the high side exterior wall is 194.4 m2, the area of the ground exterior wall is 43.2 m2, and the area of the front exterior wall is 26.4 m2. The greenhouse is equipped with double layer plastic film and insulated foundation, which located in 126°55‘41″-128°19′17″east longitude and 45°30‘37″-46°01′20″north latitude. The greenhouse model designed is shown in Figure 3. The span and volume of the greenhouse is very large, and the moment frame of the greenhouse is not high. The greenhouse cannot use solar radiation energy to complete the overall thermal load demand in winter in Northeast China. Therefore, an active air return and exhaust system is set to force fluid circulation. On the one hand, the problem of insufficient heating can be improved, and the lack of heat load can be provided in winter. On the other hand, the airflow field in the greenhouse is more uniform, after using air to carry heat, the problem of the upper and lower temperature zones was improved so that the temperature in the corner area of the greenhouse was up to standard and the temperature of the inside of the greenhouse rose faster.
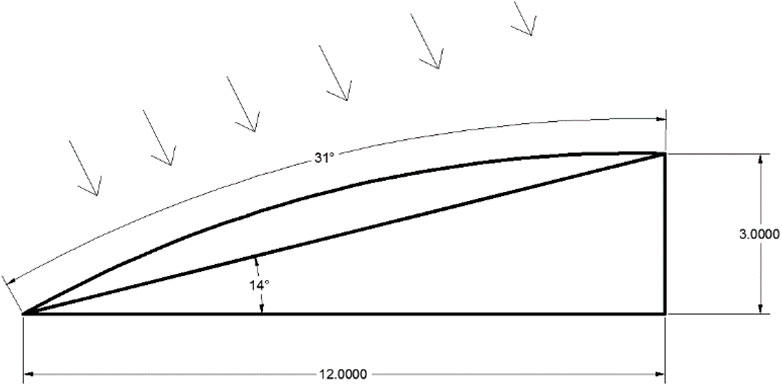
Figure 3. Sectional structure diagram of the side of the greenhouse.
Physical characteristic parameters of the envelope of the greenhouse are shown in Table 1.

Table 1. Thermal parameters of greenhouse design.
The load distribution of each part of the greenhouse envelope is shown in Table 2.
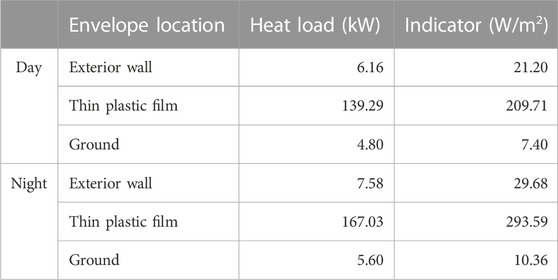
Table 2. Load distribution table of each envelope structure.
Numerical simulation was carried out to analyze the specific influence degree. Modeling software AIRPAK was used to build a three-dimensional model of the greenhouse to simulate indoor airflow distribution.
2.3 Air volume and tuyere design calculation
After calculation, the total design load of the greenhouse in the daytime is 161.51 kW, the design air supply temperature is 25°C, the design indoor temperature is 15°C; After calculation, the air supply volume is 47973 m3/h, and the single air supply volume is 1410 m3/h. Single tuyere supply wind speed is 1.5677 m/s, return wind speed is 3.134 m/s.
Single tuyere supply wind speed is 1.5677 m/s, return wind speed is 3.134 m/s; Two air blowers with power of 17 kW are selected, with single air volume of 23,986 m3/h. The summary is shown in Table 3.
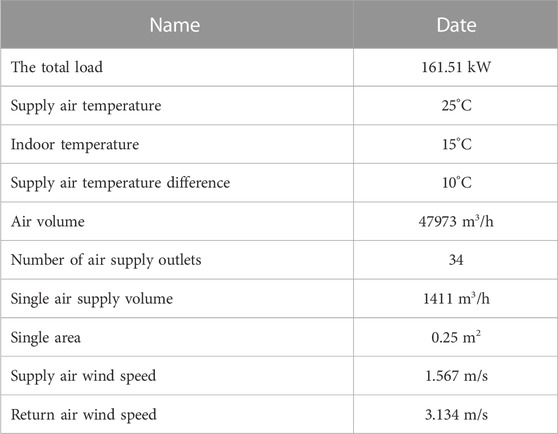
Table 3. Air supply design calculation.
2.4 Mathematical model
The three basic laws of physics, namely, the law of conservation of mass, the law of conservation of momentum, and the law of conservation of energy, are the laws governing the flow of all fluids. The air flow in the greenhouse should also follow the above three laws. Partial differential equations, which express the three fundamental laws, are the basis of our calculations and modeling.
Equation of continuity (energy conservation equation):
Where
Momentum conservation equation:
Where
Energy conservation equation:
Where
Component mass conservation equation
Where
The design number of tuyeres is three rows, the spacing of three rows of tuyere is 0.5 m, the lower exhaust outlet is 0.1 m from the ground.
Each air outlet is 17 m, a total of 51 m, a row of air outlets is set on the side of the low wall, a total of 17 m, each row of air outlets can undertake the task of air supply and air return in different plans. The area of a single air supply outlet is 500 mm × 500 mm, and the air outlet layout is shown in Figure 4 below.
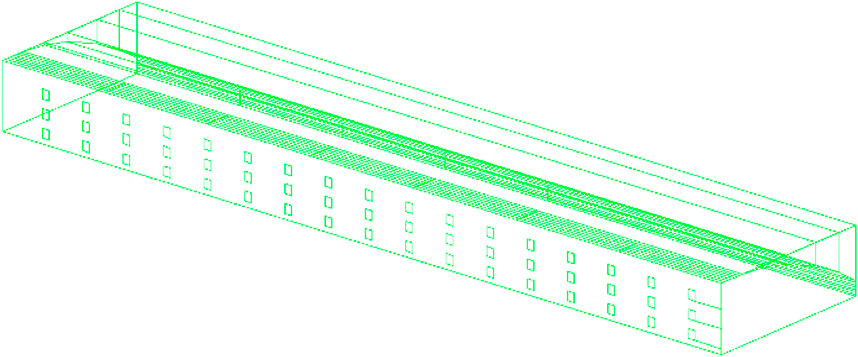
Figure 4. Schematic diagram of greenhouse tuyere layout.
2.5 Mathematical model
When numerical simulation is used, the generation of grids directly determines the speed and accuracy of the calculation, and the quality of grid quantity is the primary condition for the success of numerical simulation. We should try to avoid dividing the grid too close or too thin, and pay attention to reduce mesh distortion when dividing the grid. When the mesh is very fine, further increasing the number of grids has little effect on the numerical simulation results, and the numerical solution obtained at this time is called the grid independent solution. Therefore, before determining the number of grids, firstly, the grid independence is analyzed and discussed. The reliability of Airpak modeling results mainly depends on the accuracy of early modeling, which can be refined to the accuracy of modeling process, the errors formed in the discretization process and the setting of boundary conditions. After the completion of grid division, the accuracy of the grid needs to be checked, usually through the grid quality map to judge the quality of the grid. Generally speaking, if the result in the grid quality diagram is greater than 0.3, the quality can meet the modeling and solving requirements; if it is 0, the grid needs to be rechecked until the grid quality meets the requirements of the subsequent program. As can be seen from Figure 5, the determinant data of the greenhouse after grid division is around 1.0, and the grid quality is high, meeting the calculation requirements. This greenhouse covers a large area, but the structure is simple and regular, grid division is not complicated but has a large number of characteristics, finally, a total of 61,568 grid units and 66,255 computing units.
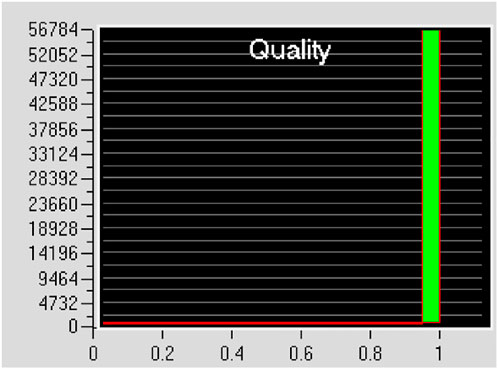
Figure 5. Grid quality map.
3 Results and discussion
3.1 Analysis of four plans
Plan 1 is the upper air supply and the lower air return mode. The specific layout scheme is to supply air in the upper two rows of air outlets on the side of the high wall and return air in the lowest row of air outlets of the high wall, The layout is shown in Figure 6A.
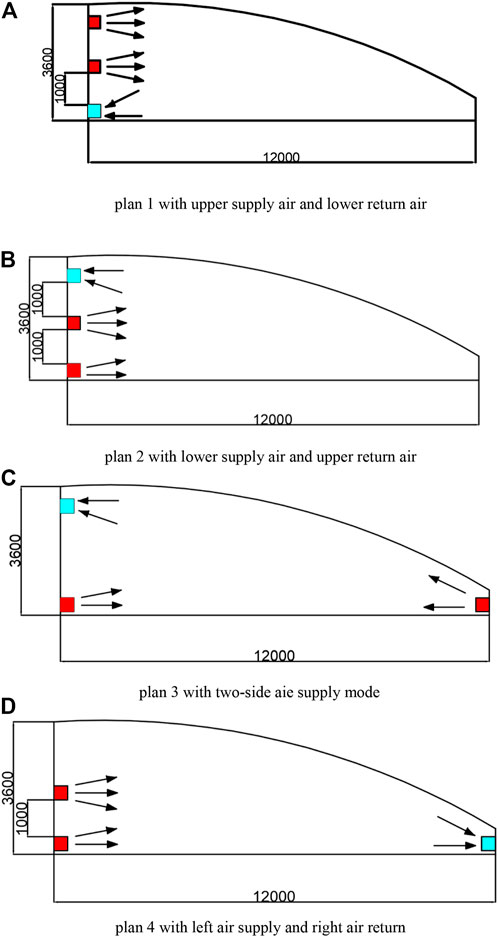
Figure 6. Tuyere layout.
Plan 2 is the lower air supply and upper air return mode. The specific layout scheme is to supply air at the lower two rows on the side of the high wall and return air at the top outlets of the high wall, The layout is shown in Figure 6B.
Plan 3 is a two-side air supply mode. The specific layout scheme is to supply air in the air outlets on the side of the low wall, and among the three rows of air outlets on the side of the high wall, the lowest air outlets supplies air, the top air outlets returns air, and the middle row of ourlets does not work, The layout is shown in Figure 6C.
Plan four is a left air supply and right air return mode. The specific layout scheme is to set a row of return air outlets on the side of the low wall, and supply air from the top and the lowest air outlets on the side of the high wall, while the middle row of air outlets does not work, The layout is shown in Figure 6D.
Figure 7 a-h shows the daytime and nighttime temperature distribution diagrams of the four plans, according to the upward flow characteristics of heat flow, we can know that hot air is easy to gather under the roof to increase the temperature. When upper supply air and lower return air mode is used, hot air itself flows upward, so hot air accumulates seriously under the roof, resulting in vertical imbalance (Figure 7A). The vertical imbalance is more serious at night, and the temperature is too high from the middle area to the roof area (Figure 7E), The temperature difference between the area near the film and the outside area is large, and the heat transfer in this part is strong, so the temperature in the area near the top lighting film is low and the influence range is small (Figures 7A–H). The greenhouse has a large span and a large distance between the left and right tuyeres. When the left supply and right return air plan is used, the greenhouse will have lateral imbalance and vertical imbalance. The temperature near the air supply outlet on the side of the high wall is high, and the temperature on the side of the low wall is low (Figure 7D). At night, the internal temperature and the temperature near the high wall increased greatly, which was obviously higher than the designed indoor temperature of 15°C and was not within the suitable growth range of crops, and the lateral temperature imbalance was more serious (Figure 7H). When the lower supply air and upper return air mode is used, the overall temperature is uniform, because of the large span of the greenhouse, the temperature at the side of the low wall is also low (Figure 7B). At night, the temperature on the side of the low wall is lower than it in the daytime, and cold air accumulates at the bottom of the greenhouse, resulting in a lower temperature in this area (Figure 7F). When the air supply on both sides mode is used, the overall temperature distribution inside the greenhouse is the most uniform (Figures 7C–G).
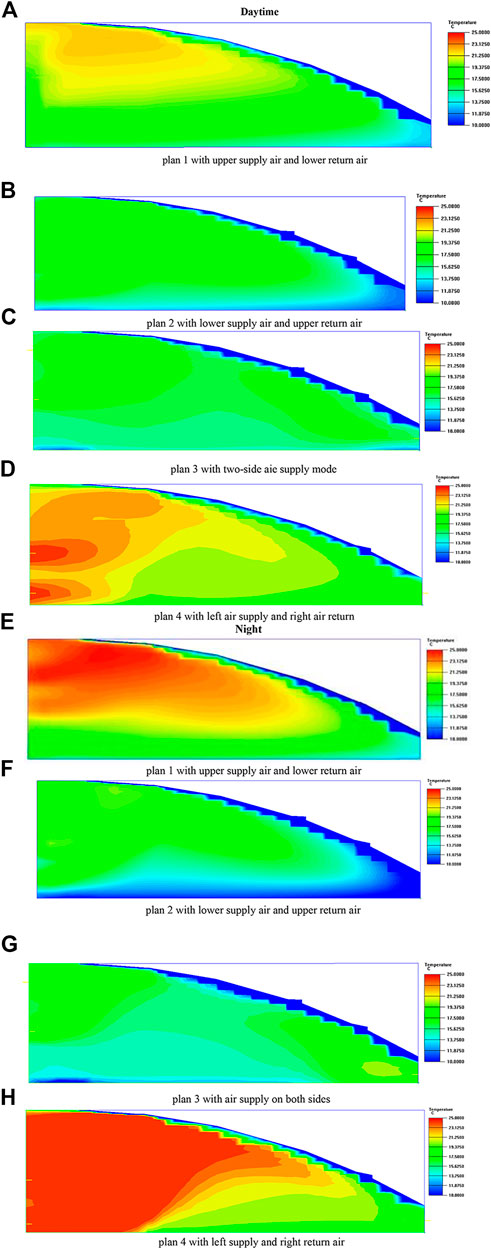
Figure 7. Temperature distribution diagram of typical longitudinal section.
When the upper supply air and lower return air mode is used, the overall distribution of relative humidity inside the greenhouse is uniform, and the relative humidity on the side of the low wall is slightly higher (Figure 8A). At night, the relative humidity on the side of the low wall is slightly higher than it in the daytime (Figure 8E).
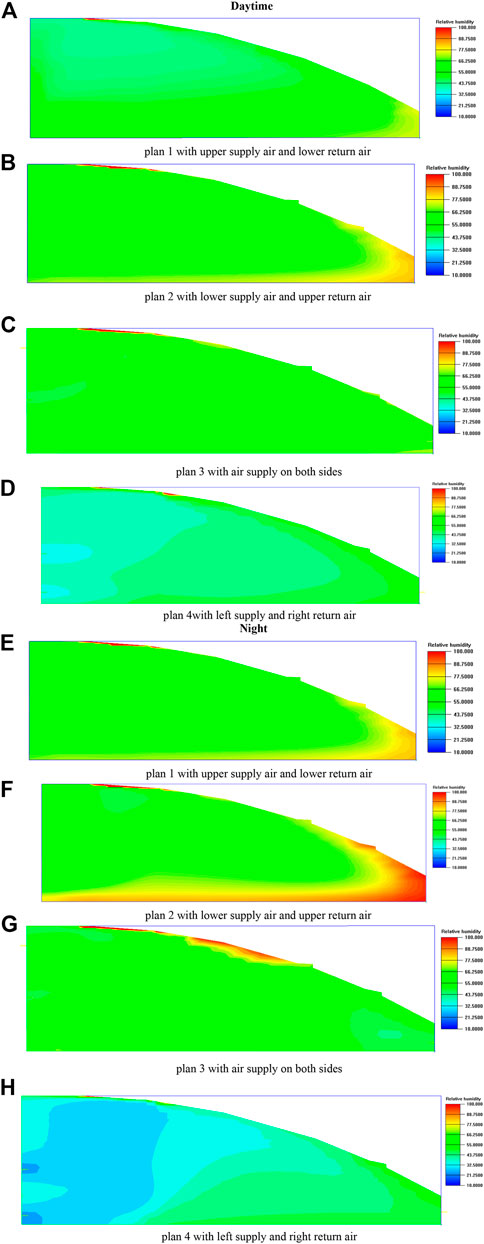
Figure 8. Relative humidity distribution diagram of typical longitudinal section.
The greenhouse has a large span, and the distance between the left and right tuyeres is very large. When left supply and right return air mode is used, the lateral relative humidity distribution of the greenhouse is uneven, the relative humidity near the air supply outlet on the high wall side is low, and the humidity on the low wall side is high (Figure 8D).
At night, the relative humidity on the side near the high wall is greatly decreased, the relative humidity at the film lighting surface is very high, and the overall relative humidity in the greenhouse is decreased and uneven. According to the above analysis, the distribution of relative humidity field in this air supply mode is not good (Figure 8H).
When the lower supply air and upper return air mode is used, the overall relative humidity is uniform, relative humidity on the side of the low wall is also high (Figure 8B). At night, low relative humidity is significantly higher than it in the daytime, and the relative humidity is higher near the ground (Figure 8F).
When the upper supply air and lower return air scheme or the air supply on both sides scheme is used, the overall relative humidity in the greenhouse is uniformly distributed (Figures 8A–G).
Figures 9A–H shows the daytime and nighttime velocity distribution diagrams of the four plans, all the above four schemes have high airflow speed near the tuyere. Due to the large span of the greenhouse, the airflow velocity distribution between the high wall and the low wall cannot be uniform in the width direction.
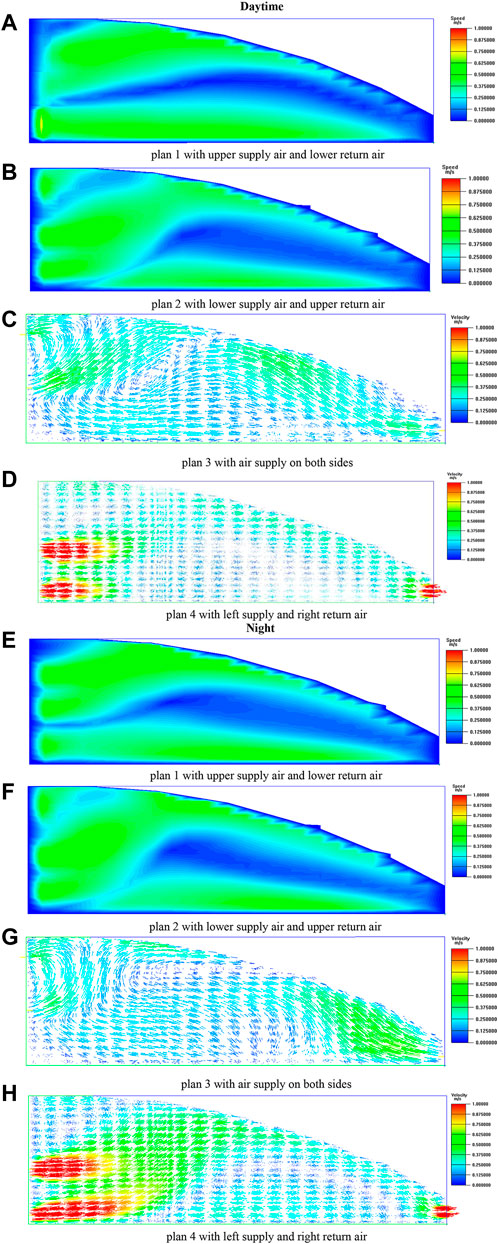
Figure 9. Velocity distribution diagram of typical longitudinal section.
When the upper supply air and lower return air scheme is used, airflow velocity stratification appears in the vertical direction of the greenhouse, and the airflow velocity is lower in the middle of the greenhouse. Due to the large span of the greenhouse and the return tuyents located on the side of the high wall, the airflow velocity on the side of the low wall is lower (Figure 9A). At night, the overall airflow velocity drops slightly, and the overall airflow distribution is not much different from that in the daytime (Figure 9E).
When the lower supply air and upper return air scheme is used, the airflow velocity on the side of the low wall is still low, and the overall flow velocity at the lower part of the greenhouse is less than it in scheme 1, which is good for crop growth (Figure 9B). At night, the overall airflow velocity drops slightly, and the overall airflow distribution is not much different from it in the daytime (Figure 9F).
When the air supply on both sides scheme is used, In the growth area of crops, the airflow velocity within 1 m vertical height is more slow, which is suitable for the growth environment of most crops. But an air supply outlet is set on the side of the low wall, and the nearby wind speed is too high to plant crops. On the whole, the air velocity near the tuyere of the low wall and the roof is relatively high, and the wind speed in the crop growth area is gentle (Figure 9C). At night, the airflow velocity on the side of the low wall is slightly increased compared with it in the daytime (Figure 9G).
When the left supply and right return air scheme is used, compared with the above three schemes, the airflow field is uneven, and because an air supply outlet is set on the side of the low wall, the nearby wind speed is too high to plant crops (Figure 9D). At night, the phenomenon of uneven airflow velocity is more serious (Figure 9H).
Combined with the above analysis, the upper air supply and lower air return mode can keep the room temperature in the greenhouse at a temperature suitable for the growth of crops at night, and the humidity is too high on the side of the low wall, but it does not affect the growth of crops, but the wind speed in the growing area of crops is too high. Combined with the simulation results of day and night, the upper air supply and lower air return mode can make the crops in the shed grow at the appropriate temperature, but the wind speed is too high for growth, so it is necessary to reduce the air supply volume at night.
The two-side air supply mode can make the crops in the shed grow at the appropriate temperature, the wind speed is gentle and suitable for growth, and the humidity is uniform.
Compared with the air supply mode of upper air supply and lower air return mode, lower air supply and upper air return mode and two-side air supply mode, the temperature field is uneven, the width of the humidity field is unbalanced, and the average wind speed of the airflow field is higher at night.
Combined with the above simulation figures, it can be seen that the temperature field and humidity field of the left air supply and right air return mode are unbalanced in the width direction at night, and the wind speed field is unevenly distributed. In the four plans, the air supply mode of left air supply and right air return mode is the most unsuitable for the indoor crop growth environment of the greenhouse. Table 4.
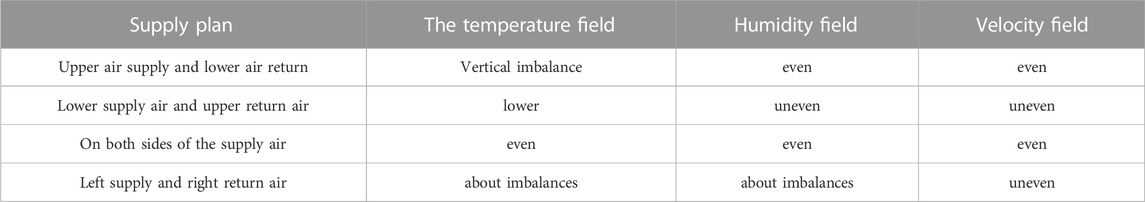
Table 4. Load distribution table of each envelope at night.
According to the simulation results and comparison of the four simulation methods, it can be seen that the two sides of the air supply mode is better, that is, a row of air supply outlets are set on the side of the low wall, two rows of air outlets are set on the side of the high wall, the lower row of air supply, and the top row of air return. There are a total of 17 air outlets in each row. The upper and lower air outlets are 1 m apart, and the lower air outlet is 0.1 m away from the ground. It can keep the indoor temperature field uniform and in the suitable temperature range for crop growth, humidity field and air flow field uniform.
3.2 Vertical plan comparison
After the comparison of the simulation results of four different air supply modes, it is concluded that the air supply mode on both sides has a better comprehensive influence on the temperature field, air flow field and humidity field inside the greenhouse. Therefore, the vertical temperature distribution in the greenhouse field under the air supply mode on both sides is refined and the temperature influence on the height is analyzed.
Figures 10A–E shows temperature distribution diagram of different height at daytime. In terms of height, 0.5 m was taken as a step length, and the indoor daytime cross-section temperature distribution maps of greenhouses at the heights of 0.5 m, 1 m, 1.5 m, 2 m, 2.5 m and 3 m were intercepted respectively. It can be seen from Figures 10A–E that the temperature at 1 m is between 13.750°C and 17.500°C, and the average temperature is about 15°C, which is in line with the indoor design temperature and is more suitable for the growth of crops. At 1.5 m–3 m, the temperature stratification is not obvious, and the temperature remains between 15.625°C and 19.375°C. The heat flow rises, forming a certain aggregation and increasing the temperature to some extent.
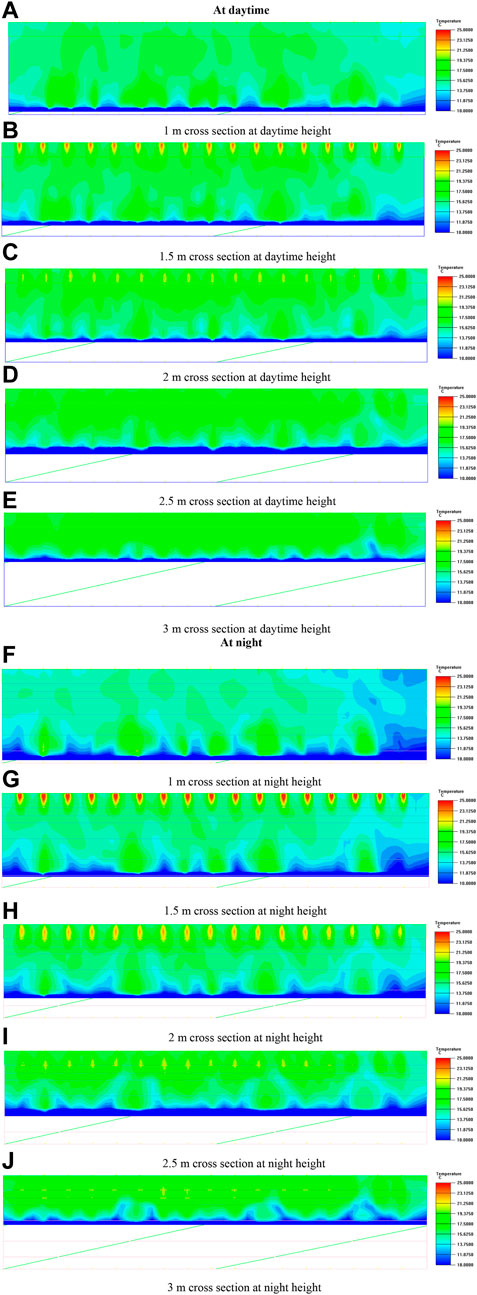
Figure 10. Temperature distribution diagram.
Figures 10F–J shows temperature distribution diagram of different height at night. Just as in the daytime, the temperature distribution diagrams of the horizontal profiles at 0.5, 1, 1.5, 2, 2.5 and 3 m in the vertical direction of the greenhouse at night were intercepted. As can be seen from Figures 10F–J, compared with the daytime, the overall temperature of the greenhouse at night is somewhat lower, ranging from 13.750°C to 15.625°C at a distance of 1 m, but still within the suitable growth temperature range of crops. At a distance of 1.5 m–3 m, the temperature stratification is not obvious, and the average temperature is about 15°C.
According to the research results of this paper, the temperature field at the side of the low wall is prone to misalignment and cannot reach the preset temperature, which is consistent with the research results of Dongdong Wei. (2022) When the greenhouse is under the action of sunlight in winter, the temperature at the side of the low wall is the lowest. According to the research of Rongsheng Zhao. (2021), two-side air supply mode can achieve a good initial effect, and two-side air supply mode used in this paper also achieved a good dehumidification effect for the interior of the greenhouse. On the basis of the above research, the influence of different air supply modes on the air flow field, humidity field and temperature field inside the greenhouse was further explored, and the most suitable supply and return air plan for the greenhouse with large span and cold area was selected.
According to this research, it is helpful for people to choose crops and rationally plan the planting area of different crops in the greenhouse. The research results can be combined with different heating methods for greenhouse heating.
4 Conclusion
In this paper, a greenhouse in northeast China is studied. Airpak software was used for numerical simulation and the standard k-ε bipartitic equation model was used for solving the problem. By comparing temperature field, humidity field and air flow field in the greenhouse under the four schemes, and we obtained the air supply and return scheme suitable for the greenhouse with large space span Draw the following conclusions.
1. The vertical temperature difference which is about 10°C of upper air supply and lower air return mode is larger at night, which is not conducive to plant growth.
2. The distribution of indoor humidity field and air flow field is not uniform under the mode of lower supply air and upper return air.
3. The air supply on two-side can keep the temperature field, humidity field and airflow field in the greenhouse within the range suitable for the growth of crops, and the distribution is uniform. The environment of greenhouse with two-side air supply model could maintained at about 15°C during the day and night, and the relative humidity is relatively uniform. In the growing area of crops, the air velocity is between 0 m/s and 0.25 m/s.
4. Left supply and right return mode is the worst in four plans, and it is not suitable for crop growth.
5. When the outdoor temperature changes, the indoor thermal environment can be adjusted by improving the air inlet temperature.
In this paper, a hot-air heating system of greenhouse was proposed by optimizing the return air scheme. In this study, only the simulation study of empty greenhouse is carried out, but the planting of crops in the greenhouse also have a certain impact on the greenhouse thermal environment and air flow, so crops could be taken into the simulation scope in the future (Wei, 2022). The solar radiation in winter will affect the thermal environment and airflow field in the greenhouse, so the choice of greenhouse orientation is very important for the establishment of the greenhouse thermal environment. Based on the research in this paper, it is of great significance for the future application of greenhouse to explore the role of greenhouse orientation in different air return schemes (Akrami et al., 2020).
Data availability statement
The original contributions presented in the study are included in the article/supplementary material, further inquiries can be directed to the corresponding authors.
Author contributions
Conceptualization, CZ; writing—original draft preparation, YW; writing—review and editing, XH; project administration, ChZ; funding acquisition, DeZ.
Funding
This research was funded by The National Natural Science Foundation of China, grant number 52168007 and 52076050.
Conflict of interest
The authors declare that the research was conducted in the absence of any commercial or financial relationships that could be construed as a potential conflict of interest.
Publisher’s note
All claims expressed in this article are solely those of the authors and do not necessarily represent those of their affiliated organizations, or those of the publisher, the editors and the reviewers. Any product that may be evaluated in this article, or claim that may be made by its manufacturer, is not guaranteed or endorsed by the publisher.
References
Aguilar-Rodriguez, C. E., Flores-Velazquez, J., Ojeda-Bustamante, W., Rojano, F., and Iniguez-Covarrubias, M. (2020). Valuation of the energy performance of a greenhouse with an electric heater using numerical simulations. Processes 8 (5), 600. doi:10.3390/pr8050600
Ahamed, M. S., Guo, H., and Tanino, K. (2019). Energy saving techniques for reducing the heating cost of conventional greenhouses. Biosyst. Eng. 178, 9–33. doi:10.1016/j.biosystemseng.2018.10.017
Akrami, M., Salah, A. H., Javadi, A. A., Fath, H. E., Hassanein, M. J., Farmani, R., et al. (2020). Towards a sustainable greenhouse: Review of trends and emerging practices in analysing greenhouse ventilation requirements to sustain maximum agricultural yield. Sustainability 12 (7), 2794. doi:10.3390/su12072794
Attar, I., Naili, N., Khalifa, N., Hazami, M., Lazaar, M., and Farhat, A. (2014). Experimental study of an air conditioning system to control a greenhouse microclimate. Energy Convers. Manag. 79, 543–553. doi:10.1016/j.enconman.2013.12.023
Bao, E., Zou, Z., and Zhang, Y. (2018). CFD simulation of heat transfer in back-wall of active thermal-storage solar greenhouse with different airflow directions. Trans. Chin. Soc. Agric. Eng. 34, 169–177. doi:10.11975/j.issn.1002-6819.2018.22.021
Berroug, F., Lakhal, E. K., Omari, M. E., Faraji, M., and Qarnia, H. E. (2011). Thermal performance of a greenhouse with a phase change material north wall. Energy Build. 43 (11), 3027–3035. doi:10.1016/j.enbuild.2011.07.020
Bouadila, S., Lazaar, M., Skouri, S., and Kooli, S. (2014). Assessment of the greenhouse climate with a new packed-bed solar air heater at night, in Tunisia. Renew. Sustain. Energy Rev. 35, 31–41. doi:10.1016/j.rser.2014.03.051
Campen, J., Bot, G., and De Zwart, H. (2003). Dehumidification of greenhouses at northern latitudes. Biosyst. Eng. 86, 487–493. doi:10.1016/j.biosystemseng.2003.08.008
Cossu, M., Murgia, L., Ledda, L., Deligios, P. A., Sirigu, A., Chessa, F., et al. (2014). Solar radiation distribution inside a greenhouse with south-oriented photovoltaic roofs and effects on crop productivity. Appl. Energy 133, 89–100. doi:10.1016/j.apenergy.2014.07.070
Cui, Z., Hu, W., Zhang, Y., Ji, T., Li, W., and Guan, Y. (2022). Simulation research on airflow distribution performance of solar greenhouse heating system in northwest China. EDP Sci. 356, 01067. doi:10.1051/e3sconf/202235601067
Ghasemi Mobtaker, H., Ajabshirchi, Y., Ranjbar, S. F., and Matloobi, M. (2016). Solar energy conservation in greenhouse: Thermal analysis and experimental validation. Renew. Energy 96, 509–519. doi:10.1016/j.renene.2016.04.079
Ghernaout, B., Attia, M. E., Bouabdallah, S., Driss, Z., and Benali, M. (2020). Heat and fluid flow in an agricultural greenhouse. Int. J. Heat. Technol. 3, 92–98. doi:10.18280/ijht.380110
Hassanien, R. H. E., Li, M., and Lin, W. D. (2016). Advanced applications of solar energy in agricultural greenhouses. Renew. Sustain Energy Rev. 54, 989–1001. doi:10.1016/j.rser.2015.10.095
Ioslovich, I., Seginer, I., Gutman, P-O., and Borshchevsky, M. (1995). Sub-optimal CO2enrichment of greenhouses. J. Agr. Eng. Res. 60, 117–136. doi:10.1006/jaer.1995.1006
Jensen, M. H., and Malter, A. J. (1995). Protected agriculture: A global review. Washington, D.C., USA: World Bank Publications, 25–26.
Kuang, Y., Zhang, Y., Zhou, B., Li, C., Cao, Y., Li, L., et al. (2016). A review of renewable energy utilization in islands. Renew. Sustain Energy Rev. 59, 504–513. doi:10.1016/j.rser.2016.01.014
Kurata, K., Quan, Z., and Nunomura, O. (1991). Optimal shapes of parallel east-west oriented single-span tunnels with respect to direct light transmissivity. J. Agric. Eng. 48, 89–100. doi:10.1016/0021-8634(91)80006-z
McCartney, L., Orsat, V., and Lefsrud, M. G. (2018). An experimental study of the cooling performance and airflow patterns in a model Natural Ventilation Augmented Cooling (NVAC) greenhouse. Biosyst. Eng. 174, 173–189. doi:10.1016/j.biosystemseng.2018.07.005
Mistriotis, A., Arcidiacono, C., Picuno, P., Bot, G., and Scarascia-Mugnozza, G. (1997). Computational analysis of ventilation in greenhouses at zero -and low-wind-speeds. Agric. For. Meterology 88, 121–135. doi:10.1016/s0168-1923(97)00045-2
Nayak, S., and Tiwari, G. N. (2008). Energy and exergy analysis of photovoltaic/thermal integrated with a solar greenhouse. Energy Build. 40 (11), 2015–2021. doi:10.1016/j.enbuild.2008.05.007
Rahman, M. M., Mostafiz, S. B., Paatero, J. V., and Lahdelma, R. (2014). Extension of energy crops on surplus agricultural lands: A potentially viable option in developing countries while fossil fuel reserves are diminishing. Renew. Sustain Energy Rev. 29, 108–119. doi:10.1016/j.rser.2013.08.092
Saberian, A., and Sajadiye, S. M. (2019). The effect of dynamic solar heat load on the greenhouse microclimate using CFD simulation. Renew. Energy 138, 722–737. doi:10.1016/j.renene.2019.01.108
Sethi, V. P. (2009). On the selection of shape and orientation of a greenhouse: Thermal modeling and experimental validation. Sol. Energy 83 (1), 21–38. doi:10.1016/j.solener.2008.05.018
Sharma, P. K., and Tiwari, G. N. (1999). Parametric study on a greenhouse by using Runge-Kutta methods. Convers. Manag. 40, 901–912.
Van Henten, E. J., Vanthoor, B., Stanghellini, C., De Visser, P. H. B., and Hemming, S. (2012). Model-based design of protected cultivation systems-first results and remaining challenges. Acta Hortic. 957, 255–266. doi:10.17660/actahortic.2012.957.29
Wang, T. Y., Wu, G. X., Chen, J. W., Cui, P., Chen, Z. X., Yan, Y. Y., et al. (2017). Integration of solar technology to modern greenhouse in China: Current status, challenges and prospect. Renew. Sustain Energy 70, 1178–1188. doi:10.1016/j.rser.2016.12.020
Wei, D. (2022). Numerical simulation of thermal environment and ventilation character-ristics of solar greenhouse [D]. Zhengzhou, China: Henan Agricultural University.
Yan, S., Fazilati, M. A., Toghraie, D., Khalili, M., and Karimipour, A. (2021). Energy cost and efficiency analysis of greenhouse heating system enhancement using phase change material: An experimental study. Renew. Energy 170, 133–140. doi:10.1016/j.renene.2021.01.081
Yang, S-H., and Rhee, J. Y. (2013). Utilization and performance evaluation of a surplus air heat pump system for greenhouse cooling and heating. Appl. Energy 105, 244–251. doi:10.1016/j.apenergy.2012.12.038
Yao, C. (2017). Simulation of the air curtain ventilation with deflector andIts application in environmental control of greenhouse andHoggery[D]. Xi’an, China: Xian University of Architecture and Technology.
Zhao, R. (2021). Influence of different ventilation conditions on air flow and temperature and humidity in plastic greenhouse [D]. Xianyang, China: Northwest A&F University.
Nomenclature
Keywords: greenhouse, hot air heating, air flow field, temperature field, humidity field
Citation: Zhang C, Zou D, Huang X and Wu Y (2023) Study on hot air heating characteristics of greenhouse in cold region. Front. Energy Res. 11:1038182. doi: 10.3389/fenrg.2023.1038182
Received: 06 September 2022; Accepted: 09 February 2023;
Published: 16 March 2023.
Edited by:
Jiangfeng Wang, Xi’an Jiaotong University, ChinaReviewed by:
Macmanus Ndukwu, Michael Okpara University of Agriculture, NigeriaWeifeng He, Nanjing University of Aeronautics and Astronautics, China
Copyright © 2023 Zhang, Zou, Huang and Wu. This is an open-access article distributed under the terms of the Creative Commons Attribution License (CC BY). The use, distribution or reproduction in other forums is permitted, provided the original author(s) and the copyright owner(s) are credited and that the original publication in this journal is cited, in accordance with accepted academic practice. No use, distribution or reproduction is permitted which does not comply with these terms.
*Correspondence: Dezhi Zou, emR6QGltdXQuZWR1LmNu; Xinpeng Huang, aHVhbmd4aW5wZW5nQGhpdC5lZHUuY24=