 Yong Li1*
94% of researchers rate our articles as excellent or good
Learn more about the work of our research integrity team to safeguard the quality of each article we publish.
Find out more
ORIGINAL RESEARCH article
Front. Energy Res., 03 February 2023
Sec. Nuclear Energy
Volume 11 - 2023 | https://doi.org/10.3389/fenrg.2023.1027624
This article is part of the Research TopicComplex Flow and Heat Transfer in Advanced Nuclear Energy systemsView all 6 articles
Introduction: Bubbling deaeration is widely applied in marine steam power system, and direct contact condensation (DCC) of steam injected into water under low sub-cooled water is the thermodynamic foundation of this technology. The deaeration process involves complex thermal and hydraulic behaviors, such as violent turbulence, interfacial mass transfer, and multiphase flow etc., which induce significant pressure fluctuation and radiated noise. In this paper, the two-phase flow regimes and acoustic characteristics of DCC of steam injected into water were studied for sub-cooled temperature ranging from 3℃ to 17℃.
Methods: Using high-speed camera to capture the dynamic plume shape, four typical plumes are found: external chug with encapsulating bubble, oscillating bubble jet, conical and cylindrical jet and cap jet; The underwater acoustic signal is measured synchronously, and the acoustic spectrum is obtained by Fast Fourier transform (FFT).
Results and Discussion: Combined with the plume image, the component sources of the acoustic signal are analyzed. It is found that the first dominant frequency and the second dominant frequency of the acoustic are caused by the evolution of the jet main steam zone and the downstream large steam column respectively; By analyzing the influence of injection parameters on acoustic signal, it is found that steam flow and sub-cooled temperatures have a great influence on acoustic root mean square value and spectrum characteristics. With the decrease of sub-cooled temperature, the main frequency of injection noise signal gradually moves to low frequency. Low frequency noise dominates the radiated noise when the flow field approaches the saturation temperature.
Deep deaeration of feedwater is required during operation of a marine nuclear power plant to restrain corrosion of pipelines and equipment. In order to save the cabin space, the hot-well bubbling deaeration scheme of the condenser is often adopted. The heated steam enters the low-super-condensate space of the hot-well by spraying it underwater and heats it to near-saturation temperature, which promotes the precipitation of dissolved oxygen in condensate. Due to the high temperature and speed difference, the steam has strong expansion and contraction in sub-cooled water. Due to the severe speed shear and the growth, rupture, and aggregation of steam bubbles, a large noise is generated, which affects the ship’s sound-hiding ability and the physical and mental health of the staff (Yong et al., 2020). Therefore, studying the heat transfer characteristics and noise of steam–water direct contact condensation is necessary.
Many scholars have carried out research on the shape and distribution law of steam jet plumes, and Kerney et al. (1972) are the first batch of scholars to carry out research on the steam jet. They carried out the research on the characteristics of steam plumes from the effects of plume penetration length, condensation driving potential, and steam flow. Chan and Lee (1982) were among the first scholars to establish a two-phase flow pattern diagram based on ambient water temperature and steam flow. After that, Chun et al. (1996) observed six jet forms: chugging, the transition region from chugging to condensation oscillation, condensation oscillation, bubbling condensation oscillation, stable condensation, and interracial oscillation condensation. Kim et al. (2004) found that conical jets appeared at low mass flow rates and low water temperatures. With the increase in mass velocity and water temperature, an ellipsoidal jet appears. Wu et al. (2009a), Wu et al. (2009b), and Wu et al. (2015) carried out sonic and supersonic jets, observed seven typical steam plumes, including expansion–contraction type and double expansion–contraction type, and found that unstable jets are prone to occur at high ambient water temperature and low steam inlet velocity. YUE et al. (2019) studied the pressure oscillation generated by the subsonic jet. It was found that under different flow conditions, the jet is divided into a stable condensation zone (SC), condensation oscillation zone (CO), chugging transition zone (TC), and chugging zone (C).
Li et al. (2019), Qiu et al. (2017), Alden et al. (2020), Wang et al. (2019), and others have carried out research on the pressure oscillation of pure steam jets. It is found that the pressure oscillation of low water temperature is caused by the rupture of the steam bubble. It propagates with a wave of stable dominant frequency, and the intensity decreases gradually with the propagation process and decreases sharply in the radial distance of the nozzle. Qiu et al. (2021) and Qiu et al. (2014) also found that the pressure oscillation propagates as a wave with a stable dominant frequency under low mass flow, and the intensity decreases gradually with the propagation process. The attenuation is intense at the radial distance of the nozzle, and the wave energy attenuates by 90% at the radial distance of 100 mm from the nozzle, which is consistent with the conclusion obtained by previous scholars. Chong et al. (2015) carried out research on the second dominant frequency of steam jets on this basis. It is found that the second dominant frequency gradually decreases with the increase in water temperature and inlet steam flow, and its energy and amplitude decay sharply at the radial position.
The noise around the steam plume has the same frequency and amplitude as the pressure oscillation, but the noise is more sensitive to high-frequency oscillations, and the noise is a direct problem faced by the ship’s sound-hiding ability. Therefore, Ma and Hu (2000), Hu and Ma (2000), and Ma et al. (1997) studied the mechanism and influencing factors of steam injection noise. It was found that with the increase in water temperature, the A-weighted peak noise level first increased and then decreased, and a peak was reached at 70°C. The high-frequency component of injection noise accounted for a large proportion when the water temperature was low, and the low-frequency noise component increased when the water temperature was high. By analyzing the change law of bubble diameter, it is found that the change speed of bubble diameter is directly related to the generation of noise. It is found that turbulent noise is the secondary sound source of steam injection noise. When the undercooling is low, the A-weighted peak noise level basically remains unchanged, and the smaller nozzle hole spacing can effectively reduce the injection noise. Yang et al. (2017) studied the mechanism of noise and oscillation in the limited channel and found that steam water parameters are an important factor affecting the pressure oscillation. With the increase in inlet flow, the pressure oscillation intensity in the stable area is basically unchanged, and the pressure oscillation intensity increases greatly in the unstable area.
At present, the research mainly focuses on steam injection under medium and high sub-cooling and lacks research on acoustic characteristics under low sub-cooling and its internal relationship with the jet plume. We use visualization and synchronous measurement noise to analyze the internal relationship between steam plume behavior and noise, which provides a reference for understanding the mechanism of steam injection condensation noise and noise control.
The experimental system is mainly composed of a steam supply system, auxiliary branch condensation system, low sub-cooling experimental water tank, and parameter measurement system. The experimental system is shown in Figure 1. After the steam is generated from the steam generator, 1) it is divided into two branches after passing through the surge tank 3) and the pressure-reducing valve 4), the main steam branch, and the auxiliary steam branch. In the main steam branch, the steam enters the water tank through the nozzle 8), after passing through the pressure transmitter 6) and temperature transmitter 7), and acts as underwater injection, and condensation and collapse occur in the water tank. The negative pressure of the water tank is pumped through the vacuum pump 16), and the negative pressure value reaches −0.05 MPa; in the auxiliary steam branch, the steam is cooled by the vortex flowmeter 5) and the steam cooler 11) and then enters the condensate storage tank 10) for storage. The auxiliary branch condensation system mainly cools the steam overflowing from the water surface in the experimental water tank, the steam in the steam cooler and condensate storage tank, and the ambient water in the cooling water tank. The steam flow of the main steam branch and the steam flow of the auxiliary branch were measured, respectively, and subtracted to obtain the small steam flow into the injection tank so as to solve the problem of inaccurate measurement of small steam flow. The electric tracing belt is arranged in the pipeline to prevent steam condensation in the pipeline. The experimental parameters are shown in Table 1.
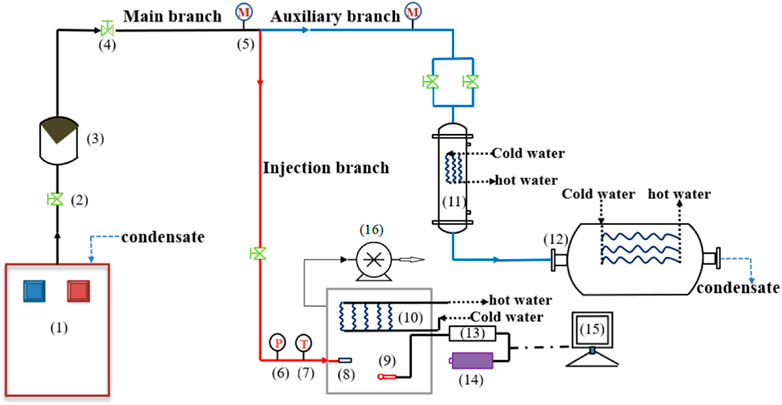
FIGURE 1. Experimental system.
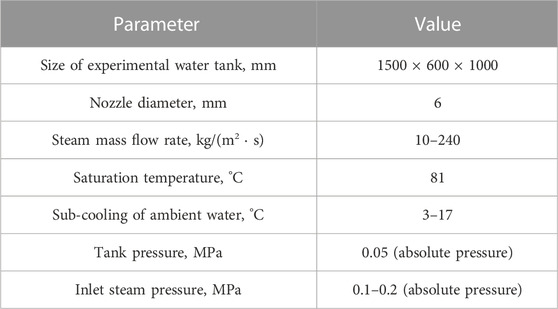
TABLE 1. Experimental parameters.
During the experiment, the steam flow injected into the water tank is controlled by the steam-regulating valve. The steam parameters entering the water tank through the pressure transmitter and temperature transmitter in front of the water tank were measured. The front and back of the water tank are provided with visual windows, and the back is provided with an LED light plate to provide a light source; a FASTCAM Mini WX100 high-definition camera is adopted with a shooting speed of 2500 FPS and a resolution of 2048 × 2048 pixel window to capture the evolution characteristics of steam plumes. The underwater steam injection noise is synchronously measured using the hydrophone 9) and transmitted to the computer through the data acquisition system. Through the aforementioned methods, the dynamic characteristics of the steam plume are obtained, the spectrum characteristics of the noise signal are analyzed, the variation law of noise with injection parameters is obtained, and the internal relationship between noise and the steam plume evolution and injection parameters is further revealed.
Because the experimental results are inevitably affected by the measurement error and system error, it is necessary to analyze the uncertainty of the experimental results. The measurement range of the vortex flowmeter used in the experimental system is 15–110 m3/h, the accuracy level is 1.0, and the noise frequency range measured using the hydrophone is 20 Hz–100 kHz. According to Moffat’s uncertainty analysis (Moffat, 1988), the uncertainty of flow, noise signal, and temperature measured in this experiment are 1%, 0.6 Db, and 0.5℃ respectively.
As shown in Figure 2A, this working condition is a typical external chug with an encapsulating bubble. At the beginning of the jet, the bubble shape is regular and spherical. With the jet, the bubble size gradually increases, and some jets have bubble-coated nozzles. When the bubble diameter increases to the maximum value (15 ms), the diameter is slightly larger than the nozzle diameter. Due to the shear action between high-speed steam and water and the pressure difference inside and outside the bubble, the necking process begins. The bubble leaves the continuous steam area, and the steam bubble covering the nozzle leaves the nozzle under the dual action of steam jet velocity potential and steam condensation potential. Due to the high steam condensation potential of ambient water, the necking separated steam bubble collapses quickly, and the pressure at the position where the bubble collapses decreases sharply. Ambient water is directly poured back into the nozzle (22 ms), resulting in the condensation of steam in the nozzle, and no steam is ejected from the nozzle (22–23.5 ms). Then, under the action of jet velocity potential, the steam bubble appears again in the nozzle, with an irregular hemispherical shape, starting the external chug behavior in the next cycle. In the whole process of external chug, the steam bubble experiences growth, necking, separation, and collapse. During the stagnation condensation process in the tube, it can be found that the typical characteristics of external chug are a long bubble growth cycle (9 ms) but a very short collapse time (2 ms). Figure 2B shows the oscillating bubble jet. In the initial stage of the jet, the bubble presents a hemispherical shape and regular shape. As the jet progresses, the bubble size gradually increases (2–4 ms). Under the dual influence of steam flow and ambient water, the phenomenon of covering the nozzle appears (6–8 ms). With the promotion of subsequent steam and the condensation of ambient water, the bubble gradually moves forward. The phenomenon of covering the nozzle gradually disappears (9–13 ms). The bubble shape transits from spherical to elliptical (8–15 ms), and the gas–liquid interface is relatively stable. The necking phenomenon occurs in the middle of the jet. The ellipsoidal bubble is separated from the nozzle and gradually separated from the continuous steam area, becoming an isolated bubble (20–20.5 ms), which is gradually condensed and collapsed under the cooling of the ambient water. It takes a short time (6.5 ms) from the beginning of necking to the completion of collapsing. During necking, there is a small oscillation at the necking position, and then necking is completed quickly (19–20 ms) under the cooling action of the ambient water. After necking, the volume of steam bubble near the nozzle gradually increases, and the shape changes from conical to hemispherical and finally becomes oval. The growth time of steam bubbles is long, and the speed is slow in the process of the steam jet. However, the collapse time is longer than the external chug, about 1/2 of the growth cycle.
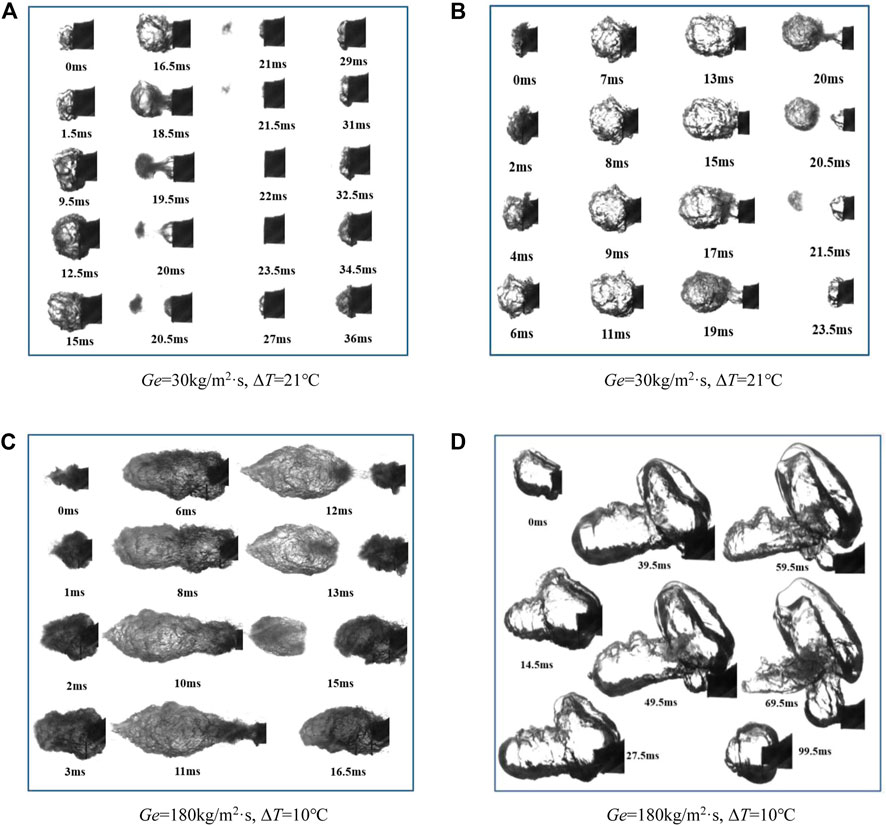
FIGURE 2. Four typical steam plume patterns.
Figure 2C shows the conical and cylindrical jet, the jet that changes from the initial conical to ellipsoidal jet (0–2 ms), and then the cylindrical steam plume appears. The axial jet distance is greatly increased compared with the external chug and oscillating bubble jet (3–8 ms), and the radial diameter changes less. With the necking process, the steam bubble volume near the nozzle changes greatly, and the radial diameter decreases (8–11 ms). The steam bubble downstream of the necking changes from a cylindrical plume to an isolated elliptical bubble (8–12 ms), which gradually condenses and collapses with the jet. When the steam mass flow rate increases to 70 kg/m2·s (Figure 2D), the shape of the steam plume changes from a conical and cylindrical jet to a cap jet, and the radial jet diameter increases greatly, especially when the cap jet appears near the nozzle, the effect of buoyancy still exists. At the same time, when the necking is not completed, the downstream steam bubble gradually decreases and the volume of cap plume near the nozzle gradually increases. When the downstream cylindrical bubble condenses completely and disappears, the volume of the cap plume reaches its maximum.
As shown in Figure 3, the mean square root of noise increases with the increase in steam mass flow when the sub-cooled temperature is 11°C. The increase in shear force produced by steam jet velocity potential leads to an increase in turbulent noise. At a low steam flow rate, the noise generated by steam injection has a small mean square root and a large distance between the peak and trough of the noise signal, which means that the frequency of the noise generated is small and the evolution period of steam plume is large. Generally speaking, the larger the vapor evolution period, the longer the bubble growth time, the larger the volume of the bubble, and the larger the mean square root value of the noise generated by its rupture. However, due to the restriction of the flow pattern at a low mass flow rate, the relative sound pressure value and frequency of injection noise are small. With the transition of jet type to a conical and cylindrical jet, the bubbles grow violently and break in a larger volume, the gas–liquid interface area of the steam plume gradually increases, and the noise and sound pressure produced by the necking and breaking of the steam plume are larger. At this time, the mixing action caused by the jet is larger, which enhances the condensation ability of ambient water and leads to a decrease in cycle time compared with a low mass flow rate.
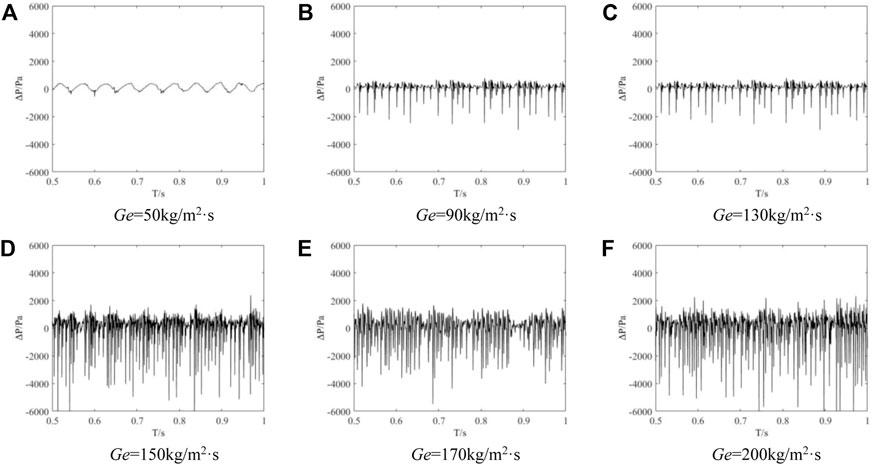
FIGURE 3. Noise time-domain signal at ΔT = 11°C.
As shown in Figure 4, when the ambient water temperature approaches the saturation temperature, the noise sound pressure signal gradually increases with the increase in the steam mass flow rate. Since the cooling capacity of ambient water is already low, the noise of injection mainly comes from the turbulent noise caused by the shear action between steam jet and water, so the sound pressure signal of noise increases with the increase in steam flow. When the steam mass flow rate is 70 kg/m2·s, the phenomenon of ambient water backfilling of the nozzle occurs, the steam is condensed in the nozzle, and the noise sound pressure signal basically disappears. When the steam flow rises to medium mass flow, the noise sound pressure signal continues to increase due to increased velocity shear.

FIGURE 4. Noise time-domain signal at ΔT = 3°C.
As shown in Figure 5, when the mass flow rate is 70 kg/m2·s, the general trend of root mean square of noise decreases with the decrease in sub-cooled temperature. When the sub-cooled temperature is 14°C, the cooling capacity of ambient water is strong, the process of bubble growth and cracking is violent, and the mean square root value of noise is high. When the sub-cooled temperature decreases to 7°C, the decrease in cooling capacity of ambient water leads to an increase in the evolution period of the steam plume type and a small change in pressure caused by bubble collapse, which results in a decrease in the mean square root value of injection noise. Under the condition that the mass flow rate is 70 kg/m2·s, the steam jet changes from the surge jet to cap jet. The mixing action of the steam jet dominates because the steam plume volume at ΔT = 5°C (Figure 5B) is larger than that at ΔT = 7°C (Figure 5C). Therefore, the mean square root value of the oscillating noise generated by steam injection at ΔT = 5°C is greater than that at ΔT = 7°C.
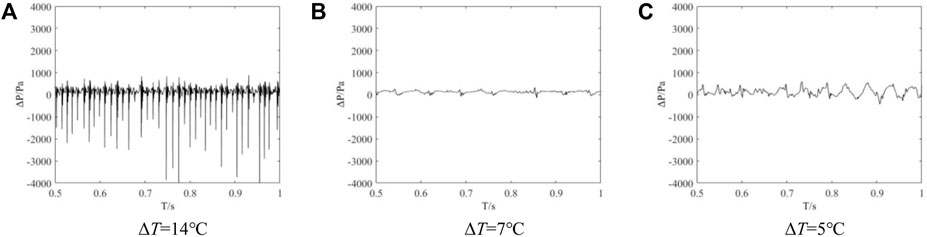
FIGURE 5. Noise time-domain signal when Ge = 70 kg/m2·s.
As shown in Figure 6, when the steam mass flow rate is increased to 220 kg/m2·s, the plume shape becomes conical and cylindrical under this condition. At higher steam flow rates, jet agitation increases condensation less than the input of steam energy. Therefore, the degree of condensation collapse of steam in water decreases, and the root mean square value of the noise signal decreases as sub-cooled temperature decreases.
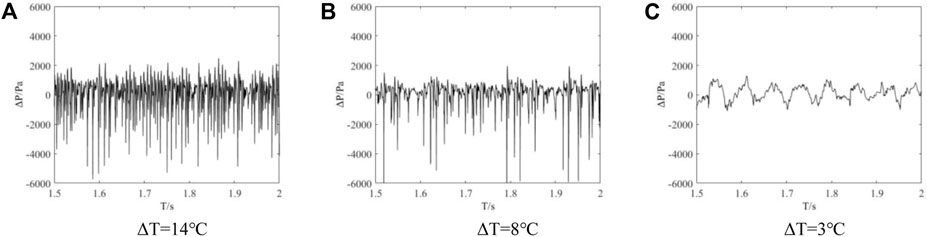
FIGURE 6. Noise time-domain signal when Ge = 220 kg/m2·.
We use FFT to transform the noise signals under different working conditions from the time domain to the frequency domain. At the same time, the main frequency and visualization results are compared and analyzed, and the sources of different components in the noise spectrum are analyzed to reveal the internal relationship between the generation of the noise signal and the shape of the steam plume. It provides support for exploring noise mechanisms and noise control.
As shown in Figure 7A, the distribution of the noise signal in the frequency domain is obtained through fast Fourier transform, and three dominant frequencies can be observed, of which the first dominant frequency is the natural dominant frequency of the system, and the second and third frequency bands are noise signal generation. Considering that the natural frequency of the system remains unchanged, the frequency band slightly larger than the fixed dominant frequency band in the frequency domain is defined as the first dominant frequency. The position of the frequency band slightly larger than the first dominant frequency is defined as the second dominant frequency, and so on. The center frequency of the first dominant frequency is 68.5 Hz, and the second dominant frequency is 142.6 Hz. When sub-cooling is relatively high, the relative distance between the first dominant frequency and the second dominant frequency is large; Figure 7B shows the evolution image of the steam plume under corresponding working conditions. The steam form at the necking position is divided into two parts. We define the steam near the nozzle as the main steam area, which is gradually increased by the promotion and energy supplement of subsequent steam, and then the necking volume decreases due to velocity shear. It is defined as the large steam column area downstream of the necking position, and after necking, it leaves the main steam area without external energy input. Under the action of jet velocity potential, it continues to move downstream and condenses and collapses. The cycle starts at the necking start position (0 ms). At this time, the volume of the downstream large steam column is the largest, and the volume of the main steam area is the smallest. With the progress of the jet, the volume of the downstream large steam column gradually decreases, and the volume of the main steam area gradually increases. The condensation collapse time of the downstream steam column is 7 ms, and its evolution frequency is 142.8 Hz. In the noise frequency-domain analysis, we found that the second dominant frequency of the noise is 142.6 Hz, which is basically the same. Therefore, the source of the second dominant frequency is the evolution behavior of the downstream steam column after necking. While the time for the steam plume in the main steam area to complete a cycle is 14 ms and the evolution frequency in the main steam area is 68.9 Hz, in the noise spectrum, the center frequency of the first dominant frequency is 68.5 Hz, so we believe that the source of the first dominant frequency of noise is the increase in steam volume upstream of the necking and necking process.
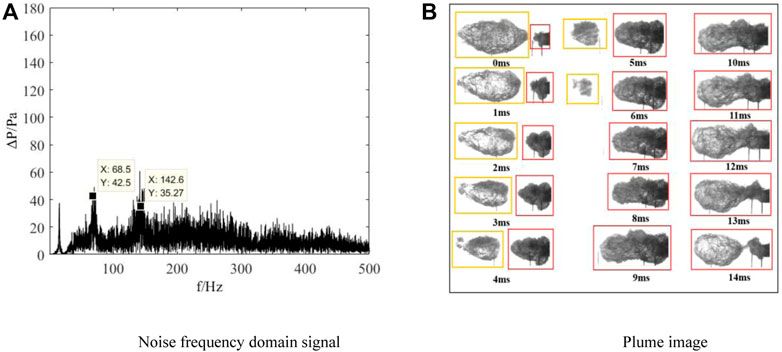
FIGURE 7. Ge = 180 kg/m2·s; ΔT = 9°C.
When the sub-cooled temperature drops (Figure 8A), the second dominant frequency in the noise spectrum disappears, and the center frequency of the first dominant frequency is 41.9 Hz. The first dominant frequency decreases with higher sub-cooling temperatures. Affected by condensation capacity, the evolution cycle of the steam plume increases. From the steam plume evolution image (Figure 8B), it can be seen that the steam evolution cycle in the mainstream area is between 22 and 24 ms, and the evolution frequency is in the range of 41.7–45.5 Hz. It is basically consistent with the evolution frequency in the noise spectrum. It takes 21 ms for the downstream steam column to separate from necking to complete collapse, and the evolution frequency is 47.6 Hz, which is close to the first dominant frequency. Therefore, we found that with the decrease in sub-cooled temperature, the second dominant frequency moved to the first dominant frequency.
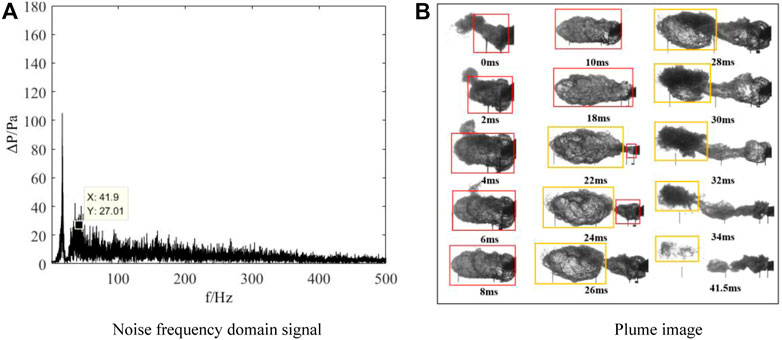
FIGURE 8. Ge = 180 kg/m2·s; ΔT = 7°C.
When the sub-cooled temperature drops close to the saturation temperature (Figure 9), the first dominant frequency and the second dominant frequency in the noise spectrum disappear; at this time, the condensation capacity of the ambient water is very weak. Also, when the steam condensation overflows in the form of bubbles, the noise generated is very small. The bubble necking is not obvious, and it is difficult to distinguish between the mainstream area and the downstream steam column. Therefore, we analyze the first and second dominant frequencies, which gradually shift to low frequencies with the decrease in ambient water sub-cooling until they disappear.

FIGURE 9. Ge = 160 kg/m2·s; ΔT = 3°C.
When the sub-cooled temperature decreases to 11°C (Figure 10), we only find the existence of the first dominant frequency at low steam flow. With the increase in steam flow, the first and second dominant frequencies appear. With the increase in steam flow, the first dominant frequency first increases and then decreases, and the change in the second dominant frequency is consistent with that of the first dominant frequency. With the increase in steam flow, the mixing effect is greater than the increase in input energy, resulting in an increase in condensation, the evolution period decreases, and the dominant frequency of noise increases. When the steam flow continues to increase, the mixing effect is less than the increase in input energy, and the condensation effect is less than the energy value introduced by the increase in steam flow, resulting in an increase in the steam plume evolution cycle, so the dominant frequency decreases in the noise spectrum.

FIGURE 10. Noise frequency-domain signal at ΔT = 11°C.
When the ambient water temperature is close to the saturation temperature (Figure 11), only the first dominant frequency is observed in the whole working condition, and the second dominant frequency does not appear. It can be judged that the steam necking process is not obvious when it is close to the saturation temperature. The condensation capacity of the ambient water is weak, the steam is no longer subjected to large-scale collapse condensation, and the position resolution between the main steam area and the downstream steam column is not obvious. The first dominant frequency first increases and then decreases with the increase in steam flow. At this time, the main frequency of noise may be turbulent noise.
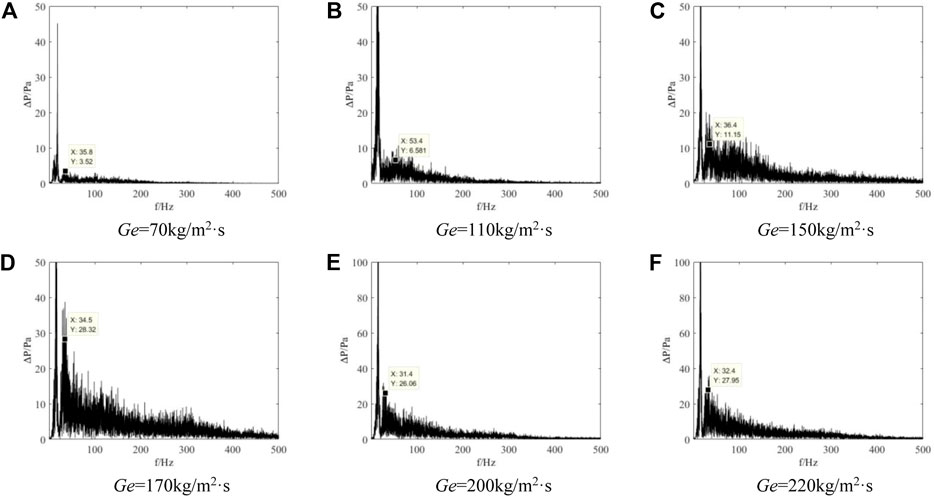
FIGURE 11. Noise frequency-domain signal at ΔT = 3°C.
When the steam mass flow is constant (Figure 12), the condensation capacity is strong at low steam mass flow rates and low sub-cooling, and the first and second dominant frequencies exist. With the decrease in sub-cooling, the first and second dominant frequencies in the noise spectrum gradually shift and disappear to low frequencies. The condensation capacity of ambient water plays an absolutely dominant role at low mass flow rates. When the sub-cooled temperature is high, the steam condensation potential is high. At this time, the steam flow is low, the energy it carries is low, and the speed of steam condensation is fast. With the decrease in sub-cooled temperature, the condensation capacity decreases, and the steam no longer condenses and collapses but gradually overflows the water surface, resulting in low noise sound pressure. At this point, there is only a little turbulent noise. Therefore, the first and second dominant frequencies are not observed in the noise spectrum at high water temperatures.
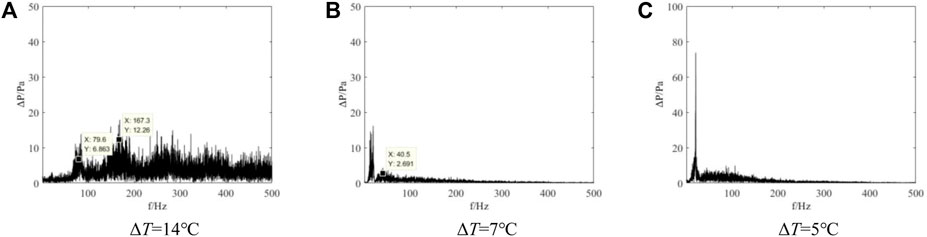
FIGURE 12. Noise frequency-domain signal when Ge = 70 kg/m2·s.
When the steam mass flow increases to 140 kg/m2·s (Figure 13), the existence of the first dominant frequency and the second dominant frequency is observed at the same time under this experimental working condition. At a lower water temperature, the steam condensation speed is faster, so that the first and second dominant frequencies are higher. With the decrease in sub-cooled temperature, the first dominant frequency and the second dominant frequency decrease, and the difference between them gradually decreases. It shows that the evolution time of the main steam zone is gradually close to the evolution cycle of the downstream steam column. When the sub-cooled temperature is low, the condensation capacity of the ambient water decreases, resulting in a further increase in the time of steam bubble growth, necking separation, and condensation collapse in the water so that the first main frequency and the second main frequency reach the minimum value under this working condition.
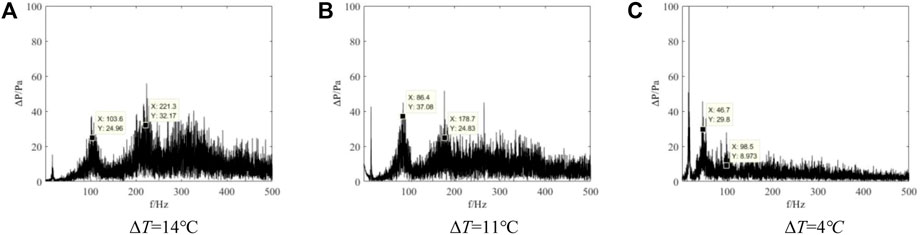
FIGURE 13. Noise frequency-domain signal when Ge = 140 kg/m2·s.
When the steam flow increases to 220 kg/m2·s (Figure 14), consistent with 180 kg/m2·s, the first dominant frequency and the second dominant frequency only exist at lower water temperature. With the decrease in sub-cooled temperature, they gradually transfer to low frequency. At higher water temperatures, the second dominant frequency disappears, coincides with the first dominant frequency, and gradually decreases with the increase in water temperature.
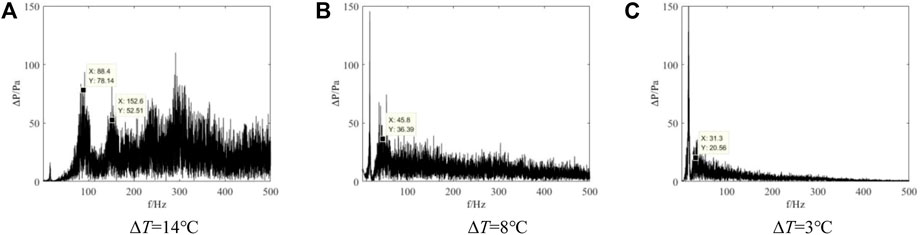
FIGURE 14. Noise frequency-domain signal when Ge = 220 kg/m2·s.
In conclusion, we find that the influence of steam flow and sub-cooled temperature on the noise spectrum is interactive. When the sub-cooled temperature remains unchanged, the first dominant frequency and the second dominant frequency of noise exist at higher sub-cooled temperatures and first increase and then decrease with the increase in steam flow. At lower sub-cooled temperatures, only the first dominant frequency exists, and the changing trend of the dominant frequency is consistent with that of low water temperature. The sub-cooled temperature has a great influence on the noise spectrum. When the steam flow is at a low level and remains unchanged, the dominant frequency only exists at the lower water temperature, and the dominant frequency is not found at the higher water temperature. With the increase in steam flow to medium steam flow, it is observed that both the first dominant frequency and the second dominant frequency exist in the spectrum, and both the first dominant frequency and the second dominant frequency decrease with the decrease in sub-cooled temperature. When the steam mass flow rate increases to a higher flow rate, the first dominant frequency and the second dominant frequency only exist at the lower water temperature and gradually transfer to the low frequency with the increase in the ambient water temperature. When it is close to the saturation temperature, the spectrum ranges of the first dominant frequency and the second dominant frequency gradually coincide.
In order to analyze the variation law of the noise time-domain signal, the root mean square of the noise sound pressure is defined as follows:
where
When the sub-cooled temperature remains unchanged (Figure 15A), the root mean square of noise generally shows an upward trend with the increase in steam flow. At low mass flow, the root mean square of noise is small due to the weak shear effect of steam and water velocity and the small volume of bubble growth and rupture. With the increase in steam flow, the root mean square of steam injection noise increases greatly. This is because the bubble volume is much larger than that in the small flow area and the noise caused by periodic bubble growth and condensation collapse increases. Also, the turbulent noise caused by the velocity shear effect between steam and water also increases. When the steam mass flow rate remains unchanged (Figure 15B), it is found that the root mean square of the noise signal gradually decreases with the decrease in sub-cooling. When the sub-cooled temperature is relatively high, the condensation of ambient water is relatively strong, resulting in the violent growth and rupture process of steam bubbles. Therefore, the noise amplitude is high, and when the ambient water temperature is close to the saturation temperature, the signal amplitude decreases to the lowest. At this time, the condensation capacity of ambient water is less affected, and the turbulent noise caused by velocity shear between steam and ambient water is dominant. Therefore, when the steam flow remains unchanged, the root mean square value of noise changes less near the saturation temperature.
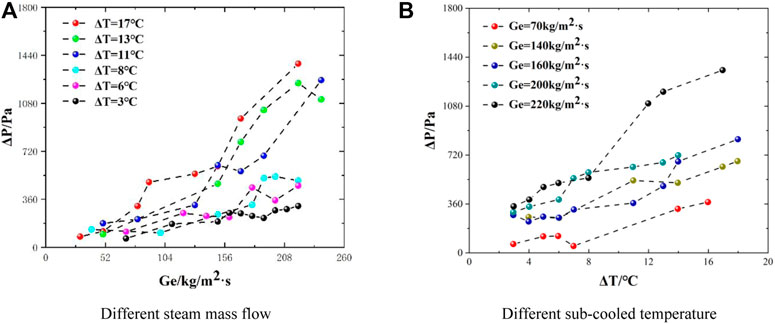
FIGURE 15. Root mean square value of noise.
This paper studies the condensation characteristics and noise characteristics of underwater steam injection under low sub-cooling and analyzes the influence of injection parameters on jet flow patterns and noise characteristics. The noise spectrum signal and visual image are combined to analyze the noise mechanism in the process of steam plume evolution. The conclusions are as follows:
(1) Using a high-speed camera to capture the plume shape, it is found that there are four typical plumes under low sub-cooling: an external chug with an encapsulating bubble, an oscillating bubble jet, a conical and cylindrical jet, and a cap jet;
(2) The noise signal is collected using the hydrophone, and the influence of injection parameters on the noise amplitude is analyzed. It is found that the root mean square of noise generally shows an upward trend with the increase in steam flow, and the root mean square of the noise signal gradually decreases with the decrease in sub-cooling;
(3) Using FFT to analyze the noise spectrum and combined with the visual image, it is found that the first dominant frequency in the noise spectrum is the periodic evolution of the main steam area upstream of necking, and the second dominant frequency is the collapse of large bubbles downstream of necking. The change of the dominant noise frequency is affected by steam flow and sub-cooling.
The change law of dominant frequency of the same sub-cooling (steam mass flow) is different in different flow ranges (sub-cooled).
The original contributions presented in the study are included in the article/Supplementary Material; further inquiries can be directed to the corresponding author.
YL: experiment and writing–original draft. HL: experiment and methodology. YZ: experiment and methodology. DL: supervision and writing–review and editing. ST: supervision and writing–review and editing.
This work is financially supported by Technology Field Fund (2019-JCJQ-JJ-555), Open Fund of Key Laboratory of Thermal Energy and Power Technology (QTWB-2019719-57) and Natural Science Foundation of Heilongjiang Province of China (LH2020E068).
The authors declare that the research was conducted in the absence of any commercial or financial relationships that could be construed as a potential conflict of interest.
All claims expressed in this article are solely those of the authors and do not necessarily represent those of their affiliated organizations, or those of the publisher, the editors, and the reviewers. Any product that may be evaluated in this article, or claim that may be made by its manufacturer, is not guaranteed or endorsed by the publisher.
Alden, Z., Maples, G., Dressler, K., Nellis, G., and Berson, A. (2020). “Conditional stability of direct contact steam condensation,” in Proceeding of the ASME 2020 Heat Transfer Summer Conference, 83709. Online. July 13–15, 2020V001T12A008. doi:10.1115/HT2020-9018
Chan, C. K., and Lee, C. K. B. (1982). A regime map for direct contact condensation. Int. J. Multiph. Flow. 8 (1), 11–20. doi:10.1016/0301-9322(82)90003-9
Chong, D., Zhao, Q., Yuan, F., Cong, Y., Chen, W., and Yan, J. (2015). Experimental and theoretical study on the second dominant frequency in submerged steam jet condensation. Exp. Therm. Fluid Sci. 68, 744–758. doi:10.1016/j.expthermflusci.2015.07.011
Chun, M. H., Kim, Y. S., and Park, J. W. (1996). An investigation of direct condensation of steam jet in subcooled water. Int. Commun. Heat Mass Transf. 23 (7), 947–958. doi:10.1016/0735-1933(96)00077-2
Hu, X., and Ma, X. G. (2000). Study on generation mechanism and radiation law of steam underwater injection noise. J.University Shanghai Sci. Technol. 22 (1), 6–9. doi:10.3969/j.issn.1007-6735.2000.01.002
Kerney, P. J., Faeth, G. M., and Olson, D. R. (1972). Penetration characteristics of a submerged steam jet. AIChE J. 18 (3), 548–553. doi:10.1002/aic.690180314
Kim, Y. S., Park, J. W., and Song, C. H. (2004). Investigation of the stem-water direct contact condensation heat transfer coefficients using interfacial transport models. Int. Commun. Heat Mass Transf. 31 (3), 397–408. doi:10.1016/j.icheatmasstransfer.2004.02.010
Li, W., Wang, J., Zhou, Y., Sun, Z., and Meng, Z. (2019). Investigation on steam contact condensation injected vertically at low mass flux: Part I pure steam experiment. Int. J. Heat Mass Transf. 131, 301–312. doi:10.1016/j.ijheatmasstransfer.2018.11.047
Ma, X. G., and Hu, X. (2000). Experimental investigation of the acoustic noise of an underwater steam jet. J. Eng. Therm. Energy Power 15 (6), 627–629. doi:10.3969/j.issn.1001-2060.2000.06.014
Ma, X. G., Zhao, Z. S., Chen, Z. H., and Cao, W. W. (1997). Experimental study on injection noise of drain water entering deaerator water tank. J.East China Univ. Technol. 19 (2), 11–15.
Moffat, R. J. (1988). Describing the uncertainties in experimental results. Exp. Therm. Fluid Sci. 1 (1), 3–17. doi:10.1016/0894-1777(88)90043-X
Qiu, B. B., Liu, J. P., Zhao, W. Y., Zhao, Q. B., Chen, W. X., Zhong, D. T., et al. (2014). Experimental study on the propagation characteristics of pressure oscillation of steam jet. J. Eng. Thermophys. 35 (6), 1120–1122.
Qiu, B., Yang, Q., Chen, W., Liu, J., and Yan, J. (2021). Theoretical analysis on bubble radius and pressure fluctuation during steam bubble condensation. Prog. Nucl. Energy 142, 104017. doi:10.1016/j.pnucene.2021.104017
Qiu, B., Yang, Q., Yan, J., and Revankar, S. T. (2017). Experimental investigation on the propagation characteristics of pressure oscillation in direct contact condensation with low mass flux steam jet. Exp. Therm. Fluid Sci. 88, 400–408. doi:10.1016/j.expthermflusci.2017.06.023
Wang, J., Lu, T., Deng, J., Liu, Y., Lu, Q., and Zhang, Z. (2019). Experimental investigations on pressure oscillation induced by steam-air mixture gas sonic jets in subcooled water. Int. J. Heat Mass Transf. 128, 450–458. doi:10.1016/j.ijheatmasstransfer.2018.09.017
Wu, X., Huang, X., Qiu, B., and Yan, J. (2015). A new method to calculate steam jet condensation heat transfer coefficient. Nucl. Power Eng. 32 (6), 42–44. doi:10.13832/j.jnpe.2015.06.0041
Wu, X. Z., Yan, J. J., Li, W. J., Pan, D. D., and Chong, D. T. (2009). Experimental study on sonic steam jet condensation in quiescent subcooled water. Chem. Eng. Sci. 64 (23), 5002–5012. doi:10.1016/j.ces.2009.08.007
Wu, X. Z., Yan, J. J., Pan, D. D., Liu, G. Y., and Li, W. J. (2009). Condensation regime diagram for supersonic/sonic steam jet in subcooled water. Nucl. Eng. Des. 239 (12), 3142–3150. doi:10.1016/j.nucengdes.2009.08.010
Yang, X. P., Chen, Y., Zong, X., Zhou, L., Liu, J. P., and Yan, J. J. (2017). Amplitude characteristics of pressure oscillation caused by steam jet condensation in a confined channel. Chin. Sci. Bull. 62, 730–736. doi:10.1360/N972016-00041
Yong, L., Li, S., Mo, T., Qi, X., and Wei, Z. (2020). Investigation on acoustic characteristic of direct contact condensation of steam injected into water under low sub-cooled water. Atomic Energy Sci. Technol. 54 (8), 1396–1402. doi:10.7538/yzk.2019.youxian.0641
Keywords: plume evolution, low sub-cooled water, steam underwater injection, acoustic characteristics, condensation characteristics
Citation: Li Y, Li H, Zhang Y, Li D and Tan S (2023) Experimental study on condensation and acoustic characteristics of steam underwater injection. Front. Energy Res. 11:1027624. doi: 10.3389/fenrg.2023.1027624
Received: 25 August 2022; Accepted: 18 January 2023;
Published: 03 February 2023.
Edited by:
Deqi Chen, Chongqing University, ChinaReviewed by:
Weihua Cai, Northeast Electric Power University, ChinaCopyright © 2023 Li, Li, Zhang, Li and Tan. This is an open-access article distributed under the terms of the Creative Commons Attribution License (CC BY). The use, distribution or reproduction in other forums is permitted, provided the original author(s) and the copyright owner(s) are credited and that the original publication in this journal is cited, in accordance with accepted academic practice. No use, distribution or reproduction is permitted which does not comply with these terms.
*Correspondence: Yong Li, emcry@163.com
Disclaimer: All claims expressed in this article are solely those of the authors and do not necessarily represent those of their affiliated organizations, or those of the publisher, the editors and the reviewers. Any product that may be evaluated in this article or claim that may be made by its manufacturer is not guaranteed or endorsed by the publisher.
Research integrity at Frontiers
Learn more about the work of our research integrity team to safeguard the quality of each article we publish.