- 1College of Electrical Engineering and Control Science, Nanjing Tech University, Nanjing, China
- 2State Grid Anhui Electric Power Co Ltd., Hefei, China
With the increasing of renewable energy penetration, adequate reserve capacity is more important to modern power system facing with various uncertain factors. Mobilizing the enthusiasm of units and demand response to participate in reserve auxiliary service can reduce the reserve providing pressure of conventional power supplies, which is conducive to the reliable and economical operation of system. The uncertain factors such as system random failure, prediction error of both load and renewable energy output are considered, and taking unit reserve, demand response such as flexible loads as system reserve resources, this paper establishes the risk cost models to optimize system up and down reserve requirement and make optimal allocation among units and flexible loads. A joint market clearing model of day-ahead electric energy and reserve auxiliary service is established in which both the units and flexible loads participate, and is solved by the robust optimization theory. The joint market clearing model takes the reliability and the economy of the system operation into account, and optimizes the clearing scheme for market decision makers, which can provide a decision reference for the market to resist the risk of uncertainty. Finally, the effectiveness of the model and method proposed in this paper is verified by a modified 10-machine 39-bus simulation example system.
1 Introduction
In order to ensure the safe and reliable operation of the modern power system, it is necessary to remain a certain reserve capacity to deal with uncertain factors such as random system failures, prediction error of load and renewable energy output (Li et al., 2022). The access of a large number of random renewable energy sources puts more pressure on the system reserve. Thermal power units have better response capabilities and usually account for a large proportion of installed capacity, therefore, they are easily selected as the main source of reserve capacity. However, thermal power units operating at low output level usually have a higher cost per unit electricity (Herranz et al., 2012). It is obviously uneconomical or even unreliable whether generators do not respond to the load demand for keeping reserve capacity during periods of high load, or generators start up and operate at a low load rate to provide reserve capacity for a short period of time during periods of low load (Bompaard et al., 2007).
Flexible load can provide reserve capacity for the system by interrupting or transferring part of the load in time, improve the elastic space of power dispatching and reduce the pressure on thermal power units to provide reserve (Anuj et al., 2018). Wen (Wen et al., 2019) has built a cost model of insufficient flexibility to evaluate the risk cost caused by random fluctuation of load demand and generator output for system reserve optimization. Chen (Chen et al., 2017) has comprehensively considered the wind power forecast error, load fluctuation, unplanned outage of units and other uncertain factors, and has integrated the interruptible load and wind curtailment as upper and lower reserve into the day-ahead dispatching to optimize the reserve capacity (Nikolaos et al., 2015). Has built a two-stage stochastic programming model to obtain the system reserve requirement from generation and load sides under the condition of high proportion of wind power penetration.
With the continuous advancement of the electricity market reform, the electricity market trading mechanism in China has become more flexible (Liu et al., 2019). The trading products have transitioned from a single electric energy market to a multi-type market with parallel electricity energy and auxiliary services (Yang et al., 2017). Trading entities have expanded from single generation side resource to multi-type resources of load and generation, and the operation mode has shifted from independent operation in each market to joint operation in multiple markets (Xun, 2010). Under the premise of transparent market information, independent markets can only achieve the best welfare of their respective markets (Shan, 2021). A reserve ancillary market clearing model for dealing with wind power and load uncertainty is established for system operation reliability by (Reddy et al., 2015). The risk cost of the unit failure and the interruptible load failure to provide system required up reserve is considered in the reserve market, meanwhile, a settlement scheme is proposed to reasonably allocate reserve cost between units and interruptible loads by (Luo and Xue, 2007), but it does not take the risk cost caused by insufficient down reserve into account. The reserve ancillary market can get the rational distribution of reserve resources from both the generation and load sides through flexible market forces (Wang et al., 2015), but it cannot obtain the optimal total benefit of the electric energy and reserve markets.
When the electric energy market and the reserve ancillary market are jointly cleared day-ahead, the generation side can bid the quantity and price based on its own generation cost, start-up cost and reserve dispatch cost (Anthony and Oren, 2014). The flexible load reports the adjustable quantity and price of different time periods day-ahead based on the electricity consumption income and reserve dispatch cost, and the transaction institution will make clearing according to the principle of maximizing social welfare and under certain system constraints (Shi et al., 2019; Chen et al., 2021). The influence of the traditional unit combination model on the utilization efficiency of flexible resources is analyzed (Yang et al., 2020; Li et al., 2021), a joint clearing model of day-ahead electric energy and reserve ancillary market is proposed for system flexibility. Sun (2020) has considered the quantity and price bidding of flexible load to participate in the joint market clearing of electric energy and reserve auxiliary service, but the impact of system uncertainty on the clearing results is not considered. The method of iterative game theory is used to consider the impact of wind power uncertainty on the joint market of electric energy and reserve (Xu et al., 2016). A model of the optimal supply strategy of concentrated solar power plants in the joint market is established, which takes the uncertainty of photovoltaic output into account based on the robust optimization theory (Lazaros et al., 2017). Chen (He et al., 2016) and He (2010) have considered the problem that the generation outage may cause insufficient power supply, and have established a power shortage expectation evaluation model to analyze the impact of interruptible loads on system reliability. Huang (Huang et al., 2019) has proposed a joint operation mode of energy market and multiple ancillary service markets. There are few studies on the joint market of electric energy and reserve auxiliary service with both units and flexible loads involving in system up and down reserve. To sum up, a few studies consider joint clearing model of electric energy and reserve auxiliary service with the participating of both generation and demand response, but most of the existing literatures fail to comprehensively consider the risk caused by insufficient up and down reserve. How to build the risk cost models to optimize the system up and down reserve requirement and make optimal allocation among units and flexible loads during market clearing is crucial. Besides, less joint clearing study of electric energy and auxiliary service has considered the uncertainty of both renewable energy and load. The uncertainty of these forecasting value has a certain impact on market clearing results, and comprehensive consideration of them will greatly enhance the market’s ability to resist uncertain risks.
Therefore, in this paper, the flexible load is introduced into the market in the form of bidding quantity and price, and the characteristics of flexible load, the uncertainty of net load and the risk caused by insufficient up and down reserves are comprehensively considered. A day-ahead joint clearing model of electric energy and reserve auxiliary service with the participating of both generation and demand response is established. A robust optimization model considering the uncertainty of net load is further proposed, which can help market decision makers find out the market clearing scheme under the worst scenario in the system and provide a reference decision for the market to resist the risk of uncertainty. Finally, the effectiveness of the method proposed in this paper is verified by example analyses.
2 Reserve risk model
2.1 Risk model for net load uncertainty
The uncertainty of load demand is an important factor in the analysis of modern power system reserve requirement. Assume that the load prediction errors of each period are independent of each other. It is generally believed that the short-term load prediction error follows the standard normal distribution:
Where,
Assume that the prediction error
Where,
System net load is defined as the difference between system load and renewable energy output. Since the prediction errors of load and renewable energy output are all subject to independent normal distribution, it can be known from the nature of the normal distribution that the net load forecast error
Where,
2.2 Risk model for system failure
In order to ensure the safe and reliable operation of the modern power system, it is necessary to reserve a certain reserve capacity to deal with uncertain factors such as random system failures, the load and renewable energy output forecast error (Fang et al., 2019). Thermal power units have better response capability, therefore, they are easily selected as the main source of reserve capacity. If demand response is considered to provide reserve capacity for the modern power system, it will be a beneficial supplement to the reserve of thermal power units, which will reduce the operation cost of the system. Therefore, this paper considers reserve resources form both units and flexible loads at the same time, and introduce risk cost to optimize the system reserve capacity.
2.2.1 Model of flexible load providing reserve
In this paper, flexible load is considered as interruptible load and transferable load. Considering the constraints of interruption capacity and times, the model of interruptible load providing reserve is as follows:
Where,
The total electricity quantity consumption of transferable load in a dispatching cycle remains fixed, but the electricity quantity in each time interval can be flexibly adjusted. The model is as follows:
Where,
2.2.2 Risk cost model of up reserve insufficiency
The risk cost caused by system insufficient up reserve is reflected in the cost of load loss caused by unit failure and net load prediction error.
Where,
Combined with the random failure information of each unit,
Where,
In the above situation, the system reserve shortage
Where,
The formula for calculating
2.2.3 Risk cost model of down reserve insufficiency
Considering the unplanned out-of-operation of load and the prediction error of net load, it is necessary for the system to remain enough down reserve capacity. Due to the existence of distributed or centralized power supply recovery equipment or control systems, such as automatic reclosing, standby automatic switching, and feeder automation, even if transformers, lines and other equipment fail, the load may still get continuous power supply. To model the loss due to excess power also needs to consider the substitutability of the equipment and the reserve capacity of the replacement system, which can make the model too complex. For a certain power grid, the occurrence time of load unplanned out-of-operation has certain regularity. Therefore, according to the historical information of load unplanned out-of-operation caused by the reasons other than unit failure at each time interval in the historical observation period, then the monthly average probability of load unplanned out-of-operation at each time interval of a day can be obtained to reflect the down reserve requirement of the system when the load is unplanned out.
In this paper, in the historical observation period of the month which time t belongs to, the ratio of cumulative load outage by the reasons other than unit failure to the total load demand is defined as the probability of load unplanned out-of-operation:
Where,
According to the load unplanned out-of-operation in the historical observation period, when the load unplanned out-of-operation occurs at the time
Where,
If the down reserve is not sufficient, the emergency control or correction control will cut off one or more units to maintain the safe and stable operation of system (Xue, 2002). In this paper, the minimum unit cutting cost caused by the unplanned load outage is used to evaluate the consequences of unplanned load outage, and the risk cost
Where,
The system down reserve shortage
Where,
Combined with the information analysis of load unplanned outage, the expected value of down reserve shortage is:
3 Joint clearing model
3.1 Objective function
In the electric energy market, the income of flexible loads and the generation cost of units are considered. Among them, wind power and photovoltaic units only participate in the electric energy market, and their costs are ignored to ensure their priority of clearing. In the reserve auxiliary service market, the reserve cost, start-up and shutdown cost of conventional units, and the reserve cost of flexible loads are considered, and the risk cost caused by the shortage of system reserve is also taken into account, a joint clearing model of electric energy and reserve market with the goal of maximizing social welfare is established:
Where,
Conventional units’ power generation cost bidding function and up reserve bidding function are:
Where,
Because the rigid load needs to be cleared and balanced completely, its income function will not affect the clearing results of neither the electricity energy market nor the reserve market, so it is only a part of the overall social welfare in the objective function and can be ignored in the optimization process. Interruptible loads’ bidding functions in the electric energy market and the reserve market are:
Where,
The risk cost
3.2 Constraint
3.2.1 System power balance constraint
Where,
3.2.2 Unit startup and shutdown time constraint
Where,
3.2.3 Conventional unit reserve capacity constraint
Where,
3.2.4 Branch safety constraint
Where,
3.2.5 Other constraint
At the same time, constraints such as the ramp rate, output limits of all units need to be considered, which is not repeated here.
3.3 Calculation of electricity price
Assuming that the electricity market adopts the locational marginal price, and the reserve market adopts the regional price. According to the Karush-Kuhn-Tucker condition, an extended Lagrangian function is constructed to obtain the dual multipliers of each constraint condition (Wang et al., 2021), and the prices of electric energy market and reserve market at time
Where,
4 Model solving based on robust optimization
4.1 Construction of uncertainty set model
Considering the prediction error of uncertain variables, the uncertainty set model is established. Define the polyhedron uncertain variable set
Where,
4.2 Construction of optimization model
The purpose of robust optimization is to find the scheduling scheme with the best economy when the uncertain variables change towards the worst scenario in the uncertain variable set
Constraints are as follows:
Where,
4.3 Model solving process
A bilevel solving process is established for the min-max model of Eq. 42, in which the Genetic Algorithm is used in the upper-level for scenario enumerating with different renewable energy output and load demand, and try to find the worst scenario with the minimum
Step 1: set related parameters in the algorithm, such as population size, cross mutation probability, iteration number
Step 2: encode and form an initial uncertain set population, randomly generate
Step 3: receive an uncertain set at the lower-level, use CPLEX to solve
Step 4: in the upper-level replace the current optimal solution with the smallest social benefit to obtain the current worst scenario. If the calculated social welfare
Step 5: if the number of iterations reaches the maximum, exit this process, otherwise, return to Step 3.
5 Case study
In this paper, a modified IEEE 10-machine 39-node system as shown in Supplementary Appendix Figure SA1 is established, in which the thermal power plant G10 and the load of bus 39 are used as the equivalent sending power grid, and the other receiving power grid get supply through tie line 39-1. Day-ahead clearing simulation of the receiver grid verifies the effectiveness of the proposed method in this paper. The power supply capacity in the receiving power grid is 9610MW, including 4 thermal power plants G1-G4, 2 hydropower plants G5-G6, 1 wind power plant G7 and 2 photovoltaic power plants G8-G9, of which G5 is set as a frequency modulation power plant. It is assumed that 5% of the load capacity of each bus in the receiving grid is flexible load, of which the interruptible and transferable loads are 3% and 2% respectively. See Appendix A for the parameters of unit, line and flexible load. The failure probability of each unit in each period is assumed as 0.5%, the unplanned outage probability of load is 0.5% and the load loss probability is 5%. According to the historical prediction error, the maximum prediction error of load is set to be 10%, the maximum prediction error of renewable energy output is set to be 15%, and the uncertainty parameter is taken as 40. See Appendix A for the forecasting values of tie line exchanging power and load.
5.1 Example of day-ahead clearing
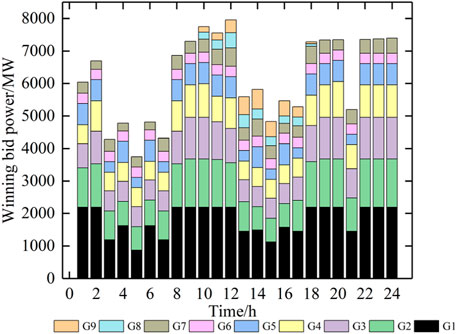
According to the robust optimization method proposed in this paper, the day-ahead calculation example is cleared, and the electric energy clearing results of the power plant are further obtained, which is shown in Figure 1. It can be seen from the figure that since the operation cost of wind power and photovoltaic is far lower than that of thermal power, and they do not participate in the reserve market. Therefore, all renewable energy units have priority to be cleared in the electric energy market at all times, and the insufficient part is balanced by hydropower and thermal power. The overall output level of thermal power plants G1 and G2 is high, and the output level of G3 and G4 is low. Among them, the power generation cost of thermal power plant G4 is higher than that of thermal power plants G1-G3, so G4 has the smallest winning bid power. Because hydropower has a better price advantage in the reserve market, its clearing result in the electric energy market is far lower than that of thermal power.
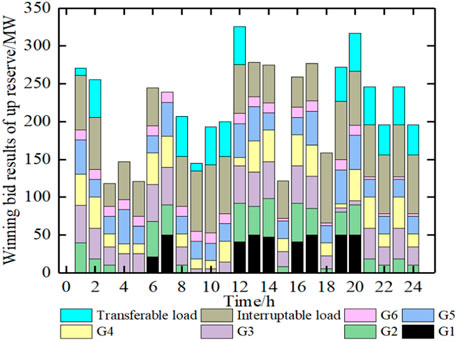
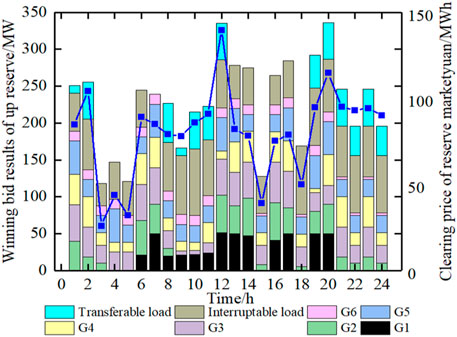
Figures 2, 3 show the winning bid power of plants and loads in the reserve ancillary service market for the up and down reserve, respectively. In the example, the equipment failure probability and unplanned load outage probability are both set as constant within a day. Therefore, the reason why the system reserve capacity is large at 12:00 and 20:00 in Figure 2 is that the fault during peak load will cause a larger loss of load, resulting in a high risk of load loss. Because the reserve bidding price of flexible load has certain advantages, flexible loads are cleared as part of the system up reserve at all times. From 8:00 to 11:00 and 22:00 to 24:00, when more thermal power and hydropower are cleared in the electric energy market, the winning bid up reserve capacity of the load is even higher than that of the unit. It can be seen that the participation of interruptible load and transferable load in the reserve auxiliary service will reduce the bid-winning capacity of the unit in the reserve market and reduce the pressure on the unit to provide reserve capacity. Because the price of interruptible load set in this paper is lower than that of transferable load in reserve market, the bid-winning capacity of interruptible load in each period is higher than that of transferable load.
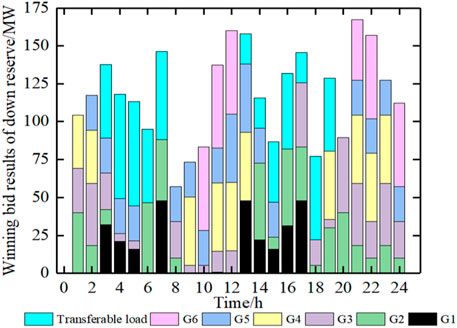
It can be seen from Figure 3 that the down reserve capacity cleared in the market at 12:00 and 21:00 is large, the reason is that the load outage during peak load will cause greater risk of unit tripping. The participation of transferable loads effectively supplements the system’s demand for down reserve from units. Since the transferable load accounts for a small proportion in the system, the winning bid results of down reserve capacity from the loads is smaller than that of the units.
Through robust optimization, the winning bid results of the wind power plant G7, photovoltaic power plant G8 and total load in the worst scenario are shown in Figure 4. The winning bid results are all between the upper and lower bounds of the prediction error.
After the flexible load participates in the joint market of electric energy and reserve auxiliary service, the clearing prices of electric energy and reserve capacity in each period are shown in Figures 5, 6.
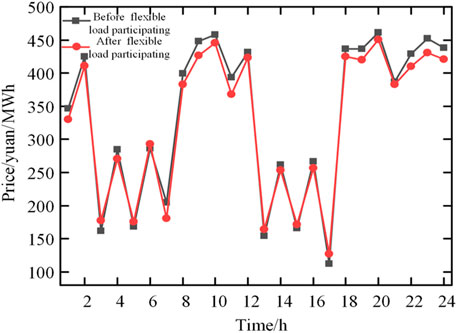
FIGURE 5. Clearing price of electric energy market before and after flexible load participating in joint market.
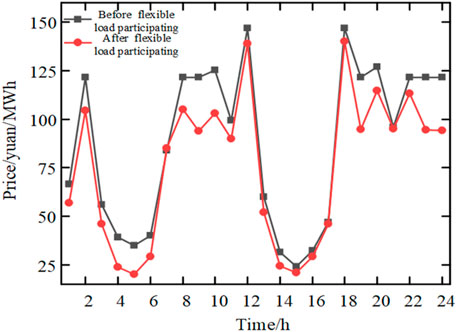
FIGURE 6. Clearing price of reserve market before and after flexible load participating in joint market.
It can be seen from Figure 5 that after the participation of flexible load, the daily average price of electric energy market is reduced from 321.6 yuan/MWh to 313.1 yuan/MWh. Especially from 8:00 to 11:00 and from 18:00 to 24:00, when the load demand is large and the risk of insufficient reserve is high, the clearing of flexible load in the reserve market reduces the load clearing in the electric energy market, which will help to reduce the clearing price of the electric energy market and reduce the fluctuation degree of electricity price throughout the day when the bidding strategy of units and loads remains unchanged. As the flexible loads which have lower prices than thermal power units participate in the reserve market, the average price of reserve market is also reduced from 80.7 yuan/MWh to 67.6 yuan/MWh throughout the day.
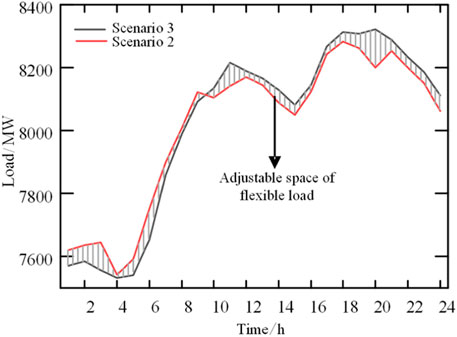
In order to discuss the effectiveness of the method proposed in this paper, three comparison scenarios are set up for joint clearing optimization. Scenario 1: the proportion of flexible load is 0, and the joint clearing model is calculated by robust optimization; Scenario 2: the proportion of flexible load is 5%, and the forecasting value of load and renewable energy is determined with 95% confidence; Scenario 3: the proportion of flexible load is 0, the forecasting value of load and renewable energy is determined with 95% confidence. Figures 5, 6 show the clearing prices of electric energy and reserve capacity in each period of scenario 1, respectively. See Appendix B for the optimization results of winning bid capacity, winning bid reserve capacity of units and loads, and clearing electricity prices for scenarios 2 and 3. Among them, after the flexible load participates in providing the up and down reserve of the system, the load reserve adjustment capability that scenario 2 can provide compared to scenario 3 is shown in Figure 7, which fully shows the flexibility of interruptible and transferable load to provide up and down reserve for the system. The market clearing results under the four scenarios are shown in Table 1.
According to Table 1, it can be seen that:
1) The participation of flexible load in the provision of up and down reserve of the system can effectively avoid the need for unit to operate in the range with higher production costs in order to ensure system safety, thereby reducing the power generation cost of the unit. Therefore, in the example, the methods considering the flexible load, that are the proposed method and scenario 2, have much lower generation cost than those of scenarios 1 and 3 without considering flexible load, and the proposed method in this paper has the lowest power generation cost.
2) Since the flexible load with price advantage is introduced into the reserve market to provide up and down reserve to the system, the proposed method in this paper and scenario 2 both have lower reserve cost. Since the robust optimization method in this paper considers the worst scenario, the reserve cost is slightly higher than that of scenario 2.
3) Since the price bidding strategy of flexible load of the method in this paper is same as that of scenario 2 and all cleared, the reserve cost and benefit of the flexible load of the two are equal.
4) Since the worst scenario is considered, the risk cost of the proposed method in this paper is lowest.
5) The total operation costs of the proposed method and scenario 2 are lower than that of scenarios 1 and 3, indicating that the participation of flexible load in reserve will reduce the total cost of the system.
In the above example, the failure probability of each unit in each period is assumed as a fixed unit failure probability value 0.5%. Here, assume that the failure probability of G1 increases from 0.5% to 15% during 8:00 to 12:00 and the failure probability of G3 increases from 0.5% to 20% during 15:00 to 20:00, here a variable unit failure probability case is introduced. The clearing results of the cases with fixed probability and variable unit failure probability are shown in Table 2. The winning bid results in electric energy market and reserve market are shown in Figures 8, 9 respectively.

TABLE 2. Total cost and income of system before and after failure probability increasing (104 yuan).
Compared with winning bid results in Figures 1, 2, the risk cost increases due to the increase of unit failure probability of G1 from 8:00 to 12:00, leading to significant increase of winning bid results of up reserve. Among them, the winning bid power of G1 in electric energy market decreases and the winning bid up reserve capacity of G1 increases obviously. When the failure probability of G3 increases from 15:00 to 20:00, the winning bid results of the system also has a similar rule.
In order to cope with the uncertainty of failure probability, the system reserve capacity increases from 872.21 MW to 966.22 MW during 8:00 to 12:00, and increases from 1205.13 to 1254.13 MW during 15:00 to 20:00. The total reserve capacity increases from 4107.79 W M to 4252.79 WM. Unit reserve cost and risk cost have increased. The reserve market price increases during 8:00 to 12:00 and during 15:00 to 20:00. The average daily reserve market price rises to 80.22 yuan/MWh.
5.2 Influence analysis of uncertain parameters in robust optimization
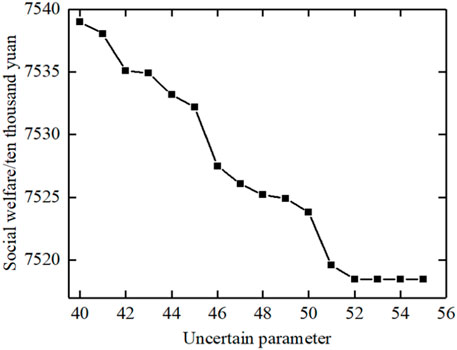
In order to further discuss the influence of the robust optimization model, the sensitivity analysis is carried out on the uncertain parameter
5.3 Influence analysis of flexible load bidding
In order to further discuss the influence of flexible load bidding in the joint market, define
In order to prevent the abuse of market power, it is necessary to limit the bidding range to monitor the behavior of individual bidding. This paper mainly considers the upper and lower limit constraints of the price adjustment coefficients:
Where,
The change of social welfare
When
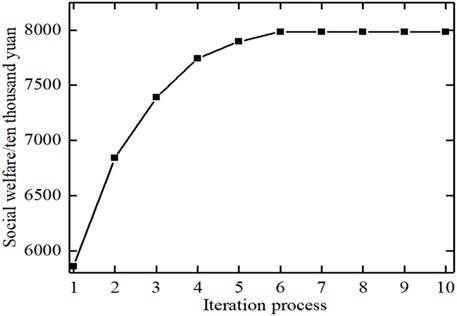
From the above analysis, it can be seen that the bidding of flexible load in the electric energy market and reserve market will affect the optimal distribution of load in the electric energy market and reserve capacity market, thereby affecting social welfare. In this paper, the bidding strategy is optimized based on Genetic Algorithm. The optimization iteration process is shown in Figure 11. It can be seen from the figure that the social welfare reaches the maximum after 6 iterations, and the optimal price adjustment coefficients are 1.61 and 0.57 respectively.
5.4 Influence analysis of flexible load proportion
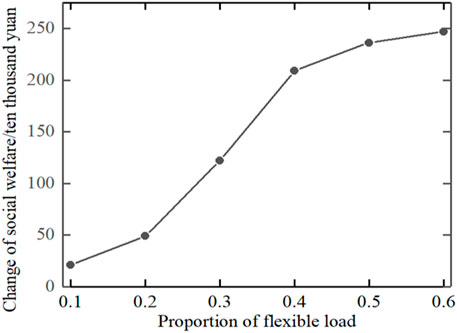
Based on the optimal price adjustment coefficients of flexible load,
6 Conclusion
The demand for system reserve due to uncertain factors such as net load prediction error, random failure of units and unplanned load shedding is considered in this paper, and the risk cost model of insufficient up reserve and down reserve of the system are established respectively. Two reserve resources from demand response and generators are considered, and the reserve capacity of the system is optimized through the risk cost. Aiming at the maximization of social welfare, a joint clearing model of electric energy and auxiliary service in the day-ahead spot market is established. A robust optimization model which takes the uncertainty of net load into account is then put forward, which can help market decision makers find out the market clearing scheme under the worst scenario of the system and provide reference decisions for the market to resist the risk of uncertainty. The research shows that the participation of the flexible load in the joint market can reduce the costs of power generation and reserve, avoiding the operation of units in the high operating cost section, increasing the total welfare of the power market, and improving the distribution of market-clearing electricity prices within a day. By rationally setting the bidding price and proportion of the flexible load, demand response can be guided to use electricity more scientifically and rationally, which can improve social welfare.
Data availability statement
The original contributions presented in the study are included in the article/Supplementary Material, further inquiries can be directed to the corresponding author.
Author contributions
YS: Conceptualization, Methodology, Software, Investigation, Formal Analysis, Writing—Original Draft; LH: Methodology, Writing—Original Draft; YC: Investigation, Formal Analysis; JW: Resources, Supervision; ZS: Data Curation, Validation; ZW: Writing—Review and Editing.
Funding
This work was supported by the project of State Grid Anhui Electric Power Co., Ltd. “Research on optimal allocation of energy storage and participation in power market mode considering coordinated control of load and storage”. The funder was not involved in the study design, collection, analysis, interpretation of data, the writing of this article, or the decision to submit it for publication.
Conflict of interest
JW, ZS, and ZW were employed by the State Grid Anhui Electric Power Co Ltd.
The remaining authors declare that the research was conducted in the absence of any commercial or financial relationships that could be construed as a potential conflict of interest.
Publisher’s note
All claims expressed in this article are solely those of the authors and do not necessarily represent those of their affiliated organizations, or those of the publisher, the editors and the reviewers. Any product that may be evaluated in this article, or claim that may be made by its manufacturer, is not guaranteed or endorsed by the publisher.
Supplementary material
The Supplementary Material for this article can be found online at: https://www.frontiersin.org/articles/10.3389/fenrg.2022.998902/full#supplementary-material
References
Anthony, P., and Oren, S. S. (2014). Large scale integration of deferrable demand and renewable energy sources. IEEE Trans. Power Syst. 29 (1), 489–499. doi:10.1109/TPWRS.2013.2238644
Anuj, B., Naveen, K. S., Yog, R. S., and Shrivastava, R. (2018). Market-based participation of energy storage scheme to support renewable energy sources for the procurement of energy and spinning reserve. Renew. Energy 135, 326–344. doi:10.1016/j.renene.2018.12.009
Bompaard, E., Ma, Y. C., Napoli, R., and Abrate, G. (2007). The demand elasticity impacts on the strategic bidding behavior of the electricity producers. IEEE Trans. Power Syst. 22 (1), 188–197. doi:10.1109/TPWRS.2006.889134
Chen, H. H., Wang, Y., and Zhang, R. F. (2017). Spinning reserve capacity optimization considering coordination between source and load for power system with wind power. Electr. Power Autom. Equip. 37 (8), 185–192. doi:10.16081/j.issn.1006-6047.2017.08.025
Chen, Q., Wu, M. X., and Liu, Y. Q. (2021). Joint operation mechanism of spot electric energy and auxiliary service for wind power market-oriented accommodation. Electr. Power Autom. Equip. 41 (3), 179–188. doi:10.16081/j.epae.202101026
Fang, X., Brimathiaa, H., Du, E., Kang, C., and Li, F. (2019). Introducing uncertainty components in locational marginal prices for pricing wind power and load uncertainties. IEEE Trans. Power Syst. 34 (3), 2013–2024. doi:10.1109/TPWRS.2018.2881131
He, G. N., Chen, Q. X., Kang, C. Q., and Xia, Q. (2016). Optimal offering strategy for concentrating solar power plants in joint energy, reserve and regulation markets. IEEE Trans. Sustain. Energy 7 (3), 1245–1254. doi:10.1109/TSTE.2016.2533637
He, Y. (2010). Research on model of interruptible load participating in reserve ancillary services market open to both supply and demand sides. Guangdong, China: South China University of Technology. Available at: https://kns.cnki.net/kcms/detail/detail.aspx?dbcode=CMFD&dbname=CMFD2011&filename=2010227822.nh.
Herranz, R., Munoz, S, R, A., Villar, J., and Campos, F. A. (2012). Optimal demand side bidding strategies in electricity spot markets. IEEE Trans. Power Syst. 27 (3), 1204–1213. doi:10.1109/TPWRS.2012.2185960
Huang, D. S., Wu, Y. H., and Lv, X. (2019). Optimization model for combined electricity spot and ancillary service markets considering variable generation resources. Power Demand Side Manage 21 (6), 30–37. doi:10.3969/j.issn.1009-1831.2019.06.007
Lazaros, E., Jalal, K., Pierre, P., De Greve, Z., and Vallee, F. (2017). Impact of public aggregate wind forecasts on electricity market outcomes. IEEE Trans. Sustain. Energy 8 (4), 1394–1405. doi:10.1109/TSTE.2017.2682299
Li, P., Li, F. T., and Song, X. F. (2021). Considering the flexible load new energy access system optimization forSpinning reserve. Power Syst. Technol. 45 (4), 1289–1297. doi:10.13335/j.1000-3673.pst.2020.0113a
Li, R., Wang, M. Q., and Yang, M. (2022). Robust-stochastic reserve optimization considering uncertainties ofContingency probability and net load. Autom. Electr. Power Syst. 46 (6), 20–29. doi:10.7500/AEPS20210523001
Liu, Z., Lei, S. F., and Wang, Q. L. (2019). Clearing model of regional electricity spot market considering reserve sharing. Electr. Power Constr. 42 (11), 64–71. doi:10.12204/j.issn.1000-7229.2021.11.007
Liu, Z. (2019). Research on the market transaction of reserve ancillary service considering interruptible load. Xian, China: Xian University of Technology. Available at: https://kns.cnki.net/kcms/detail/detail.aspx.
Luo, Y. H., and Xue, Y. S. (2007). Hybrid optimization of generation capacity adequacy. Autom. Electr. Power Syst. 31 (12), 30–35. Available at: https://kns.cnki.net/kcms/detail/detail.aspx=CJFD&dbname=CJFD2007.
Ma, L., Liu, N., Zhang, J. H., Tushar, W., and Yuen, C. (2016). Energy management for joint operation of CHP and PV prosumers inside a grid-connected microgrid:a game theoretic approach. IEEE Trans. Ind. Inf. 12 (5), 1930–1942. doi:10.1109/TII.2016.2578184
Nikolaos, G., Ozan, E., Anastasios, G., and Catalao, J. P. S. (2015). Load-following reserves procurement considering flexible demand side resources under high wind power penetration. IEEE Trans. Power Syst. 30 (3), 1337–1350. doi:10.1109/TPWRS.2014.2347242
Reddy, S. S., Bijwe, P. R., and Abhyankar, A. R. (2015). Joint energy and spinning reserve market clearing incorporating wind power and load forecast uncertainties. IEEE Syst. J. 9 (1), 152–164. doi:10.1109/JSYST.2013.2272236
Shan, Y. (2021). Research on short-term pricing decisions of thermal power rnterprises in electricity spot market. Beijing, China: North China Electric Power University. Available at: https://kns.cnki.net/kcms/detail/detail.aspx?dbcode=CMFD&dbname=CMFD202201&filename=1021124929.nh&uniplatform=NZKPT&v=o4vPA8ZnSaOCxvXtw8vYdsey6ug9r6P8BRq89igbN_8VjiBcIHOfdqxlejTW6qz.
Shi, X. H., Zheng, Y. X., and Xue, B. K. (2019). Effect analysis of unit operation constraints on locational marginal price of unit nodes. Power Syst. Technol. 43 (8), 2659–2664. doi:10.13335/j.1000-3673.pst.2019.0540
Sun, G. X. (2020). Research on flexible load participating in the joint market of electricitiy and reserves under the bilateral bidding model. Guangdong, China: South China University of Technology. Available at: https://kns.cnki.net/kcms/detail/detail.aspx?dbcode=CMFD&dbname=CMFD202101&filename=1020330782.nh.
Wang, B. B., Li, Y. R., and Li, Y. (2015). Optimal coordination between system reserve and interruptible loads with response uncertainty. Electr. Power Autom. Equip. 35 (11), 82–89. doi:10.16081/j.issn.1006-6047.2015.11.013
Wang, Y., Yang, Z. F., and Yu, J. (2021). Analysis and extension of internal relationship between locational marginal price and dual multiplier. Autom. Electr. Power Syst. 45 (6), 82–91. doi:10.7500/AEPS20200718001
Wen, F. R., Li, H. Q., and Wen, X. Y. (2019). Optimal allocation of energy storage systems considering flexibility deficiency risk in active distribution network. Power Syst. Technol. 43 (11), 3952–3962. doi:10.13335/j.1000-3673.pst.2018.2528
Xu, Q. Y., Zhang, N., Kang, C. Q., Xia, Q., He, D., Liu, C., et al. (2016). A game theoretical pricing mechanism for multi-area spinning reserve trading considering wind power uncertainty. IEEE Trans. Power Syst. 31 (2), 1084–1095. doi:10.1109/TPWRS.2015.2422826
Xue, Y. S. (2002). Coordinations of preventive control and emergency control for transient stability. Autom. Electr. Power Syst. 25 (04), 1–4. Available at: https://kns.cnki.net/kcms/detail/detail.aspxDLXT200204000.
Xun, W. (2010). The study of reserve ancillary service rrading and pricing considering interruptible load. Beijing, China: Beijing Jiaotong University. Available at: https://kns.cnki.net/kcms/detail/detail.aspx.
Yang, M., Zhang, L. Z., and Lv, J. H. (2020). Flexibility-oriented day-ahead market clearing model for electrical energy and ancillary services. Electr. Power 53 (8), 182–192. doi:10.11930/j.issn.1004-9649.202006277
Keywords: renewable energy, electric energy market, reserve ancillary service, demand response, uncertainty factors, joint clearing model
Citation: Shao Y, Hao L, Cai Y, Wang J, Song Z and Wang Z (2022) Day-ahead joint clearing model of electric energy and reserve auxiliary service considering flexible load. Front. Energy Res. 10:998902. doi: 10.3389/fenrg.2022.998902
Received: 20 July 2022; Accepted: 30 August 2022;
Published: 28 September 2022.
Edited by:
Jiajia Yang, University of New South Wales, AustraliaReviewed by:
Pingfeng Ye, Shandong University of Science and Technology, ChinaTianran Li, Nanjing Normal University, China
Chuan QIN, Hohai University, China
Copyright © 2022 Shao, Hao, Cai, Wang, Song and Wang. This is an open-access article distributed under the terms of the Creative Commons Attribution License (CC BY). The use, distribution or reproduction in other forums is permitted, provided the original author(s) and the copyright owner(s) are credited and that the original publication in this journal is cited, in accordance with accepted academic practice. No use, distribution or reproduction is permitted which does not comply with these terms.
*Correspondence: Lili Hao, aGFvbGlsaUBuanRlY2guZWR1LmNu
 Yijun Shao
 Lili Hao
 Yaqi Cai1