 Zhiwei Wang1
 Lixin Wang
- 1State Grid Jilinsheng Electric Power Supply Company, Changchun, China
- 2State Grid Jilinsheng Electric Power Supply Company Electric Power Institute, Changchun, China
- 3Northeast Electric Power University, Jilin, China
The extensive application of power electronic equipment and the increasing penetration of renewable energy generation gradually strengthen the nonlinear and modal-coupling characteristics of electromechanical oscillation of modern power systems. In this study, a data-driven method based on improved blind source separation (IBSS) combined with sparse component analysis (SCA) is proposed to extract electromechanical mode (oscillation frequency, damping ratio and mode shape) from synchrophasor measurements. First, short time Fourier transform is used to convert the modal-coupling oscillation signal to sparse domain, then, on the basis of time-frequency point clustering characteristics of source signals, the mixture matrix A is estimated by frequency energy peak point algorithm, and L1 norm is utilized to separate each mode from mixture matrix A. Finally, the Hilbert identification algorithm is applied to extract the oscillation parameters. The performance of the proposed IBSS method for the mode extraction is verified using the test signal, the simulation signal, and the measured data.
1 Introduction
With the acceleration of power grid interconnection across the country and the increasing scale of renewable energy, the power systems are being operated closer to their limits and even reach the collapse point, resulting in obvious coupling and non-stationary characteristics after a power system is disturbed. Low-frequency oscillation has become one of the important factors affecting the stability of power system (Yang et al., 2020; Lv et al., 2021; Xue et al., 2022). Therefore, accurate and timely extraction of electromechanical modal parame-ters after disturbance is important for ensuring the stability and security of the power system (Feng et al., 2019).
Traditionally, the power system oscillation modes can be obtained through a model-based approach by linearizing the non-linear differential algebraic equations of a power system at the current operating point. However, this kind of approach is highly dependent on the complete system structure and accurate component parameters. The advent and deployment of phasor measurement units (PMUs) builds a reliable data platform for real-time monitoring, analysis and control of power systems, which provides a new approach for low-frequency oscillation mode identification (Khosravi-Charmi and Amraee, 2018)– (Kopse et al., 2015). Therefore, the measurement-based approaches are alternatives to complement the model-based approaches. In the early days, the single measurement channel was used to extract electromechanical modal parameters, using the advanced identification technique, such as Prony (Hauer, 2015) and its improved algorithm (Wadduwage et al., 2015), Hilbert Huang transform (HHT) algorithm (Lauria and Pisani, 2014), etc., This kind of algorithm can identify oscillation frequency, damping ratio and other oscillation characteristic parameters by directly processing and analyzing the synchrophasor measurement collected by PMUs. Recently, with the advances in PMU configuration, dynamic feature extraction methods based on multi-channel sources were introduced to analyze the dynamic behavior and estimate the dominant modes from the global perspective, among which the representative algorithms include stochastic subspace identification (SSI) (Jiang et al., 2015), multivariate empirical mode decomposition (MEMD) (You et al., 2016), etc. This kind of modal parameters extraction method can analyze the dynamic behavior of each generator from a global perspective, and the identification accuracy is high. However, due to the large amount of input measurements, the calculation is time-consuming and the analysis efficiency is low.
Moreover, the extensive application of power electronic equipment gradually strengthens the nonlinear and coupling characteristics of electromechanical oscillation of modern power systems. Fast and effective identification of modal-coupling oscillation is the focus of power system operators. Traditional measurement-based methods are difficult to meet the needs of security analysis of multi-modal coupled power systems. Blind source separation method was first developed to extract the modal parameters of the structures such as voice and image processing, and the application of the method in the signal processing field shows that it has good attribute of separating the independent source signals, however, until so far, we have not seen much application in electromechanical modal parameters in power systems (Yi et al., 2017; Ye et al., 2018).
To address the deficiencies listed above, first, the measurement input signals are filtered according to the rational inertia, which effectively reduce the dimensionality of original data, then an improved blind source separation method based on sparse component analysis is introduced to extract the power system oscillation modal parameters. Compared with the traditional low-frequency oscillation mode identification method, the improved blind source separation algorithm can accurately separate the stationary source signal with single frequency from the nonlinear and nonstationary multi-modal coupled oscillation signals, and accurately extract the oscillation modal parameters such as mode frequency and damping ratio. The case studies of test signal, the simulation signal and the measured data confirm the superior characteristics of the proposed IBSS based multi-modal coupled modal parameter extraction.
The remainder of this paper is organized as follows: Section 2 introduces the theoretical foundation of the traditional BSS. Section 3 develops the IBSS method based on sparse component analysis. Section 4 expands the IBSS to extract the oscillation modal parameters. Section 5 presents three cases to evaluate the performance of the proposed method. Section 6 concludes the paper.
2 Blind source separation
The term blind source separation (BSS) refers to a wide class of problems in signal and image processing, in which one needs to extract the underlying sources from a set of mixtures. The mathematical model of BSS can be expressed as (Ye et al., 2018):
where
BSS algorithm is usually suitable for solving positive definite problems, that is, the mixing matrix A is full rank, in which the number of observed signals (m) is greater than or equal to the number of source signals (n). The core of BSS is to solve the mixture matrix A and its inverse matrix W, which is called the separation matrix, moreover, the source signal can be separated simultaneously, satisfying (Yang et al., 2018):
3 Improved blind source separation
3.1 Sparse component analysis
An attractive advantage of sparse component analysis (SCA) is that it can transform the time-domain signal into the frequency domain through appropriate linear transformation method, such as short-time Fourier transform, wavelet transform, etc., making the observed measurement signals sparse in the frequency domain. The sparsity of observation signal means that most time-frequency points are zero, and only a few time-frequency points have large values in the time-frequency domain (Ye et al., 2018). In this paper, one-dimensional time-domain signal is transformed into two-dimensional time-frequency-domain signal by short-time Fourier transform, and the rectangular window function is selected. And 1) could be further expressed as (Yi et al., 2017):
where
When each source signal is sparse and disjoint, the observed signal has at most one source signal at a certain time-frequency point. Assuming that only the source signal
Then, (4) can be simplified as:
From a geometrical point of view, if the real part or imaginary part of
Based on the obtained mixing matrix A, the L1 norm is used to solve the underdetermined equation, then the system source signal is extracted.
3.2 Mixing matrix estimation
The premise of estimating the mixing matrix A is that the time-frequency points of the mixed signal can form a clustering line with certain directionality in the real or imaginary part scatter diagram. In this paper, the fuzzy C-means method is used to estimate the mixing matrix A by calculating the clustering center of the clustering line, which is suitable for the blind source decomposition problem with any number of measurement signal channels. However, when there are too many time-frequency points, the clustering direction in the scatter diagram is complicated, resulting in much calculation time and poor identification accuracy.
The source signal propagates outward in the energy form, however, the energy will be attenuated during the propagation process, the final energy of the same source signal reaching each observation is a little different. Therefore, an algorithm combing the frequency energy peak point method (Jin et al., 2021) and the fuzzy C-means method is proposed to estimate the mixing matrix A.
The main principle of the proposed method to estimate the mixture matrix A is: since the energy of each source signal is the largest near its own frequency point, the frequency value of each source can be determined by using the frequency peak method. The clustering straight line direction of the corresponding time-frequency point at the maximum energy is the clustering direction of each source signal. Then, the real part or imaginary part time-frequency dispersion points corresponding to each peak frequency point are normalized and mapped to the unit circle. Finally, the clustering center is calculated by using the fuzzy C-means algorithm, so as to obtain the mixing matrix A.
In the time-frequency domain, the energy distribution of a single measurement signal is firstly calculated, and then the energy of multiple channels at the same frequency point is added, which is:
where E(f) is the sum of the energy of all observation signals at each frequency point; xi is the i-th time-frequency point;
3.3 Source signal recovery
SCA algorithm utilizes the sparsity of the source signal in time-frequency domain to recover the source signal. The sparse solution is obtained by establishing and solving the optimization problem (P1) in (7):
where
4 Oscillation modal parameter identification
4.1 Rotational inertia-based input measurement selection
The power system requires accurate generator parameters and mathematical models when performing small-signal stability calculation and analysis. The kinetic energy of the generator is an important parameter of the generator, which is determined by the rotational inertia of the generator rotor. The rotational inertia refers to the inertia of the generator rotor during the rotation process, which affects the electromechanical transient process of each generator and is of great significance to the stability and safety of the power system. When the system is disturbed, the generator rotor will accelerate or decelerate due to the unbalanced torque, and the rotational inertia can be expressed as the ability of the system to return to the original stable operation. The smaller the rotational inertia, the worse the generator’s resistance to disturbance. When the proposed method is applied to the actual system, it is necessary to use the rotational inertia of the generator in each region as a quantitative index, and select the measurement signals of the generator with the smallest rotational inertias as the input signals of SCA algorithm, which can greatly reduce the number of the input signals and effectively improve the calculation speed.
4.2 Estimation of modal matrix
The low-frequency oscillation signal of power system is essentially the multimodal coupling response, which can be expressed by (8). The oscillation frequency has a large deviation in a period of time, which shows obvious nonlinear characteristics:
where
Comparing (1) and (8), the viewpoints of characteristic parameter identification of electromechanical oscillation mode and blind source separation are consistent, that is, the perturbed dynamic response of multi-modal coupling is regarded as a linear group of multiple single-modal responses. The single-modal response q(t) is equivalent to a special form of the source signal s(t), and the mixing matrix A contains the information of the modal matrix, satisfying
4.3 Oscillation frequency and damping ratio identification based on hilbert transform
In this paper, Hilbert transform (HT) is used to extract the oscillation frequency and damping ratio (Gibbard and Vowles, 2010). Performing the HT on a single-mode oscillation component qi(t), we can obtain:
Where
Introduce an analytic function consisting of q(t) and h(t):
Where A(t) is the envelope of the signal after Hilbert transform and
The instantaneous frequency can be obtained:
The system oscillation signal can be deduced from the generator swing equation, which can be expressed as:
Where qi(t) is a cosine curve that decays exponentially;
For a damped oscillaion, the single-modal response signal qi(t) can be expressed as:
By comparing 14) and (15), we can obtain:
The damping ratio of the signal is calculated as:
The modal parameter extraction of an electromechanical oscillation based on the SCA algorithm is shown in Figure 1:

FIGURE 1. Flow chart of SCA and the modal parameter identification.
5 Case studies
The proposed method has been tested on test signal, test system and real measurements. In this section, the experiments are carried out on an Intel Core i7 3.7 GHz computer with 16 GB of RAM. Additionally, our proposed method is coded by MATLAB.
5.1 Test signal analysis
The five single-mode oscillation signals shown in Eq. 18 are constructed with frequencies of 0.6 Hz, 1.1 Hz, 0.4 Hz, 0.8 Hz, and 0.2 Hz, in that order:
Using a three-dimensional random mixing matrix
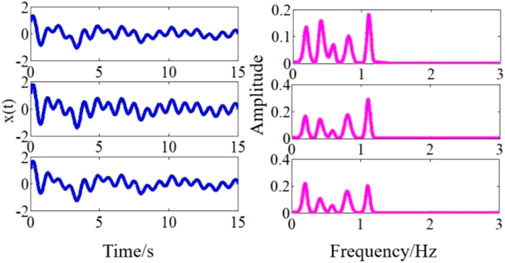
FIGURE 2. Test signal waveforms and their WFT spectrum.
Short time Fourier transform (STFT) is used to transform the three groups of test signals into time-frequency domain, and the window function is chosen to be a rectangular window of length 10s, and the window was shifted by four points each time. Figure 3 shows the scatter plot of the real part of the test signal x. From Figure 3, we can know that there are five obvious clustered straight lines, indicating that there are five source signals in the test signal x.
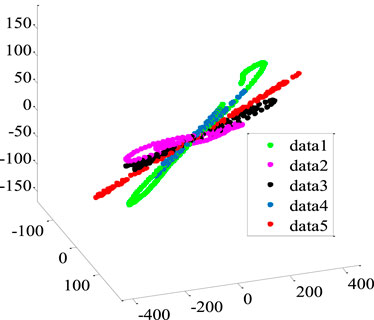
FIGURE 3. Diagram of clustering characteristics.
According to (6), the total energy of the three groups of test signals at each frequency point is calculated, and the frequency corresponding to each energy peak is detected using the frequency energy peak point method, as shown in Figure 4. The normalized clustering center of the five straight lines is calculated using the fuzzy C-mean algorithm, and the mixing matrix A can finally be accurately estimated as:
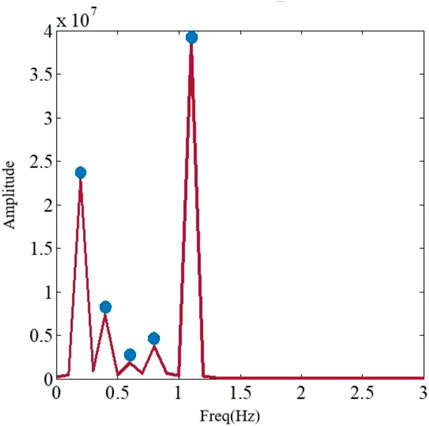
FIGURE 4. The peak plot in frequency domain.
The L1 norm minimization method was used to separate the five source signal components, and the time domain and frequency domain distribution of the five source signals is shown in Figure 5. As shown in Figure5, each component has the characteristics of periodic oscillation, and the calculated frequencies are basically the same as the actual frequencies. Meanwhile, the proposed algorithm decomposes the multi-modal coupled oscillation signal into multiple source signals with the single frequency, without modal aliasing. The detected frequencies are arranged in the order from low to high, which effectively solves the problem of uncertainty in the order of source signals.
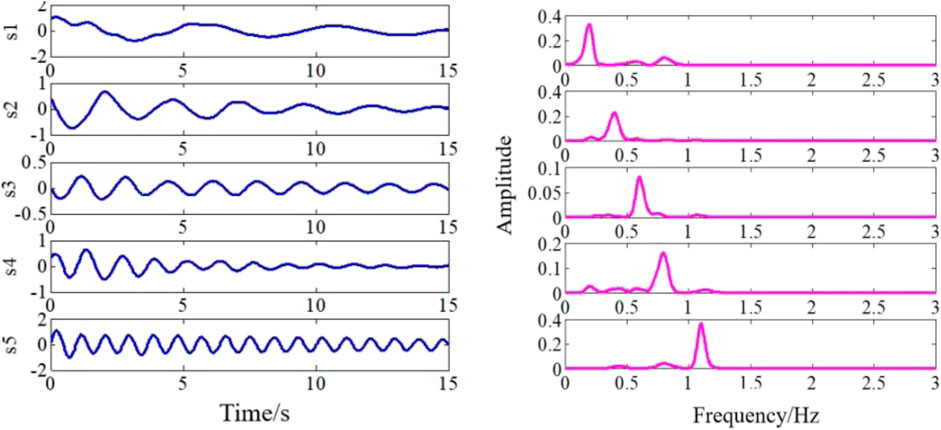
FIGURE 5. The separated source signals and their WFT spectrum.
Hilbert transform was utilized to extract modal parameters of the separated components, and the oscillation frequencies and damping ratios are obtained, as shown in Table 1. It can be seen from Table 1 that the results of the extracted modal parameters are quite close to their true values, indicating the effectiveness of the proposed method.
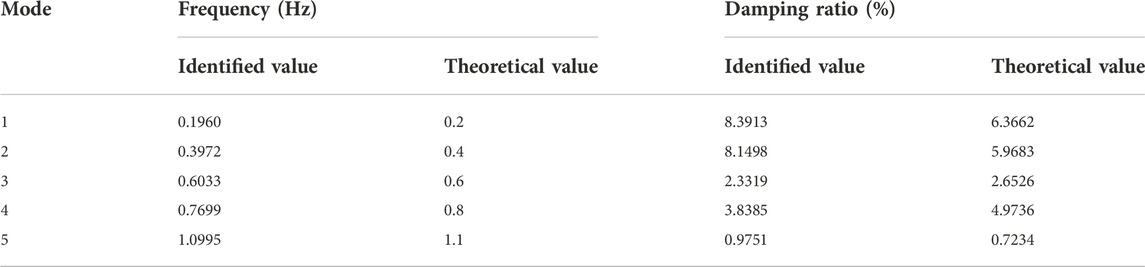
TABLE 1. Extracted modal parameters of test signal.
5.2 Modified IEEE 14-genertor 5-area test system
In this section, the modified IEEE 14-generater 5-area simplified system is used as an example (Ding et al., 2019), as shown in Figure 6. There are five areas in this system, but since area one is strongly coupled with area 2, the system can be considered to have four main areas, which are defined as Area 1, Area 2, Area 3, and Area 4, respectively. Area one contains five generators, namely G101, G201, G202, G203, and G204; Area2 contains two generators, G301, G302; Area3 contains four generators, namely G401, G402, G403, G404; Area4 contains G501, G502, G503. And two aggregated PMSG-based wind farms are connected to Buses 504 and 201, respectively in Figure 6. Furthermore, the parameters of the two wind farms are configured in accordance with Literature (Dejian et al., 2022a; Dejian et al., 2022b). Moreover, the active outputs of the SGs in the same area are reduced accordingly to keep the operating point the same as that before the SG reduction.
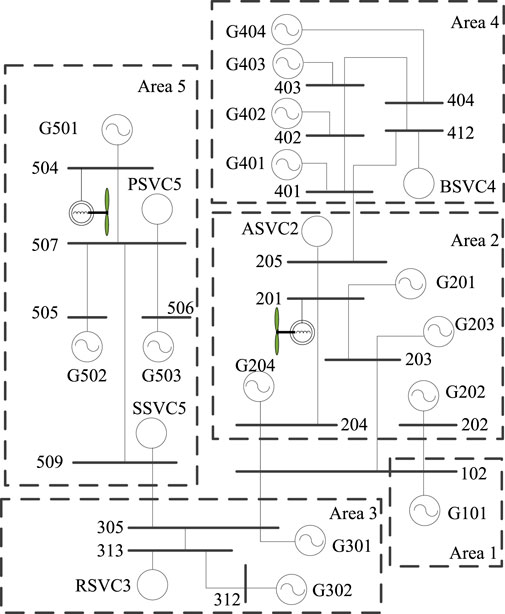
FIGURE 6. Single line diagram of simplified 14-generator system.
Inter-area mode is more likely to excite a poorly damped oscillation, which involves more generators and has a wide range of influence, so it is usually considered the mode of most interest. The 14-generator test system was linearized around an operating point, and small-signal stability analysis (SSSA) results show that the system has three inter-area modes. as shown in Table 2.
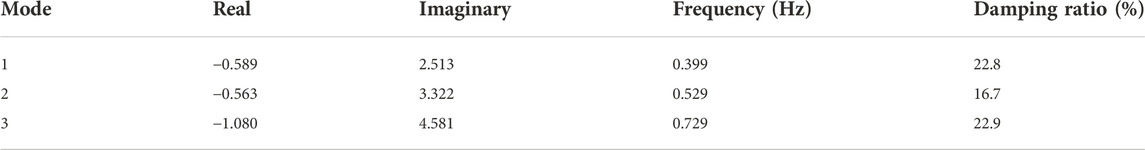
TABLE 2. The characteristic results of simplified 14-generator system.
In this paper, the rotational inertia of the generators in each area of the system is used as a quantitative index, and the angular frequency of the generator with the smallest rotational inertia in each area is selected as the input signal. Figure 7 shows the rotational inertia of each generator. According to the signal selection principle and the inertia results in Figure 7, generator G203 is selected as the representative of Area1, in which its inertia is lower than the other generators in the same area. Similarly, the signal of generator G301 is selected as representative of Area2, generator G401 is se-lected as representative of Area3, and generator G501 is selected as representative of Area4.

FIGURE 7. The rotational inertias of 14-generator system.
In order to verify the effectiveness of the proposed method for identifying the interarea modes, a representative two-phase grounded short circuit is applied at bus 506, the sampling frequency of 100 Hz and the sampling time is 50 s. And the simulation was carried out using power system toolbox (PST). The angular frequency of each generator within 10s after the fault is used as the input signal in this paper. The input signals of generator G203, generator G301, generator G401, and generator G501 were first detrended, and the time domain angular frequencies of these four generators were transformed into the frequency domain using WFT. Three interarea oscillation modes could be identified, with frequencies of 0.34 Hz, 0.51 Hz, and 0.68 Hz, respectively. Figure 8 shows the time-domain distributions and the corresponding frequency-domain distributions of the angular frequencies of the four generators.
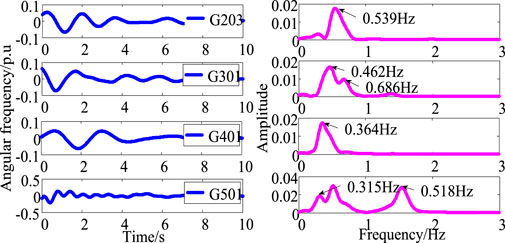
FIGURE 8. The waveforms of rotor speed of generators and their frequency domain.
The four input signals are decomposed using SCA algorithm, and three single-mode oscillation components can be obtained. The time-domain and frequency-domain distributions of each single-mode component are shown in Figure 9. HT was used to calculate the oscillation frequency and damping ratio, and the obtained modal parameter results were compared with WFT results and SSSA results, as shown in Table 3. From Figure3, we can know that all the three inter-area modal parameters can be extracted by using only four input signals of generator G203, G301, G401 and G501, which effectively saves calculation time.
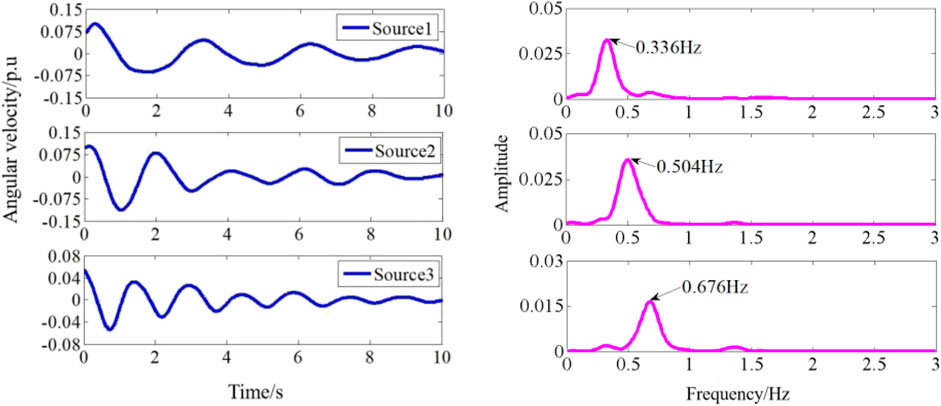
FIGURE 9. The separated single-mode components and their WFT spectrum.
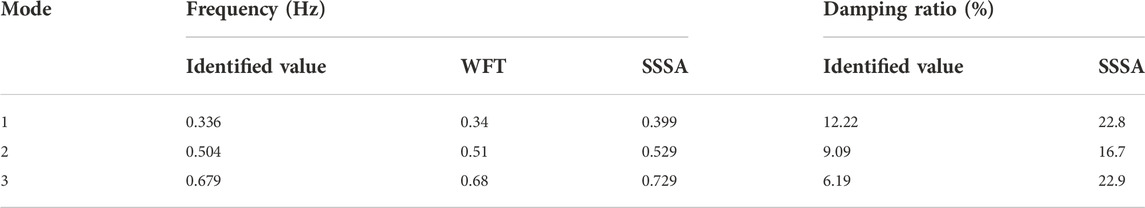
TABLE 3. Identified results with three different methods of simplified 14-generaror system.
While identifying the oscillation frequency and damping ratio of the system, SCA algorithm can also estimate the modal matrix utilizing the clustering characteristics.
The modal matrix is estimated as:
The mode shape corresponding to the three inter-area oscillation modes are shown in Figure 10. For Mode 1, generator 401 oscillates against generator 501. In this paper, the input signal is the representative of each region, so it can also be considered that mode one is the inter-area oscillation mode, with generator 401 in Area3 oscillates against generator 501 in Area4. By the same token, the oscillation area clusters of mode two is Area two and Area three against Area 4, the oscillation area clusters of mode three is Area two against Area 3. The estimated oscillation frequencies, damping ratios and mode shapes using the proposed method in this paper are summarized in Table 4.
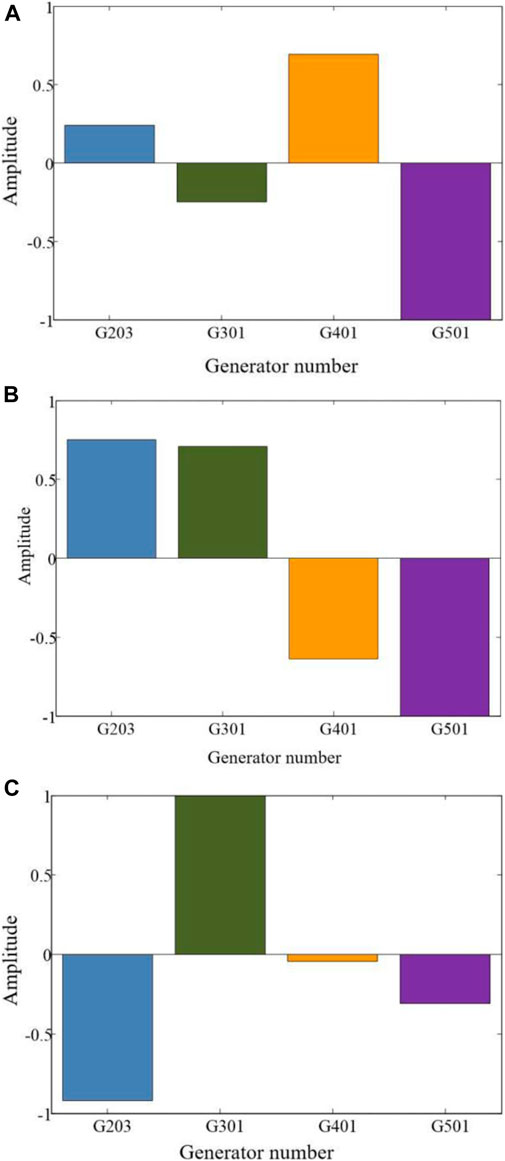
FIGURE 10. Normalized mode shapes.
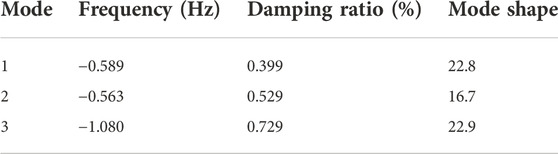
TABLE 4. Identified results of the simplified 14-generator system.
5.3 Test on the real measurements
In this section, a set of real PMU measurements from north power grid of China was used to further illustrate the adaptability of the algorithm in practical system. The system comprises two major areas connected through four 500-kV transmission lines. When the maintenance schedule requires, heavy power is delivered between the two areas, the electromechanical oscillation is one of the major threats to the power grid stability. The data are collected from four PMUs located in the two areas. The input signals were recorded for a duration of 15 s with the sampling frequency of 30 Hz. The time-domain oscillation waveforms and the corresponding frequency-domain distributions are shown in Figure 11. As can be seen from Figure 11, the practical power grid contains an inter-area oscillation mode with the frequency of 0.28 Hz.
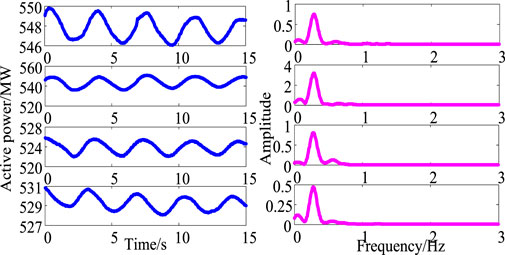
FIGURE 11. Active power oscillation signal in time and frequency domain.
The SCA algorithm was used to extract oscillation features from PMU measurement data, the decomposed time-domain source signals and their spectrum are shown in Figure 12. Then the HT algorithm was applied to the decomposed source signals to extract oscillation frequencies and damping ratios, as shown in Table 5. As can be seen from Table 5, the proposed method identified the oscillation mode with the frequency of 0.28 Hz, which is consistent with the spectrum analysis, and the corresponding mode shape is shown in Figure 13. From Figure 13, it can be seen that PMU2 is mainly involved in the oscillation of this mode.
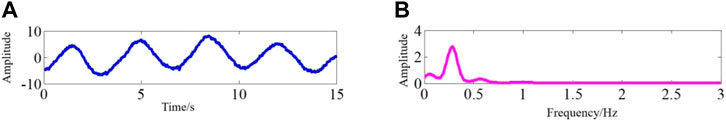
FIGURE 12. The decomposed waveform of active power and its spectrum. (A) The decomposed source signal (B) Spectrum of the source signal.
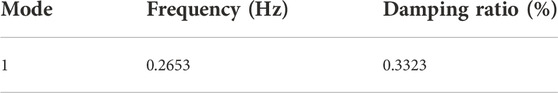
TABLE 5. Identified oscillation mode of active power oscillation signal.
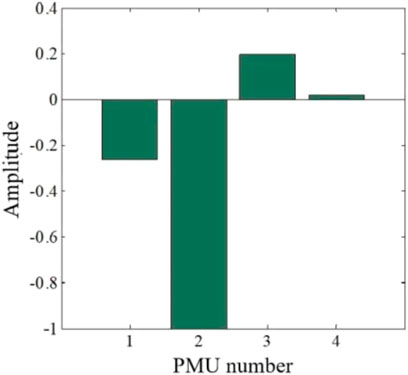
FIGURE 13. The identified mode shape of the actual power grid.
To sum up, it can be seen that the proposed algorithm in this paper can not only effectively extract the modal parameters from the test signal and the simulated signal, but also has good applicability to the real measured signal.
6 Conclusion
In this paper, an improved blind source separation algorithm based on sparse component analysis is proposed to extract electromechanical modal parameters in power systems. Test cases of simulation studies and PMU measured data can obtain the following conclusions:
First, the proposed algorithm decomposes the multi-modal coupled nonstationary oscillation signal into source signals with single frequencies, and the source signals are arranged in the order of oscillation frequency from small to large, which effectively avoids the problem of modal aliasing.
Second, the SCA algorithm reduces the original input measurement data by using the rotational inertia of the generator rotor in each area of the system as a quantitative index, which effectively reduces the calculation time and improves the analysis efficiency.
Third, the proposed method can extract the modal parameters from the multi-mode coupled oscillation signal, which can accurately reflect the inherent electromechanical characteristics of power systems, and provide a new idea for the analysis of the electromechanical oscillation.
The proposed algorithm is suitable for analyzing the mode-coupled oscillation signal of the interconnected power system, and provides a new idea for the extraction of electromechanical oscillation parameters.
Data availability statement
The raw data supporting the conclusions of this article will be made available by the authors, without undue reservation.
Author contributions
ZW and XL contributed to the conception and design of the proposed strategy. All authors wrote and edited the manuscript.
Funding
This project is funded by State Grid Jilin Company’s science and technology project “Weak inertia supports the research and application of key technologies for dynamic frequency security defense of sending-end power grids” (52234221000A).
Conflict of interest
ZW, XL, DL, and HZ were employed by State Grid Jilinsheng Electric Power Supply Company.
The remaining author declares that the research was conducted in the absence of any commercial or financial relationships that could be construed as a potential conflict of interest.
Publisher’s note
All claims expressed in this article are solely those of the authors and do not necessarily represent those of their affiliated organizations, or those of the publisher, the editors and the reviewers. Any product that may be evaluated in this article, or claim that may be made by its manufacturer, is not guaranteed or endorsed by the publisher.
References
Dejian, Y., Gan-gui, Y., and Taiying, Z. (2022). Fast frequency response of a DFIG based on variable power point tracking control. Jilin: IEEE Transactions on Industry Applications. early access.
Dejian, Y., Zhaoyang, J., Taiying, Z., and Jin, E. (2022). An adaptive droop control strategy with smooth rotor speed recovery capability for type III wind turbine generators. Int. J. Electr. Power & Energy Syst. 135, 107532. doi:10.1016/j.ijepes.2021.107532
Ding, H., Wang, Y., Yang, Z., and Pfeiffer, O. (2019). Nonlinear blind source separation and fault feature extraction method for mining machine diagnosis. Appl. Sci. (Basel). 9 (9), 1852–1905. doi:10.3390/app9091852
Donoho, D. (2006). For most large underdetermined systems of linear equations the minimal 1-norm solution is also the sparsest solution. Commun. Pure Appl. Math. 59 (4), 797–829. doi:10.1002/cpa.20132
Feng, S., Chen, J., and Tang, Y. (2019). Identification of low frequency oscillations based on multidimensional features and ReliefF-mRMR. Energies 12, 2762. doi:10.3390/en12142762
Gibbard, M., and Vowles, D. (2010). Simplidied 14-generator model of the SE Australian power system. Australia: The University of Adelaide.
Hauer, J. (2015). Application of Prony analysis to the determination of modal content and equivalent models for measured power system response. IEEE Trans. Power Syst. 6 (3), 1062–1068. doi:10.1109/59.119247
Jiang, T., Yuan, H., Jia, H., Zhou, N., and Li, F. (2015). Stochastic subspace identification-based approach for tracking inter-area oscillatory modes in bulk power system utilising synchrophasor measurements. IET Gener. Transm. &. Distrib. 9 (15), 2409–2418. doi:10.1049/iet-gtd.2015.0184
Jin, S. S., Jeong, S., Sim, S. H., Seo, D. W., and Park, Y. S. (2021). Fully automated peak-picking method for an autonomous stay-cable monitoring system in cable-stayed bridges. Automation Constr. 126, 103628–103638. doi:10.1016/j.autcon.2021.103628
Khosravi-Charmi, M., and Amraee, T. (2018). Wide area damping of electromechanical low frequency oscillations using phasor measurement data. Int. J. Electr. Power & Energy Syst. 99, 183–191. doi:10.1016/j.ijepes.2018.01.014
Kopse, D., Rudez, U., and Mihalic, R. (2015). Applying a wide-area measurement system to validate the dynamic model of a part of European power system. Electr. Power Syst. Res. 119, 1–10. doi:10.1016/j.epsr.2014.08.024
Lauria, D., and Pisani, C. (2014). On Hilbert transform methods for low frequency oscillations detection. IET Gener. Transm. and Distrib. 8 (6), 1061–1074. doi:10.1049/iet-gtd.2013.0545
Lv, H., Abuduwayiti, X., Meng, L., and Shi, C. (2021). Rapid power compensation-based VSC-hvdc control strategy for low-frequency oscillation suppression of the island power system. Front. Energy Res. 9, 768340. doi:10.3389/fenrg.2021.768340
Wadduwage, D., Annakkage, U., and Narendra, K. (2015). Identification of dominant low-frequency modes in ring-down oscillations using multiple Prony models. IET Gener. Transm. Distrib. 9 (15), 2206–2214. doi:10.1049/iet-gtd.2014.0947
Xue, L., Yunzheng, Z., Dominic, G., and Tao, L. (2022). Receding horizon control based secondary frequency regulation for power systems with wind energy integration. Int. J. Electr. Power and Energy Syst. 142, 108282. doi:10.1016/j.ijepes.2022.108282
Yang, D., Zhang, Y., Ge, M., Yi, C., and Liu, C. (2018). Improved tensor-based singular spectrum analysis based on single channel blind source separation algorithm and its application to fault diagnosis. Appl. Sci. (Basel). 7, 418. doi:10.3390/app7040418
Yang, D., Wang, B., Cai, G., Jin, M., and Sun, Z. (2020). Ambient-data-driven modal-identification-based approach to estimate the inertia of an interconnected power system. IEEE Access 8, 118799–118807. doi:10.1109/access.2020.3004335
Yang, Y., and Satish, N. (2013). Blind modal identification of output-only structures in time-domain based on complexity pursuit. Earthq. Eng. Struct. Dyn. 42 (13), 1885–1905. doi:10.1002/eqe.2302
Ye, F., Chen, J., Gao, L., Nie, W., and Sun, Q. (2018). A mixing matrix estimation algorithm for the time-delayed mixing model of the underdetermined blind source separation problem. Circuits Syst. Signal Process. 38 (4), 1889–1906. doi:10.1007/s00034-018-0930-5
Yi, C., Lv, Y., Dang, Z., Xiao, H., You, G., and Dang, Z. (2017). Research on the blind source separation method based on regenerated phase-shifted sinusoid-assisted EMD and its application in diagnosing rolling-bearing faults. Appl. Sci. (Basel). 7, 414. doi:10.3390/app7040414
Keywords: modal-coupling electromechanical oscillation, improved blind source separation, sparse component analysis, synchrophasor measurement, mode extraction
Citation: Wang Z, Lyu X, Li D, Zhang H and Wang L (2023) Oscillation mode analysis for multi-mode coupling power systems with high renewables penetration using improved blind source separation. Front. Energy Res. 10:998543. doi: 10.3389/fenrg.2022.998543
Received: 20 July 2022; Accepted: 25 July 2022;
Published: 05 January 2023.
Edited by:
Xue Lyu, University of Wisconsin-Madison, United StatesReviewed by:
Meng Chen, Aalborg University, DenmarkJiaxin Wen, Hong Kong Polytechnic University, Hong Kong SAR, China
Copyright © 2023 Wang, Lyu, Li, Zhang and Wang. This is an open-access article distributed under the terms of the Creative Commons Attribution License (CC BY). The use, distribution or reproduction in other forums is permitted, provided the original author(s) and the copyright owner(s) are credited and that the original publication in this journal is cited, in accordance with accepted academic practice. No use, distribution or reproduction is permitted which does not comply with these terms.
*Correspondence: Lixin Wang, d2FuZ2x4bmVkdUAxNjMuY29t