- 1Guangdong Provincial Freeway Limited Company, Guangzhou, China
- 2Department of Bridge Engineering, Tongji University, Shanghai, China
Natural environment has a great impact on the performance of bridge structures, such as the ambient temperature, solar radiation, climate extremes and so on. Due to the lack of regional pertinence in the provisions of the existing specifications on the temperature load standard, and the lack of verification of its adaptability of hollow slab beam bridge in the reconstruction and expansion project, it is necessary to study the temperature load of the beam based on the temperature data of the area where the bridge site is located. Based on the measured meteorological data, the cross-section temperature distribution characteristics of the hollow slab beam and the temperature load effect were investigated. The vertical temperature load model of the short and medium-span hollow slab beam was proposed according to the simplified temperature curve. Firstly, based on the annual measured meteorological data, the plane model was established to analyze the temperature distribution characteristics of the hollow slab beam. Secondly, according to the temperature field distribution of the beam cross-section, the solid model of 16 m hollow slab beam was established to analyze the distribution of the temperature load effect. Finally, based on the preliminarily proposed temperature curve, vertical temperature load models were proposed by introducing the theory of extreme value extrapolation. The studies have shown that the temperature of the hollow slab beam is approximately horizontal distributed, and temperature extreme value appear at the location of the beam web. The roof and floor of the hollow slab beam are compressed and the webs are tensioned in the positive temperature difference state, the stress condition is opposite under the negative temperature difference state. The positive and negative temperature load models can meet the extrapolation requirements of the bridge design reference period. This study innovatively proposed a temperature load model based on the temperature curve corresponding to the most unfavorable effect of the beam. The extrapolation idea in the derivation of vehicle load model is introduced as well. And a temperature load model suitable for the extension of hollow slab bridges in Guangdong is established in this study.
Introduction
Bridge structures are affected by various kinds of natural environment action in practical engineering applications, such as solar radiation, wind load, ambient temperature, seismic action and so on (Kim et al., 2017). Solar radiation has a vital role in the rise of structural surface temperature, while the atmospheric convection leads to the loss of surface temperature (Asamoto et al., 2011). In addition, the structural temperature will also change periodically with the periodic change of environmental temperature. Since the bridge structure is always subjected to complex environmental effects, it is essential to assess the impact of environmental thermal effects on the structure itself (Nandan and Singh, 2014). However, medium and small span bridges on highways are mainly subjected to two types of variable loads, vehicle live action and temperature action (Venglár and Lamperová, 2021). And the temperature action is directly affected by climatic conditions (Shan et al., 2018). In addition, due to the large differences in climate in different regions, some adaptability problems exist in current specification for temperature loads (Sheng et al., 2022).
Several studies have been conducted on temperature load models of different types of structures in different region (Jiang and Yuan, 2012; Yuan and Jiang, 2012; Ma et al., 2017). He J. et al. (2021) studied probabilistic modelling of temperature loading based on a PC girder bridge, the temperature distribution was studied based on the proposed heat transfer model and probabilistic models were established. Based on this research conclusion, the proposed temperature loading model can be applied to predicting temperature load of studied bridge. However, the temperature date adopted in this study is the random day in one year, the adaption of data may have certain randomness, which cannot fully reflect the general law of temperature load effect. Lin et al. (2020) conducted research on the temperature distributions of different types of box girder. Measured temperature, ambient temperature method, mean temperature method and air element method are applied to analysis the internal thermal boundary condition of box girder cross section. It can be concluded that little difference exists between the results simulated by different methods. In addition, vertical temperature gradients for the bridge deck surface specified in the bridge design specifications of China JTG D60 is relatively lower than actual condition. While only the temperature distribution of box girder was investigated in this study, the analysis of temperature effect was ignored, further research is needed. Sheng et al. (2020) studied the temperature distribution of 30-m small radius curved concrete box girder bridges, the sunlit-shaded areas in bridge structure was fully considered in this study, several conclusions have been drawn in this study. It is found that the vertical temperature distribution is mainly concentrated in the depth range of 40 cm from the top surface of the box girder, and the temperature in other heights can be considered to have no significant change. Hagedorn et al. (2019) investigated the temperature gradient of concrete I-girders, and temperature gradient experiments were conducted under the natural environment condition. It can be concluded that uneven heating of bridge girder sections is the direct cause of nonlinear temperature gradients, and the shape of the girder has greatly influence on the temperature gradient. When the daily temperature changes greatly, the temperature gradient obtained on that day corresponds to the extreme working condition of girder.
The analysis of the existing research results shows that temperature gradient is measured by arranging temperature sensors in the beam, the finite element model is also applied to simulate the temperature field by changing the boundary conditions. However, this method ignored the influence of external natural meteorological factors, and the test cycle of beam temperature may be relatively short. In addition, only the temperature field of beam section is studied in most studies, the related research on the most unfavorable temperature effect caused by the temperature field is ignored.
The provisions of temperature load in the existing design specifications are formulated nationwide. However, due to the large differences in temperature characteristics in different regions of China and the relative universality of the specifications, the design requirements of temperature load in the specifications are relatively low. Therefore, further research needs to be carried out in specific regions. In addition, the temperature load model specified in the specification is formulated for different cross-section beams, which may not be applicable to hollow slab beam bridges with additional integral layers in the reconstruction and expansion project. Therefore, it is necessary to carry out the adaptability research of the temperature load model for the hollow slab beam bridge in the reconstruction and expansion project, and recommend the temperature load model of the hollow slab beam suitable for the bridge site area. In this paper, the vertical temperature gradient of the medium and small span hollow slab beam is studied. In order to study the temperature load model suitable for hollow slba beam bridge in the reconstruction and expansion project, the vertical temperature distribution characteristics of the hollow slab beam are studied based on the measured meteorological data. And the measured temperature and the finite element simulation results are compared to prepare the study of temperature effect. Through the load effect analysis based on the long-term test of temperature field and meteorological data, the temperature load model of the hollow slab was proposed which can meet the design reference period of 100 years.
In the existing research, the temperature model is mostly based on meteorological data acquired in a certain day or a short period of time, which has a certain randomness. However, this paper studies the temperature field of hollow slab beam based on the meteorological observation data for up to one year. In addition, the influence of cavity effect of hollow slab beam and the influence of integral layer thickening in the reconstruction and expansion project are considered as well. In this study, through the introduction of measured meteorological data and measured beam temperature data, the established finite element model is more consistent with the local actual situation. Compared with the method of establishing temperature model based on the time of maximum temperature difference in traditional research, the temperature load model established in this study is based on the time of beam with maximum temperature effect. The proposed model can be more conducive to the calculation of temperature effect of hollow slab beam. In addition, the extreme value extrapolation theory in the study of vehicle load is introduced in this study to ensure the safety of bridge structure in the design cycle. This study proposes a more precise and applicable temperature load model, which can provide a more scientific basis for the utilization, reinforcement and maintenance of old bridges in the reconstruction and expansion project.
Basic principles of temperature field calculation
Temperature field and its boundary conditions
In bridge engineering, the transient temperature field presents the characteristics of multi-dimensional distribution in space (Sousa et al., 2018), it can be expressed by using Fourier transform as Eq. 1.
Where: T denotes temperature; x, y and z is space coordinates; t represents time; ρ is the density; c is material specific heat; and k is thermal conductivities.
The heat conduction equation can be established based on the Fourier law (Nandan and Singh, 2014; Narasimhan, 1999). Transient temperature field can be solved by the heat conduction equation, as shown in Eq. 2. However, it is difficult to solve the partial differential equation for the complex structure. The finite difference method or finite element method should be applied.
Where: k denotes the thermal conductivity, ρ is the density, c represents the specific heat capacity, and Q is expressed by internal heat source function.
The initial temperature information needs to be determined in the process of solving differential equation of Eq. 2, and the following boundary conditions should be confirmed as well.
(1) The first boundary condition: the temperature at different positions of the structural surface changes with time, and it can be expressed as Eq. 3.
Where: Γ denotes the outer boundary.
(2) The second boundary condition: variation of heat flux on concrete surface as shown in Eq. 4.
Where: q2 is the density for surface heat flux, and its value is generally positive.
Where, qs and qe represent the radiation absorbed from solar and other objects, respectively. αR is radiation absorption rate, R denotes the radiation intensity, and e is the radiation emissivity. σ is the blackbody radiation constant, and it should be taken as 5.67 × 10⁻⁸ W/(m2·K4). F denotes the shape coefficient, and To represents the temperature of the irradiated object. The unit of temperature in the equation should be taken as K.
(3) The third type boundary condition: for the law of convective heat transfer on the known object surface, it can be expressed as Eq. 6.
Where, h denotes the convection heat transfer coefficient, and Tf represents fluid temperature.
Calculation theory based on continuous meteorological data
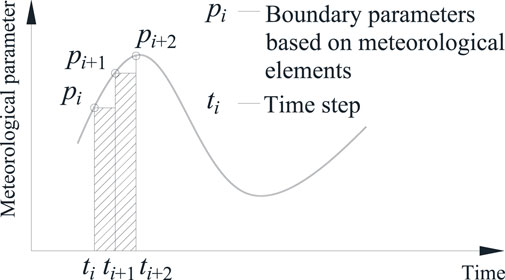
In very short periods of time, meteorological data generally do not change significantly. When the temperature field is calculated using the meteorological data measured within a short time interval, it can be considered that the calculated results are close to the actual temperature field distribution based on the differential correlation principle (Jia and Xiong, 2017). That is to say, the meteorological boundary conditions in the period of ti to ti+1 is considered to be equal to the value of pi at time of ti, as shown in Figure 1. In the case of high-density measured data, the research on the values of initial conditions and boundary conditions can be realized.
Relevant research shows that the ambient temperature can be taken as the structural temperature for concrete structure when calculating the temperature field at the moment of t0. After the calculation of continuous temperature field is completed, only the convergent calculation results are regarded as effective results.
In addition, boundary conditions of bridge structures mainly include external environment, heat transfer conditions between environment and structure (Zhou et al., 2017).
External environment
The external environment is mainly continuous meteorological parameters collected hourly or shorter time interval. The parameters include temperature, radiation intensity, wind direction, wind speed, solar altitude angle and solar azimuth angle (Yan et al., 2018). Among them, temperature, radiation intensity and wind speed can be directly measured by small weather stations. And the solar elevation angle and solar azimuth angle can be calculated by ASHRAE model as follows (Yao et al., 2020).
Solar Elevation Angle h can be calculated by Eq. 10.
Where: h denotes the height angle, which is the angle with the horizontal plane, and its unit is degree. t and δ are respectively the time angle and solar latitude angle, and their unit are degree. φ represents the latitude of location.
Solar Azimuth Angle A can be calculated by Eq. 11.
Where: A denotes the azimuth angle, which is the angle with the south direction, and its unit is degree.
Heat transfer conditions between environment and structure
This boundary conditions mainly include convection boundary and radiation boundary when calculating the temperature field of bridge engineering (Dogonchi and Ganji, 2016).
For normal concrete structure, convection coefficient is mainly affected by wind speed, and it can be calculated as follows:
Where: hc,i denotes total convective heat transfer coefficient of normal concrete at the time step of i. vi represents average wind speed at the time step of i.
While for the asphalt concrete, the convection coefficient is determined by wind speed, asphalt surface temperature and air temperature (Han et al., 2020). Convection coefficient of asphalt concrete can be calculated by the following equation.
Where: hr,i denotes total convective heat transfer coefficient of asphalt concrete at the time step of i. is the calculated surface temperature of asphalt concrete at the time step of i. Ta,i represented the atmospheric temperature at the time step of i.
The radiation intensity of bridge structure mainly includes the sunlit side and shaded side (Yan et al., 2018). Total radiation intensity should only be considered for sunlit side, and ground reflection radiation intensity should be considered for the shady side. Therefore, equivalent temperature of structure caused by radiation intensity can be calculated by Eq. 14.
Where: T’a,i is th equivalent temperature at the time step of i.
In fact, the photosensitive elements of radiation test sensors are always arranged horizontally. That is to say, their normal direction is generally consistent with that of the structural surface. In the process of testing the meteorological parameters of bridge structures, test sensors are generally arranged on the surface of the structure. Thus, for the sensors arranged on the upper and lower surfaces of structure, the radiation intensity obtained can be directly adopted. While for sensors arranged on the side of structure, the radiation intensity obtained should be converted according to the inclination angle of the side wall and the solar altitude angle. The conversion formula is as follows.
Where: R’i is the radiation intensity of the side wall, α denotes the solar altitude angle, β represents the angle between the wall and the horizontal plane.
When analyzing the temperature field of practical engineering, the accuracy of temperature calculation often depends on whether the parameters are accurate. As concrete is a kind of mixed material, its thermal and mechanical parameters are related to components and curing conditions. Both thermal and mechanical parameters have high uncertainty, which affects the prediction accuracy of temperature effect.
According to the calculation theory of heat transfer, the solution of temperature field needs to provide necessary thermal parameters. It is divided into material parameters and boundary parameters. Among them, the material parameters include density ρ, thermal conductivity k, specific heat capacity c, heat generation Q, radiation absorption rate αR, and radiation emissivity ε and so on. Boundary parameters include: initial temperature T0, radiation R, fluid temperature Tf, radiation solid temperature T, convective heat transfer coefficient h and so on. Among the above parameters, except that density ρ, initial temperature T0, fluid temperature Tf and radiated solid temperature T can be obtained by simple test method, other materials or boundary parameters need to be completed by complex test methods or test equipment.
Fitting of meteorological parameters of temperature field
Setup of continuous observation
The actual distribution of the temperature field of the hollow slab beam should be studied, and the relevant temperature field calculation parameters should be determined (Wang et al., 2015). Meihua Bridge Expansion Project in Maozhan highway is researched in this paper. The temperature field of hollow slab beam is measured, and the mid-span section of the hollow slab beam is selected. The temperature of slab beam is obtained by the embedded temperature sensor. The temperature sensor is arranged in advance before concrete pouring. The arrangement of temperature measuring points is shown in Figure 2A. After the beam reinforcement cage binding is completed, the temperature acquisition device is arranged as shown in Figure 2B. The temperature acquisition device is powered by solar panels, and the monitoring frequency is 60 min/time.
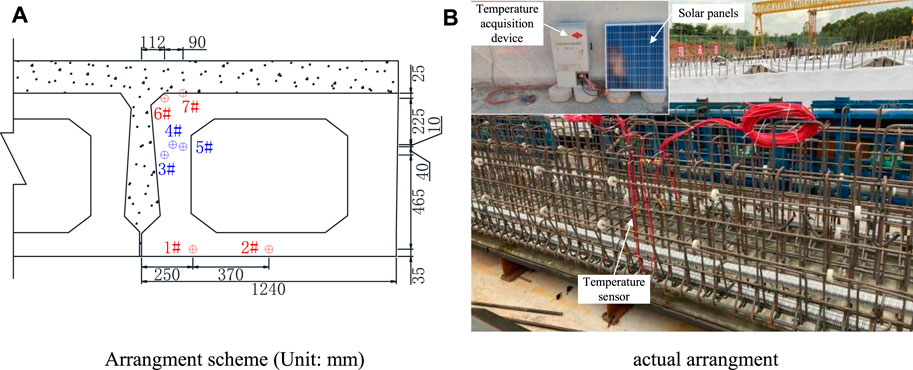
FIGURE 2. Arrangement of the temperature measuring points. (A) Arrangment scheme (Unit: mm). (B) Actual arrangment.
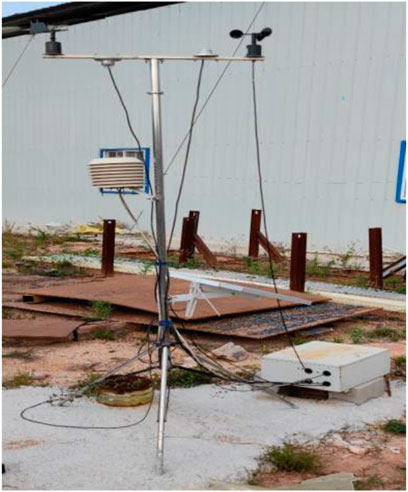
The temperature field of hollow slab beam is affected by environmental temperature, atmospheric radiation, wind speed and other factors. Meteorological stations are arranged near the bridge site (110.8°E, 21.58°N) as shown in Figure 3. Temperature, radiation and wind speed data around the bridge site can be obtained, and the continuous monitoring frequency is 10 min/time.
Due to that the meteorological stations and beam temperature data acquisition devices are arranged in the field, there are power outages and data acquisition interruptions in the acquisition process. The time distribution of the data collected is shown in the Table 1. Since the material and thermal conductivity of the hollow slab beam will not change after construction, the temperature calculation parameters will not change as well. In the fitting process of the temperature calculation parameters of the hollow slab beam, the temperature field of the hollow slab beam is mainly simulated by using the meteorological data, and the beam temperature measured data are only used to verify the fitting effect. Therefore, although the beam temperature data are only distributed in spring and winter, the calculation parameters of the beam temperature field determined by the annual meteorological data fitting will not be significantly affected.
Temperature field simulation based on continuous meteorological observation
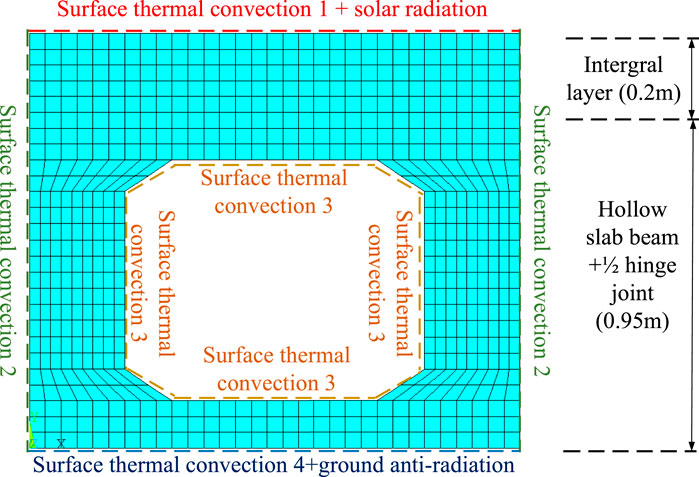
Due to the influence of construction progress, when collecting the temperature data of the hollow slab beam, the hollow slab beam bridge only completes the laying of the integral layer. Therefore, the temperature simulation finite element model of hollow slab beam is established according to the actual construction situation of Meihua Bridge as shown in Figure 4. The finite element analysis model mainly includes two parts: hollow slab beam and integral layer. The concrete grade of hollow slab beam and integral layer is C50, but they are poured separately. The elastic modulus of C50 concrete is 3.45 × 10⁴ MPa, and the density is 2,600 kg/m3.
In order to facilitate grid division and simulation, the hollow slab beam part is simulated by rectangular section with considering the actual situation of the structure. That is to say, both sides of the hollow slab beam contain 1/2 hinge joint area. The thickness of integral layer is 0.2 m. The height of hollow slab is 0.95 m, and the width is 1.24 m. The thickness of roof, web and floor are 0.12, 0.24 and 0.12 m, respectively. The finite element analysis model is established by the simulation software ANSYS, and the element type adopted is PLANE 55.
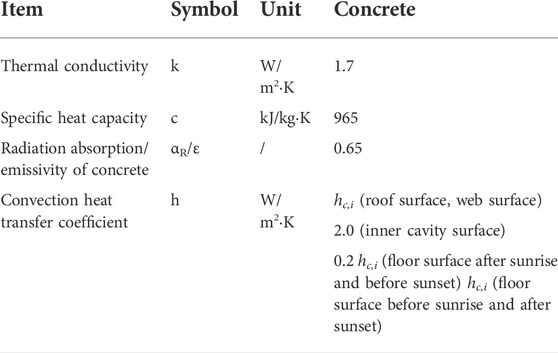
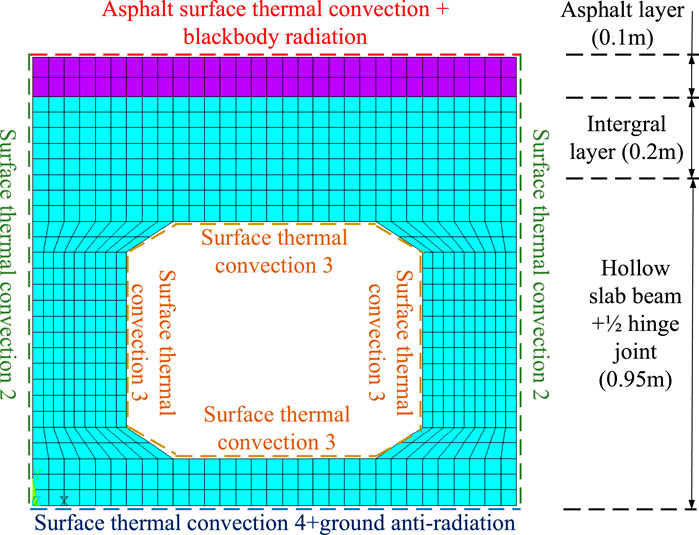
According to the actual construction condition of hollow slab beam, the temperature field of hollow slab beam at different times is simulated. The boundary conditions of slab beam at different times is shown in Table 2. Before sunrise and after sunset, the temperature change of hollow beam is mainly caused by surface thermal convection. The heat dissipation of surfaces is different, which is mainly reflected in the difference of convection coefficient in the finite element model. For the inner cavity of slab beam, the convection coefficient is generally relatively small due to the obstruction of air flow. While after sunrise and before sunset, the influence of solar radiation should be considered for the top of the integrated layer, and the influence of ground anti-radiation should be considered for the floor of hollow slab beam as well. In addition, the change of ambient temperature should be considered throughout the simulation process as well.
Determination of calculation parameters of hollow slab beam
Typical points of the roof (Measuring Point 7#), web (Measuring Point 4#) and floor (Measuring Point 1#) of the hollow slab beam were selected to fit the calculation parameters of hollow slab temperature field. Based on the measured meteorological data, the temperature field of hollow is calculated by using the established finite element numerical model. The calculation parameters are fitted by adjusting thermal conductivity, specific heat capacity, radiation absorption and emissivity of concrete, convection heat transfer coefficient, and so on. The temperature at the key points is extracted and compared with the measured temperature curve at the corresponding position as shown in Figure 5. Due to that the initial boundary condition adopted in calculation model of this study is the ambient temperature, the structural temperature needs to gradually increase and converge through the ambient temperature when the calculation starts from the initial calculation step. This process is generally about 72 h. Therefore, the first 72 h of the calculated temperature results are rejected.
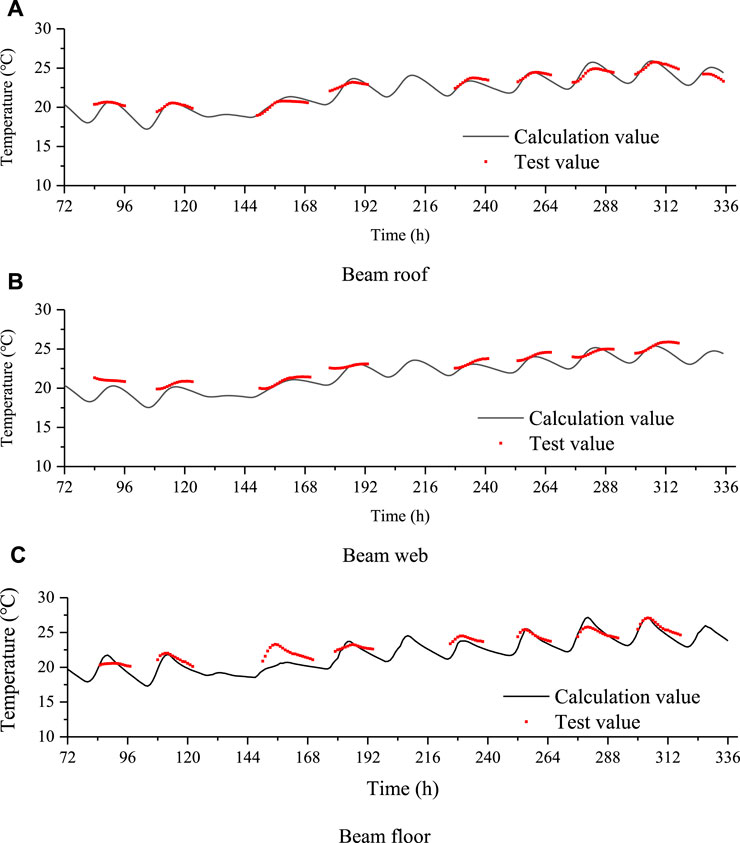
FIGURE 5. Fitting effect of temperature field calculation parameters. (A) Beam roof. (B) Beam web. (C) Beam floor.
By comparing the measured values and calculated values of the roof, web and floor in Figure 5, the deviation is basically between ±2°C. Among them, the temperature deviation of the roof measuring point is 100% within ± 2°C, while the probability of the temperature deviation of the web and floor measuring points less than ± 2°C is 96.9 and 93.8% respectively. The proportion of the deviation between the test value and the calculated value of the roof, web and floor is less than ±1°C is 90.5%, 78.9 and 69.5% respectively. It can be seen from the comparson that the calculation deviation of the floor is slightly larger than that of other parts, and the simulation effect is best for roof in this model. This is due to that the temperature change of the roof is mainly affected by solar radiation and environmental convection. The thermal properties of concrete materials are highly linear with this kind of meteorological parameter, and the prediction accuracy is relatively higher. Due to the influence of ground anti-radiation and other factors, the coupling effect between the floor and environmental convection and other factors cannot be considered in the display calculation method. Therefore, there is a certain deviation in the temperature simulation of beam floor, but the simulation result is still within the acceptable range. The finite element model proposed in this paper can be adopted to simulate the temperature field of hollow slab beam. The main calculation parameters determined after fitting are shown as Table 3.
Temperature field simlulation of slab beam
Finite element analysis model
In order to study the temperature field of hollow slab beam bridge, it is necessary to calculate the temperature distribution of hollow slab beam section at each time based on the annual measured meteorological data. Combined with the actual bridge structure under service condition, asphalt pavement layer with thickness of 0.1 m is added to the proposed finite element model, as shown in Figure 6. The finite element analysis model is established by the simulation software ANSYS, and the element type adopted is PLANE 55 as well. The density of C50 concrete and asphalt concrete is 2,300 kg/m3 and 2,600 kg/m3 respectively.
Due to the existence of asphalt at the top of the hollow slab beam, the boundary condition of top of asphalt layer after sunrise and before sunset is mainly the blackbody radiation on asphalt layer (He Z. Q. et al., 2021). While the boundary condition before sunrise and after sunset mainly include surface thermal convection of asphalt layer, which is different from the boundary of top surface of integral layer. Therefore, only the boundary condition of Top surface of asphalt layer after sunrise and before sunset are different from that model without asphalt layer. For asphalt concrete, the thermal conductivity is equal to 1.2 W/m2·K and the specific heat capacity is taken as 920 kJ/kgK.The radiation absorption/emissivity of asphalt concrete is taken as 0.85, and the convection heat transfer coefficient is equal to 2.0 hr,i. The boundary condition of the model with asphalt layer is shown as Table 4.
Analysis of temperature field distribution characteristics of hollow slab beam
Temperature field distributions of hollow slab beam under the maximum positive and negative temperature difference conditions are extracted as shown in Figures 7C,D. According to the simulation result, it can be learnt that the temperature field distribution of hollow slab is characterized by horizontal stratification and symmetrical distribution. Generally, the temperature of each point at different heights can be extracted, and the average value can be calculated to represent the temperature at each height of slab beam. Temperature extraction method of the simplified gradient temperature curve is shown in Figure 7A. However, this temperature curve calculation method is relatively complicated. Considering that the distribution characteristic of the temperature field of hollow slab beam, temperature curve of web centerline is selected to represent the average temperature at the corresponding height. Temperature extraction method of the temperature curve of web centerline is shown in Figure 7B. Both simplified gradient temperature curve and temperature curve of web centerline are recognized as simplified temperature curve in this article. Therefore, the simplified temperature curve under the maximum positive and negative temperature difference conditions are compared in Figures 7C,D. It can be seen that the two simplified temperature curves in the roof and floor regions of the hollow slab beam are basically close, while the two simplified temperature curves in the web height region are slightly different, which is mainly caused by the small web thickness of the hollow slab beam.
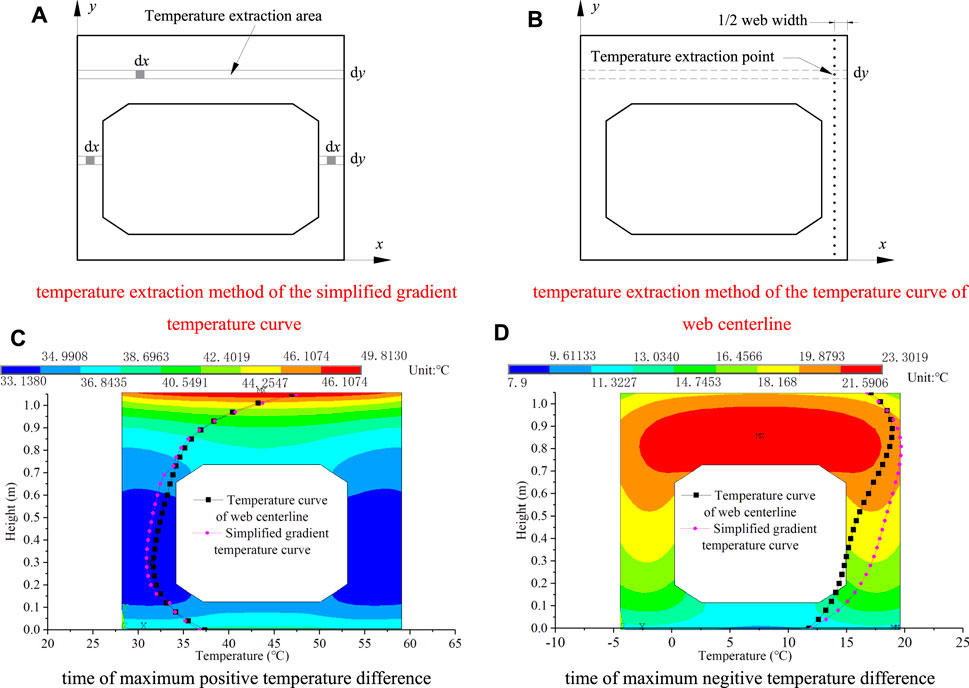
FIGURE 7. Temperature extraction method and temperature field distributions at time of maximum temperature difference (without asphalt layer). (A) temperature extraction method of the simplified gradient temperature curve. (B) temperature extraction method of the temperature curve of web centerline. (C) time of maximum positive temperature difference. (D) time of maximum negitive temperature difference.
In order to verify the rationality of the simulation results of the temperature field of the hollow slab beam, temperature curve of web centerline is compared with the temperature load model specified in the different specifications, as shown in Figure 8.
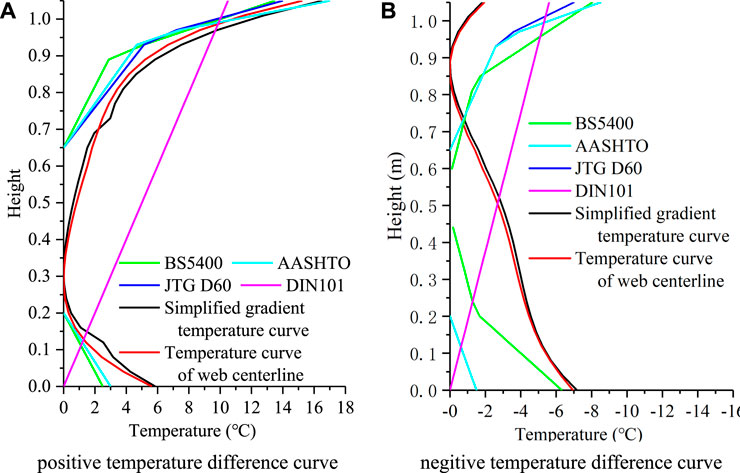
FIGURE 8. Comparsion of temperature curve of web centerline with other temperature load model. (A) positive temperature difference curve. (B) negitive temperature difference curve.
The comparison results show that for the positive temperature difference curve, the temperature curve calculated in this paper is close to other temperature load model in the range of the hollow slab beam roof. Within the range of hollow slab beam floor, the curves calculated in this paper are slightly larger than those specified in American specification AASHTO and British specification BS5400. However, the positive temperature difference curve at the position of the web is not considered in several specifications. It is unreasonable to apply this kind of curve to characterize medium and short span bridges with small beam height, such as the hollow slab beam structure. In addition, the non-linear distribution of temperature difference is not considered in German specification DIN101, which is quite different from the actual situation.
While for the negative temperature difference curve, the negative temperature difference variation in the range of hollow slab roof is smaller than that in the range of web and floor is considered in the temperature curve calculated in this paper. Besides, the change rate of temperature difference in the beam floor is smaller than that in the range of beam roof. It is regarded in many specifications that the rate and amplitude of temperature decreasing in the beam roof are significantly greater than those in floor. However, such temperature change situation exist in the rapid large-scale heating after continuous cooling, such as fire, which is obviously not consistent with the change law of natural weather. Even the temperature decreasing of the beam floor is not considered in the Chinese specification JTG D60, which obviously does not conform to the actual temperature field distribution of the hollow slab beam.
Therefore, it is necessary to further study the vertical temperature load model of hollow slab beam according to the actual load effect of beam by using the temperature field distribution characteristics.
Temperature effect analysis of slab beam
Basic analysis theory
The initial strain is produced by temperature, and the stress effect is produced under constraint boundary condition (Wang et al., 2015). The initial strain is calculated by Eq. 16 as follows.
In which: ε0 denotes initial strain, α is the linear expansion coefficient, ΔT represents temperature variable.。
For the complex temperature difference effect, it is often considered as a space or plane problem (Yan et al., 2018). Taking the space problem as an example, the temperature stress can be calculated according to Eqs (17) to 20).
In which: {ε} and {σ} are the element strain matrix and the element stress matrix respectively. [D] and [B] denotes the elastic matrix and the strain matrix respectively. {P}e is the node load generated by the initial strain, and [K] represents the stiffness matrix of the whole structure.
Temperature effect analysis
In the existing specifications, the temperature field distribution law of the beam is generally applied to establish the temperature load model (Wang et al., 2020). However, this method has some limitations. The finite element model of hollow slab should be established, and the temperature load effect should be further analyzed and calculated by using the actual temperature field as shown in Figure 9A. The finite elemnt analysis model is established by the simulation software ANSYS, and the element type adopted is SOLID 65. The density of C50 concrete is 2,600 kg/m3, the elastic modulus is 3.45 × 10⁴ MPa, the Poisson ratio is 0.167, the density is 2,600 kg/m3, and the linear expansion coefficient is 1 × 10⁻⁵. The temperature field data obtained in the above plane model is adopted to calculate the temperature load effect of the hollow slab beam at each time. The boundary of the model is set as four-point simple supported. Mid-span section is selected to analyze the stress at maximum temperature difference time, and the analysis results of mid-span section at maximum temperature difference time is shown in Figures 9B,C.
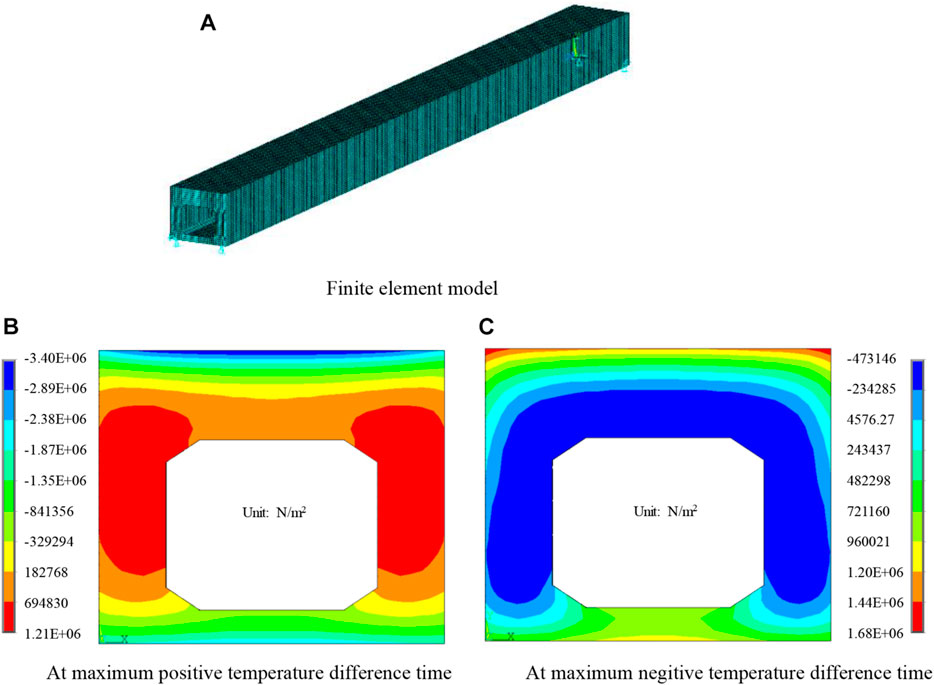
FIGURE 9. Temperature effect calculation model of 16 m hollow slab beam (without asphalt pavement) and stress analysis results. (A) Finite element model. (B) At maximum positive temperature difference time (Unit: N/m2). (C) At maximum negitive temperature difference time (Unit: N/m2).
It can be seen from the calculation results that the maximum longitudinal compressive stress of the beam roof at the time of the maximum positive temperature difference is −3.40 MPa, and the maximum longitudinal tensile stress of the floor is 0.38 MPa. The maximum longitudinal compressive stress of the hollow slab beam roof at the maximum negative temperature difference is −2.50 MPa, and the maximum longitudinal tensile stress at the floor is 0.40 MPa. The extreme values of compressive stress on the roof and tensile stress on the floor should be focused on for simply supported hollow slab beams. However, the maximum temperature difference time does not completely correspond to the most unfavorable situation of hollow slab beam.
The temperature effect calculation results at the time of maximum compressive stress existing in beam roof and maximum tensile stress exsiting in beam floor are plotted in Figure 10. It can be seen that the distribution of stress contours is relatively uniform. The stress distribution characteristic is similiar to the temperature field distribution, and it is also basically horizontal distributed. The maximum longitudinal compressive stress of roof at the time of maximum stress exsiting in beam roof is 3.66 MPa, and the maximum longitudinal tensile stress of the beam floor at the time of maximum stress existing in beam floor is 1.68 MPa.

FIGURE 10. Temperature effect of hollow slab beam at time of maximum stress (Unit: N/m2). (A) At time of maximum compressive stress existing in beam roof. (B) At time of maximum tensile stress existing in beam floor.
Considering that the temperature field distribution of the hollow slab beam generally presents the distribution characteristics of horizontal stratification, the temperature curve of web centerline and the simplified gradient temperature curve are applied to calculate the temperature effect of hollow slab beam. The moments of maximum compressive stress existing in beam roof and maximum tensile stress existing in beam floor are selected for comparison. The stress of beam roof and floor obtained by the calculated temperature field, the temperature curve of web centerline and the simplified gradient temperature curve are compared in Figure 11.
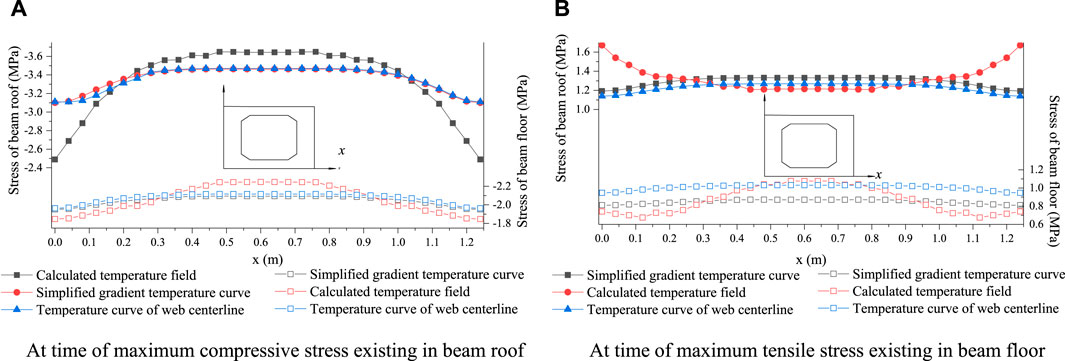
FIGURE 11. Comparsion of temperature effect calculated by actual temperature filed and differernt simplified temperature model. (A) At time of maximum compressive stress existing in beam roof. (B) At time of maximum tensile stress existing in beam floor.
Several conclusions can be conducted from the comparison of the temperature effect results calculated by temperature field and different simplified temperature curves. The longitudinal stress obtained by the simplified temperature curve is more evenly distributed along the transverse section. In a certain range on both sides of the hollow plate, the longitudinal stress of the hollow plate calculated by the temperature field is less than that calculated by the simplified temperature curve. It is mainly due to the actual temperature field at the corners of hollow slab beam are relatively low, while the simplified temperature model is relatively ideal. For the middle area of the hollow slab beam roof, the longitudinal stress calculated by each model are roughly similar. For the middle area of the hollow slab beam floor, the longitudinal stress calculated by the simplified temperature curve is more evenly distributed. The longitudinal stress of beam calculated by the two simplified temperature models are within the range of result calculated by the actual temperature field. In addition, the stress values obtained by temperature curve of web centerline are higher than those obtained by the simplified gradient temperature curve. It is more conducive to ensure the safety of bridge structure in engineering design. Therefore, it can be considered that the temperature curve of web centerline is more reliable to calculate the temperature load effect of beam roof and floor.
Temperature load model presumption of slab beam
Extrapolation principle of temperature load effect
According to extreme value theory (Falk et al., 2011), assuming that random variables X1, X2, ..., Xn are independent of each other. And they can meet the same distribution function F(X). Let Mn equal to { X1, ..., Xn}, then if sequence an > 0 exists and bn ∈ R, Pr{(Mn - bn)/an ≤ x} will tend to G(x) when n tends to ∞.
The cumulative probability distribution function of extreme values can be expressed as follows:
Where: μ, σ and ξ are position parameter, scale parameter and shape parameter of distribution function respectively, and their values are all greater than 0. When ξ is equal to 0, the cumulative probability distribution is Gumbel distribution; When ξ is greater than 0, the cumulative probability distribution is Fréchet distribution; When ξ is less than 0, the cumulative probability distribution is Weibull distribution (Sarmadi and Yuen, 2022).
The solution method of extreme vehicle load is introduced into the solution of temperature load. The sample observation time Tref of random variables X(t) is divided into Nint intervals with the same duration of (Tint = Tref/Nint). According to the classical extreme value theory, if the number of samples is sufficient, the maximum distribution X(t) of each time period follows the GEV distribution (Liu et al., 2018).
If the distribution function of random variable X1, X2, ..., Xn is F(Xi), the distribution function of Mn can be expressed as follows:
Where: n represents the average occurence time in the design reference period T.
Preliminary formulation of temperature load model
In order to establish a unified temperature load model, the temperature curve of web centerline when the roof has compressive stress is selected to establish a positive temperature difference model, and the temperature curve of web centerline when the floor has tensile stress is selected to establish a negitive temperature difference model. Due to the high similarity of temperature curve, the extreme value of the temperature difference curve is uniformly shifted to 0°C. According to the extracted temperature distribution curve, the preliminary temperature load models are proposed as shown in Figure 12.
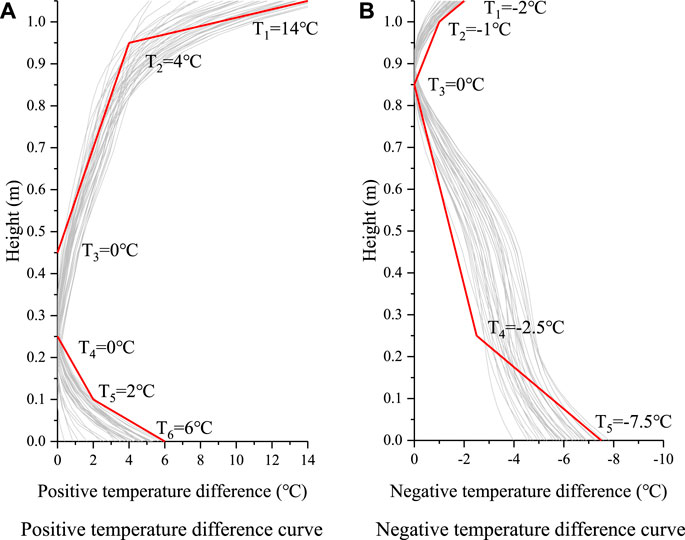
FIGURE 12. Preliminary proposed temperature load model. (A) Positive temperature difference curve. (B) Negative temperature difference curve.
In order to verify the rationality of the preliminary proposed temperature model, the stress distribution of mid-span section of hollow slab is extracted as shown in Figure 13. For the positive temperature difference condition, the maximum compressive stress of the beam roof calculated by preliminary proposed temperature load model is −3.48 MPa, which is consistent with the maximum compressive stress calculated by the positive temperature curve of web centerline (−3.48 MPa). For the negitive temperature difference condition, the maximum tensile stress of the beam floor calculated by preliminary proposed temperature load model is 1.00 MPa, which is close to the maximum tensile stress calculated by the negitive temperature curve of web centerline (1.27 MPa). Therefore, it can be considered that the preliminary proposed positive and negative temperature difference curve has certain reliability.
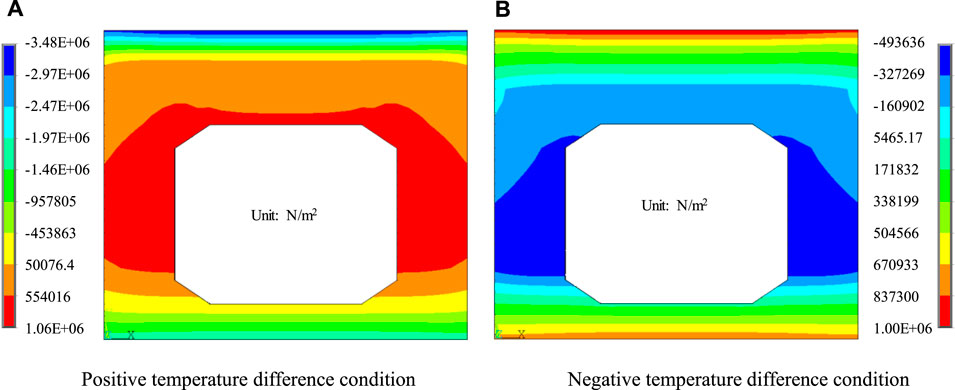
FIGURE 13. Sectional stress distribution calculated by preliminary proposed temperature model (Unit: N/m2). (A) Positive temperature difference condition. (B) Negative temperature difference condition.
Extrapolation of temperature load model
The effect extrapolation method is widely used in the study of vehicle load (Chen et al., 2015). Based on its basic principle, vertical temperature load model of hollow slab is deduced according to design reference period of 100 years. The results of temperature extremum and stress extremum of hollow slab beam before and after extrapolation are compared in Table 5.
The preliminary proposed temperature difference model is extrapolated by using the extrapolated coefficient, as shown in Figure 14A. The secetional stress distribution calculated by the extrapolated positive and negative temperature load model are shown in Figures 14B,C. It can be seen that the maximum compressive stress of beam roof obtained by the extrapolated positive temperature model is −3.66 MPa, and the maximum tensile stress of beam floor obtained by the extrapolated negative temperature model is 1.46 MPa, which is close to the theoretical value after extrapolation (−3.89 MPa for positive temperature difference condition, and 1.55 MPa for negative temperature difference condition in Table 5). It can be considered that the extrapolated temperature load model of hollow slab beam ploted in Figure 14A has certain reliability, which can be applied to the temperature effect analysis of hollow slab beam.
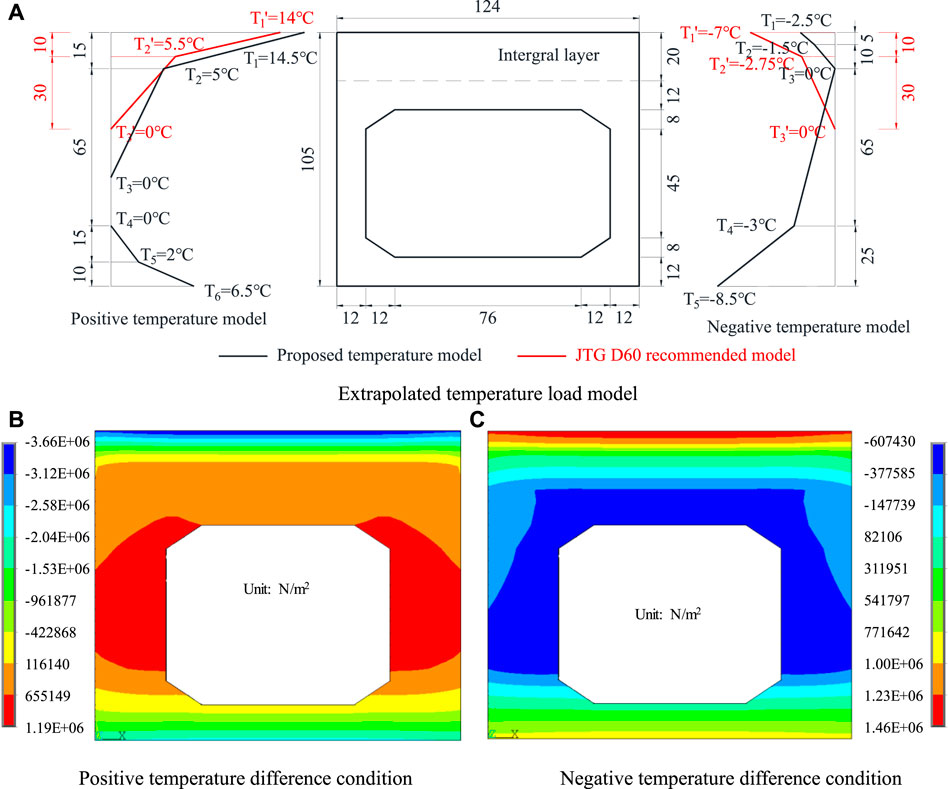
FIGURE 14. The extrapolated temperature load model and its stress distribution of mid-span section. (A) Extrapolated temperature load model (Unit: °C, cm). (B) Positive temperature difference condition (Unit: N/m2). (C) Negative temperature difference condition (Unit: N/m2).
Conclusion
Based on the measured meteorological data and measured temperature field, this paper studies the temperature distribution characteristics of the hollow slab beam. The temperature load effect of 16-m hollow slab beam is calculated by using the obtained temperature field. According to the simplified temperature curve, the vertical temperature load model of hollow slab beam is established by introducing the extreme value extrapolation theory from the vehicle load research. The main conclusions are as follows:
1) The temperature field of hollow slab beam is roughly distributed horizontally, and the extreme temperature is generally located in the beam web. The calculated positive temperature difference curve is similar to the temperature load model specified in different standards. While the negative temperature difference curve is quite different, it is mainly due to that the height of the hollow slab beam roof and floor is relevant small, temperature changes greatly in the beam web. Besides, the rate and amplitude of temperature decreasing in the beam roof are significantly greater than those in floor regarded in many specifications only exist in the rapid large-scale heating after continuous cooling condition.
2) At the time of positive temperature difference, the roof and floor of the hollow slab beam are in the state of compression, and the beam web is in the state of tension. While at the time of negative temperature difference, the roof and floor of the hollow slab beam are in the state of tensile, and the beam web is in the state of compression. The time when the maximum stress exists in the beam roof and floor is not completely corresponding to the time of beam with maximum temperature difference. The temperature load model should be established based on the temperature curve of beam with maximum temperature effect.
3) The temperature effect of hollow slab obtained by the extrapolated temperature load model is close to the stress extrapolation result. The extrapolated positive or negative temperature difference load model can meet the extrapolation requirement of bridge design reference period, which can be adopted to the temperature effect calculation of hollow slab beam.
Data availability statement
The raw data supporting the conclusion of this article will be made available by the authors, without undue reservation.
Author contributions
The corresponding author is responsible for ensuring that the descriptions are accurate. Conceptualization, JS and GSZ; Methodology, JS; GSZ, and CYZ; Investigation, JS and CYZ; Writing—original draft, CYZ; Writing—review and editing, CYZ and JS; Funding acquisition, JS and GSZ; Resources, JS and GSZ; Supervision, JS and GSZ. All authors contributed to the article and approved the submitted version.
Funding
This work is supported by the Science and Technology Plan Project of Guangdong Province (Grant No. 2021B1111610002), Research on Key Technology of Expressway Reconstruction and Extension in Guangdong Province (Grant No. MZKJ-SY-001).
Conflict of interest
GZ was employed by the company Guangdong Provincial Freeway Limited Company.
The remaining authors declare that the research was conducted in the absence of any commercial or financial relationships that could be construed as a potential conflict of interest.
Publisher’s note
All claims expressed in this article are solely those of the authors and do not necessarily represent those of their affiliated organizations, or those of the publisher, the editors and the reviewers. Any product that may be evaluated in this article, or claim that may be made by its manufacturer, is not guaranteed or endorsed by the publisher.
References
Asamoto, S., Ohtsuka, A., Kuwahara, Y., and Miura, C. (2011). Study on effects of solar radiation and rain on shrinkage, shrinkage cracking and creep of concrete. Cem. Concr. Res. 41 (6), 590–601. doi:10.1016/j.cemconres.2011.03.003
Chen, W., Ma, C., Xie, Z., Yan, B., and Xu, J. (2015). Improvement of extrapolation of traffic load effect on highway bridges based on Rice’s theory. Int. J. Steel Struct. 15, 527–539. doi:10.1007/s13296-015-9002-x
Dogonchi, A. S., and Ganji, D. D. (2016). Convection–radiation heat transfer study of moving fin with temperature-dependent thermal conductivity, heat transfer coefficient and heat generation. Appl. Therm. Eng. 103, 705–712. doi:10.1016/j.applthermaleng.2016.04.121
Falk, M., Hüsler, J., and Reiss, R. D. (2011). “Extreme value theory,” in Laws of small numbers: Extremes and rare events (Springer Basel). doi:10.1007/978-3-0348-0009-9_2
Hagedorn, R., Marti-Vargas, J. R., Dang, C. N., Hale, W. M., and Floyd, R. W. (2019). Temperature gradients in bridge concrete I-girders under heat wave. J. Bridge Eng. 24 (8), 04019077.1–04019077.14. doi:10.1061/(ASCE)BE.1943-5592.0001454
Han, D. D., Liu, G. Q., Zhao, Y. L., Pan, Y. Y., and Yang, T. (2020). Research on thermal properties and heat transfer of asphalt mixture based on 3D random reconstruction technique. Constr. Build. Mater. 270, 121393. doi:10.1016/j.conbuildmat.2020.121393
He, J., Xin, H., Wang, Y., and Correia, J. A. (2021). Effect of temperature loading on the performance of a prestressed concrete bridge in Oklahoma: Probabilistic modelling. Structures 34 (5), 1429–1442. doi:10.1016/j.istruc.2021.08.007
He, Z. Q., Ma, Z., Zhang, S., Liu, Z., and Ma, Z. J. (2021). Temperature gradients and stress distributions in concrete box-girder bridges during hot-mix asphalt paving. Structures 33, 1954–1966. doi:10.1016/j.istruc.2021.05.078
Jia, R. X., and Xiong, Q. Y. (2017). Two-dimensional temperature field distribution reconstruction based on least square method and radial basis function approximation. Math. Problems Eng. 1213605, 1–7. doi:10.1155/2017/1213605
Jiang, J. H., and Yuan, Y. S. (2012). Quantitative models of climate load and its effect in concrete structure. Constr. Build. Mater. 29, 102–107. doi:10.1016/j.conbuildmat.2011.10.045
Kim, K. J., Yun, W. G., Cho, N., and Ha, J. (2017). Life cycle assessment based environmental impact estimation model for pre-stressed concrete beam bridge in the early design phase. Environ. Impact Assess. Rev. 64, 47–56. doi:10.1016/j.eiar.2017.02.003
Lin, J., Xue, J., Huang, F., and Chen, B. (2020). Research on the internal thermal boundary conditions of concrete closed girder cross-sections under historically extreme temperature conditions. Appl. Sci. 10 (4), 1274. doi:10.3390/app10041274
Liu, Y., Li, D., Li, Y., and Zhang, Z. (2018). Estimation of extreme value vehicle load based on the extended burr XII distribution. KSCE J. Civ. Eng. 22, 3401–3408. doi:10.1007/s12205-017-1727-y
Ma, Y. J., Chen, G. P., and Yang, F. (2017). Modal analysis of a simply supported steel beam with cracks under temperature load. Shock Vib. 9125045, 1–10. doi:10.1155/2017/9125045
Nandan, H., and Singh, M. P. (2014). Effects of thermal environment on structural frequencies: Part I – a simulation study. Eng. Struct. 81 (15), 480–490. doi:10.1016/j.engstruct.2014.06.046
Narasimhan, T. N. (1999). Fourier’s heat conduction equation: History, influence, and connections. Proc. Indian. Acad. Sci. 108, 117–148. doi:10.1007/BF02842327
Sarmadi, H., and Yuen, K. V. (2022). Structural health monitoring by a novel probabilistic machine learning method based on extreme value theory and mixture quantile modeling. Mech. Syst. Signal Process. 173, 109049. doi:10.1016/j.ymssp.2022.109049
Shan, W., Wang, X., and Jiao, Y. (2018). Modeling of temperature effect on modal frequency of concrete beam based on field monitoring data. Shock Vib. 8072843, 1–13. doi:10.1155/2018/8072843
Sheng, X., Yang, Y., Zheng, W., Zhou, B., Li, S., and Huang, L. (2020). Study on the time-varying temperature field of small radius curved concrete box girder bridges. AIP Adv. 10 (10), 105013. doi:10.1063/1.5133992
Sheng, X., Zhou, T., Huang, S., Cai, C., and Shi, T. (2022). Prediction of vertical temperature gradient on concrete box-girder considering different locations in China. Case Stud. Constr. Mater. 16, e01026. doi:10.1016/j.cscm.2022.e01026
Sousa, T. E., Pimentel, M., and Figueiras, J. (2018). Structural response of a concrete cable-stayed bridge under thermal loads. Eng. Struct. 176, 652–672. doi:10.1016/j.engstruct.2018.09.029
Venglár, M., and Lamperová, k. (2021). Effect of the temperature on the modal properties of a steel railroad bridge. Slovak J. Civ. Eng. 29 (1), 1–8. doi:10.2478/sjce-2021-0001
Wang, J. F., Xu, Z. Y., Fan, X. Y., and Lin, J. P. (2015). Thermal effects on curved steel box girder bridges and their countermeasures. J. Perform. Constr. Facil. 31 (2), 04016091. doi:10.1061/(ASCE)CF.1943-5509.0000952
Wang, C., Liu, W. C., and Chen, Z. (2020). Calculation and analysis of box girder temperature effect of large cantilever bridge under the solar radiation. IOP Conf. Ser. Mater. Sci. Eng. 780, 022010. doi:10.1088/1757-899X/780/2/022010
Yan, Y., Wu, D., and Qi, L. (2018). A three-dimensional method for the simulation of temperature fields induced by solar radiation. Adv. Struct. Eng. 22, 567–580. doi:10.1177/1369433218795254
Yao, W. X., Xu, C. F., Zhao, J., Wang, X., Wang, Y., Li, X. L., et al. (2020). The modified ASHRAE model based on the mechanism of multi-parameter coupling. Energy Convers. Manag. 209, 112642. doi:10.1016/j.enconman.2020.112642
Yuan, Y. S., and Jiang, J. H. (2012). Climate load model – climate action spectrum for predicting durability of concrete structure. Constr. Build. Mater. 29, 291–298. doi:10.1016/j.conbuildmat.2011.10.034
Keywords: hollow slab, measured meteorological data, vertical temperature, temperature load model, extreme extrapolation
Citation: Zeng GS, Song J and Zhu CY (2022) Temperature distribution simulation and thermal properties investigation of hollow slab beam based on meteorological data. Front. Energy Res. 10:998074. doi: 10.3389/fenrg.2022.998074
Received: 19 July 2022; Accepted: 02 September 2022;
Published: 27 September 2022.
Edited by:
Shuang Zhao, Hefei University of Technology, ChinaCopyright © 2022 Zeng, Song and Zhu. This is an open-access article distributed under the terms of the Creative Commons Attribution License (CC BY). The use, distribution or reproduction in other forums is permitted, provided the original author(s) and the copyright owner(s) are credited and that the original publication in this journal is cited, in accordance with accepted academic practice. No use, distribution or reproduction is permitted which does not comply with these terms.
*Correspondence: Jun Song, c29uZ2p1bjgxNUBxcS5jb20=
 Guosheng S Zeng1
 Jun Song