 Wei Han
 Haozhi Nan
 Pengpeng Ju2
- 1College of Energy and Power Engineering, Lanzhou University of Technology, Lan Zhou, China
- 2Offshore Oil Engineering Co, Ltd., Tian Jin, China
- 3Haimo Technologies Group Corp., Lan Zhou, China
Operating efficiency and reliability are major problems that restrict gas-liquid multiphase pumps, which are core pieces of equipment used in deep-sea oil and gas exploration and transportation. In this paper, a 100-20x helical axial-flow gas-liquid pump is taken as the research object. The Euler multiphase flow model and SST k-ω turbulent model are used to model the multiphase pump. By exploring the airfoil composite position and the maximum thickness composite scheme, a mathematical model for the head coefficient and efficiency of the multiphase pump with respect to the relative thickness is established, and the external and internal flow characteristics of the modified multiphase pump are analyzed. We explore the influence of the composite position and the maximum thickness variation law of the composite airfoil on the performance of the mixed pump and determine the final airfoil composite scheme. We found that a change in the maximum thickness of the composite airfoil gives the external curve of the multiphase pump a “hump"-like characteristic, which shows that the head coefficient and efficiency increase first and then decrease with the increase in the maximum thickness of the composite airfoil. When the composite position is in the middle of the airfoil, the airfoil maximum thickness is 1.25 mm and the gas-phase volume fraction is 70%. Moreover, the head coefficient and efficiency of the multiphase pump reach their maximum values; the head coefficient and efficiency increase by 2.4% and 1.16%, respectively, compared with the basic model.
1 Introduction
A major piece of equipment in the process of oil and gas production is the gas-liquid multiphase pump. As this equipment is used for transporting both oil and natural gas, innovation in gas-liquid mixed transport technology is an important aspect of improving the efficiency of oil and gas production. (Ma et al., 2011; Shi et al., 2018; Zhang et al., 2019; Zhang et al., 2020a). A vane multiphase pump is represented by a helical axial multiphase pump. The working principle of an axial-flow pump is to push fluid out by using the thrust generated by the blade when the impeller rotates at high speed. The impeller is the core component of the axial-flow pump, and the quality of the blade directly affects the hydraulic performance of the pump unit. Therefore, the design of the blade airfoil is the key factor affecting the hydraulic performance of the axial-flow pump. (Kim et al., 2015; Yan et al., 2016; Shi et al., 2020). The composite airfoil first appeared in the design theory of wind turbine blades. Taking the standard airfoil as the airfoil blade body of the composite airfoil, the airfoil is modified by the method of airfoil superposition by extending the front edge of the airfoil blade body forward, extending the rear edge backward, and performing airfoil superposition on the suction surface of the airfoil blade body (Kim et al., 2015; Zhang et al., 2017; Suh et al., 2018). Liu et al. designed a wind turbine blade using the method of superposition of multiple airfoils, obtained discrete coordinates of the composite airfoil based on the MATLAB language, and obtained a three-dimensional model of the blade through CFD software, which provided an idea for the design of the composite airfoil (Liu et al., 2012; Zhang et al., 2016). He et al., used multiple regression method to study the lift coefficient of axial flow pump impeller airfoil, and found that the lift coefficient was most affected by the relative curvature of the airfoil and least affected by the radial clearance of the impeller (Zhang et al., 2020b). At present, composite airfoils have not been applied in the field of fluid machinery. Impeller blades in axial-flow pumps are mostly designed with a single airfoil according to different thickening laws, and the composite superposition of multiple airfoils and composite metals of multiple materials are not mentioned (He and Lao, 2014). Cui et al., carried out numerical simulation analysis around NACA airfoil. Through the analysis of pump pressure distribution and airfoil lift drag ratio coefficient, it was found that the airfoil lift coefficient was positively correlated with the curvature of the airfoil leading edge, and reached the extreme value when the twist was 15 (Cui, 2009). To sum up, scholars from various countries have relatively mature research on airfoils in the field of aerospace, but few in the field of fluid machinery. Many axial-flow pumps refer to mature aviation airfoils when selecting impeller airfoils. However, due to the differences in the density and viscosity of the fluid medium, the hydraulic performance of the axial flow pump based on the aircraft airfoil design has limitations. In order to study the influence of the modified composite airfoil on the performance of the gas-liquid multiphase pump and determine the law of the airfoil compounding method and the degree of gas-liquid separation, this paper analyzes the helical axial-flow gas-liquid hybrid pump through numerical simulation, and establishes the relevant mathematical prediction model of the impeller composite airfoil. It provides a theoretical basis for the design of impeller airfoil and the study of gas-liquid separation characteristics of helical axial-flow gas-liquid multiphase pump.
2 Geometric model and calculation method
2.1 Parameters and models
In this paper, a 100-20x helical axial-flow gas-liquid multiphase pump is used as the basic model for the modified design. The design flow is Q0 = 100 m3/h
For the airfoil of the impeller and the guide vane, a 791 airfoil is used. The schematic diagram of the 791 airfoil is shown in Figure 1.
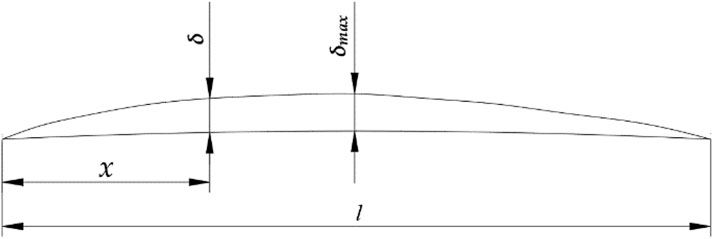
FIGURE 1. The 791 airfoil.
In the Figure, x is the length from the inlet of the airfoil; l is the chord length of the airfoil; δ represents the thickness corresponding to the position x; and δ Max is the maximum thickness of the airfoil. The number of impeller blades is 4, the setting angle of the inlet on the hub is 10°, and the setting angle of the outlet is 14°. The number of guide vanes is 17, and the inlet setting angle on the hub is 38°, and the outlet setting angle is 90°.
Figure 2A shows the structure of impeller and guide vane, and Figure 2B shows the water body in the calculation domain.
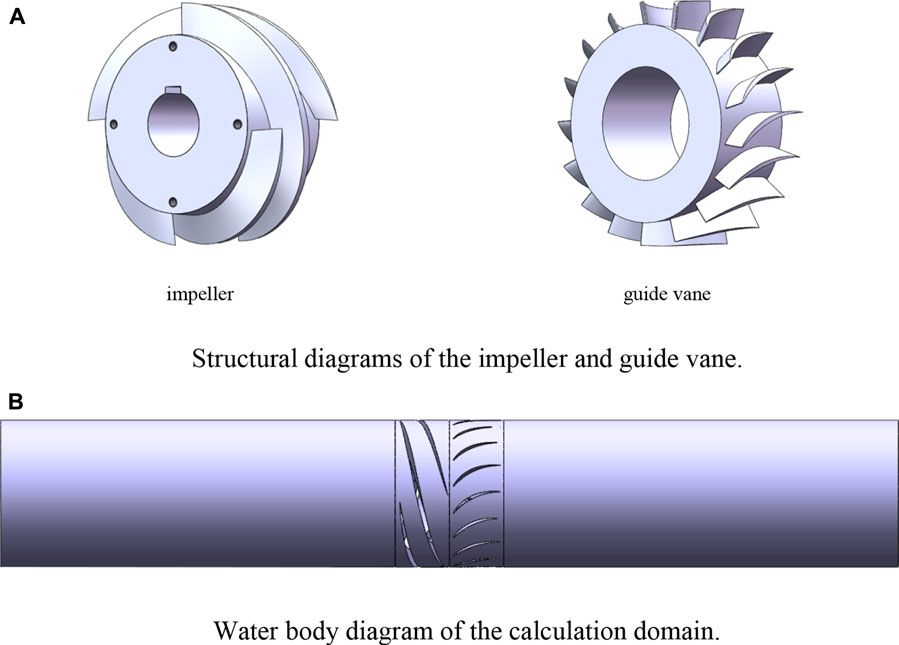
FIGURE 2. Three-dimensional rendering. (A) Structural diagrams of the impeller and guide vane. (B) Water body diagram of the calculation domain.
2.2 Mesh generation and calculation method
The calculation domain of the helical axial-flow gas-liquid multiphase pump includes an inlet channel, impeller, guide vane and outlet channel. ANSYS-ICEM software was used to divide the calculation domain using the hybrid grid method. In order to save on computing resources, structured grids were used in the inlet section and outlet section. The structure of the impeller and guide vane is complex, and an unstructured grid was adopted.
By comparing the five grid schemes for grid independence verification in Table 1, it was found that the change in the external characteristics of the multiphase pumps in schemes III, IV and V was less affected by the change in the grid number and tended to be stable. Therefore, scheme III was selected under the condition of ensuring the accuracy of the calculation results. The total number of grids in this scheme is 4,119,000, and the grid quality is more than 0.3, which meets the requirements for grid quality. The calculation domain grid is shown in Figure 3.
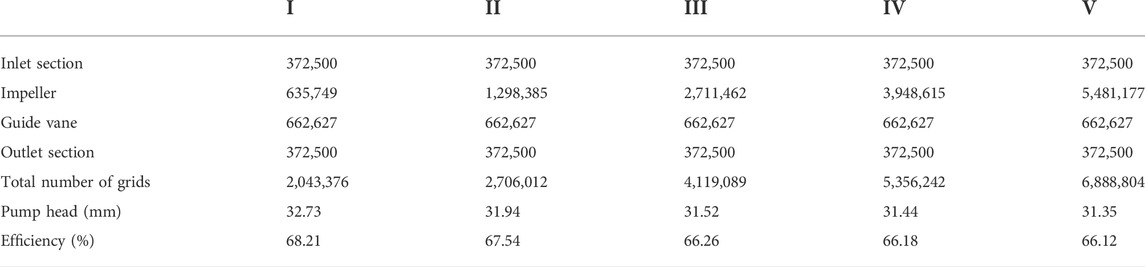
TABLE 1. Grid independence test.

FIGURE 3. Calculation domain grid of the water body.
2.3 Experimental verification
In this study, the helical axial-flow gas-liquid pump uses gas-liquid two-phase flow as the transport medium. There may be vortex and phase separation in the flow, and the turbulence intensity is large. Therefore, our research is based on the Euler multiphase flow model under the fluent solver and SST K-ω. The turbulence model is used to describe the gas-liquid two-phase flow in the multiphase pump in order to obtain more accurate calculation results. The inlet of intake channel is the inlet, the boundary inlet boundary is the velocity inlet, the outlet of outlet channel is the outlet boundary, and the outlet boundary is the pressure outlet, which defaults to the standard atmospheric pressure. The hub and blade of the impeller are rotating walls, while the others are defined as non-slip walls. The conveying media are gas-liquid two-phase flow media with the bubble diameter of 0.1 mm.
In this study, the 1:1 impeller and guide vane models were made based on design parameters and tested on the gas-liquid two phase flow test bed of Lanzhou University of Technology. The test bed is shown in Figure 4. Taking air and water as the two-phase flow medium, calculation reliability test was carried out with five different flows: 0.6Q0 = 60 m3/h, 0.8Q0 = 80m3/h, Q0 = 100 m3/h, 1.2Q0 = 120 m3/h and 1.4Q0 = 140 m3/h (Q0 = 100 m3/h). The gas content values were 30% and 50%. The experimental results show that the experimental data have the same trend as the simulation data and accord with the external characteristic law of the general axial-flow pump, but there are errors between the experimental results and the simulation results. When the inlet gas phase volume fraction is 30%, the simulated head under standard working conditions is H = 31.85m with an efficiency of η = 66.26%, and the experimental head is H = 28.53m with an efficiency of η = 60.77%. When the inlet gas phase volume fraction is 50%, the simulated head under standard working conditions is H = 31.4m and the efficiency is η = 66.12%, and the experimental head is H = 26.41m with an efficiency of η = 58.26%. Pump efficiency refers to the ratio of effective power to shaft power. This is because there is energy dissipation during the operation of the experimental platform, and the experimental results are often lower than the simulation results. In engineering applications, the error between the numerical simulation results and the experimental results is usually within ±10%. By comparing the experimental results and simulation results, as shown in Figure 5, it was found that the data errors of the multiphase pump are within the allowable range when the gas volume fraction is 30% and 50% under the standard working condition’s flow, which shows that the numerical calculation method used in this paper is reliable and accurate.
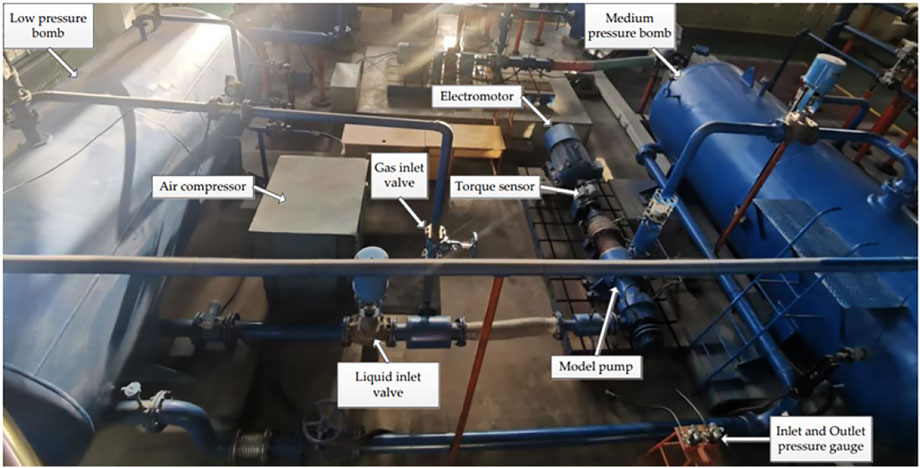
FIGURE 4. Two-phase flow test bed.
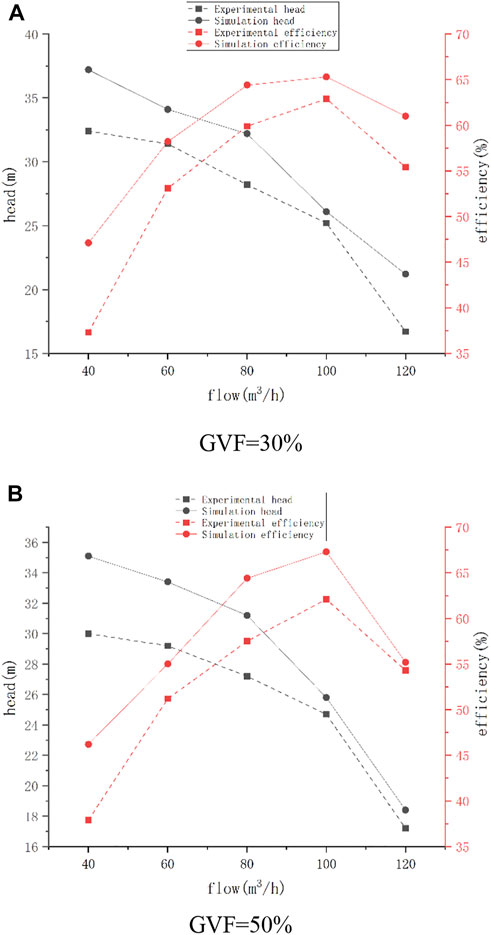
FIGURE 5. Comparison of the numerical model and the experiment. (A) GVF = 30%. (B) GVF = 50%.
3 Determination of the airfoil composite scheme
3.1 Determination of the airfoil compound position
In this paper, the influence of the composite airfoil on the suction surface of the blade on the external and internal flow characteristics of the multiphase pump is studied to preliminarily determine the airfoil composite scheme.
When compounding, the pressure surface of the new airfoil should be fitted with the suction surface of the main airfoil to ensure that there is no obvious pressure change on the blade surface and that the streamline at the airfoil joint is not disordered; the maximum thickness of the composite airfoil should not exceed the maximum thickness of the rim. The maximum thickness of the superimposed airfoil in this study is 2 mm; the leading, middle and trailing edges of the main airfoil suction surface are taken as the composite positions; A control group is added, in which the maximum thickness of the composite airfoil is 1 and 3 mm.
3.2 Analysis of the external characteristics of the multiphase pump with different composite positions
In order to better characterize the change in the external characteristics of the mixed pump, the head coefficient is introduced in this paper Ψ. The head coefficient is dimensionless, and its expression is:
where
Through numerical calculation of the parameters of the modified multiphase pump, it was determined that the rated speed was n = 4500rpm, the rated flow is Q0 = 100 m3/h, and the inlet gas-phase volume fractions were 30%, 40%, 50, 60% and 70%, so as to obtain the head coefficient under different gas-phase volume fractions Ψ and efficiencies η. The efficiencies curve η varies with the composite position of the airfoil on the suction surface.
By processing and summarizing the results of the numerical calculation, the head coefficient and efficiency of the multiphase pump under different schemes and different gas-phase volume fractions were obtained, as shown in the Figure 6.
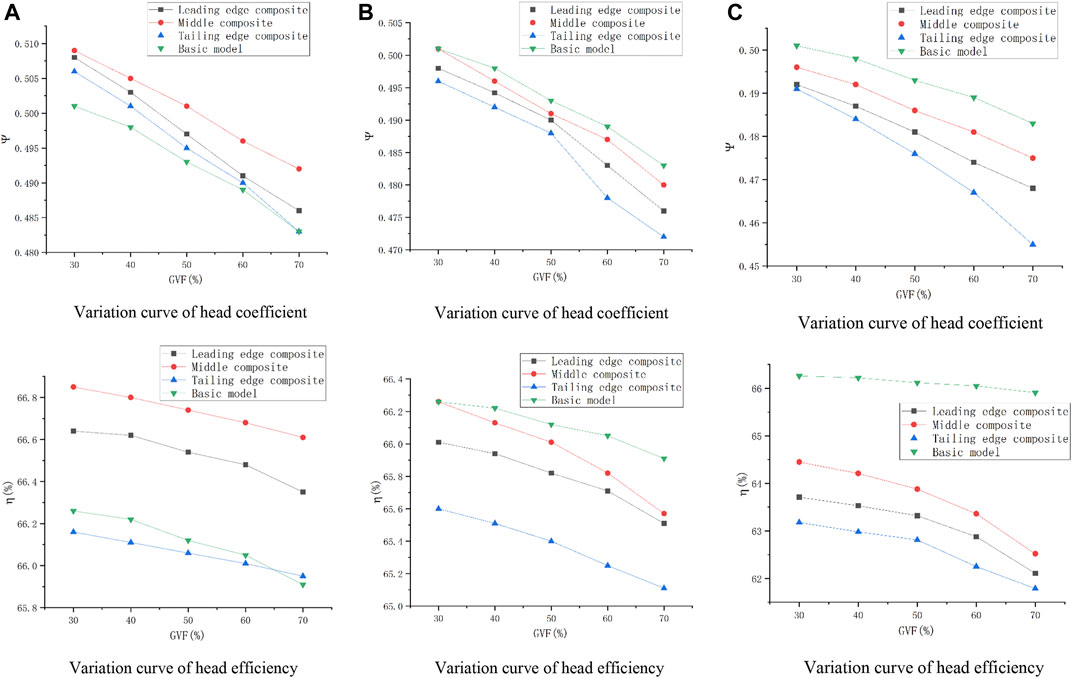
FIGURE 6. Head coefficient and efficiency of different schemes. (A) Scheme 1 Changes in the external characteristics of the multiphase pump with a maximum thickness of 1mm. (B) Scheme 2 Changes in the external characteristics of the multiphase pump with a maximum thickness of 2mm. (C) Scheme 3 Changes in the external characteristics of the multiphase pump with a maximum thickness of 3 mm.
By comparing the external characteristic curves of the multiphase pump under different schemes, it was found that the head coefficient and efficiency of the multiphase pump under different schemes decrease with the increase in the fluid gas-phase volume fraction. When the gas-phase volume fraction is constant, the corresponding head coefficient and efficiency are the largest when the airfoil composite position is in the middle of the suction surface and the smallest when the tail edge composite position is in the middle of the suction surface. This shows that when the composite airfoil is in the middle, the correction effect of the multiphase pump is better than that of other positions. Combined with the data analysis of the original model, it was found that when the void fraction is constant and the maximum thickness of the composite airfoil is 1mm, the composite effect of the leading edge and middle is obvious, and the head coefficient and efficiency are higher than those of the basic model. When the composite position is in the middle, the effect is the best. When the gas volume fraction is 70%, the head coefficient and efficiency are 0.492 and 66.61% and increase by 1.85% and 0.7%, respectively, compared with the basic model. When the maximum thickness of the composite airfoil is 2 and 3 mm, the head coefficient and efficiency corresponding to the three composite positions are less than those for the original model, and the values are the smallest when the maximum thickness is 3 mm. At this time, the tail edge composite effect is the worst. The head coefficient and efficiency are 0.455 and 61.79 at 70% gas volume fraction and are reduced by 5.79% and 4.12%, respectively, compared with the basic model. Comparing the data obtained from the three schemes, it was found that the effect is the best when the composite position of the airfoil is in the middle of the airfoil, but it changes due to the influence of the maximum thickness of the composite airfoil.
4 Determination of the maximum thickness of the compound airfoil for the impeller
4.1 Thickening scheme
In this study, the value range of the maximum thickness of the composite airfoil was preliminarily determined as 0–4mm, after combining the maximum thickness of the airfoil at the impeller hub and shroud and taking the increase in the maximum thickness of the composite airfoil as being less than the maximum thickness of the airfoil at the hub as the standard. In order to accurately determine the influence of the maximum thickness law of the composite airfoil on the performance of the gas-liquid multiphase pump, eight schemes with composite airfoils with maximum thicknesses of 0.5, 1, 1.5, 2, 2.5, 3, 3.5, and 4 mm were designed. The airfoil composite method uses the superposition of the main airfoil suction surface and the composite airfoil pressure surface. The blade-thickening process follows the thickening law for the 791 airfoil. The composite modeling was carried out in the middle of the main airfoil suction surface of the five sections of the blade, and the new model was numerically simulated. The internal and external characteristics of the multiphase pump were obtained by using CFD-POST software, and the best airfoil composite scheme was determined through comparative analysis.
4.2 Analysis of the external characteristics of the multiphase pump under different maximum thicknesses
Through numerical calculation the modified compression unit, it was determined that the rated speed was n = 4500rpm, the rated flow was Q0 = 100 m3/h, and the maximum thickness of the composite airfoil was 0.5mm∼4 mm. Moreover, the curves of the lift coefficient and efficiency with the gas-phase volume fraction were drawn, as shown in Figure 7. On the whole, the head coefficient and efficiency of the multiphase pump decrease with the increase in the void fraction, and the external characteristics of the multiphase pump are different due to the influence of the maximum thickness of the composite airfoil. In order to explore the influence of the change in the maximum thickness of the composite airfoil on the external characteristics of the basic model, the head coefficient and efficiency of the basic model were added for comparison. It was found that the external characteristics of the multiphase pump in schemes 1, 2 and 3 are higher than the basic model. The head coefficient and efficiency of the multiphase pump in scheme 2 and scheme 3 change in almost the same way when the gas-phase volume fraction is high. When the gas-phase volume fraction is 30%, the external characteristic parameters of the multiphase pump in scheme 3 are the largest, with a head coefficient of
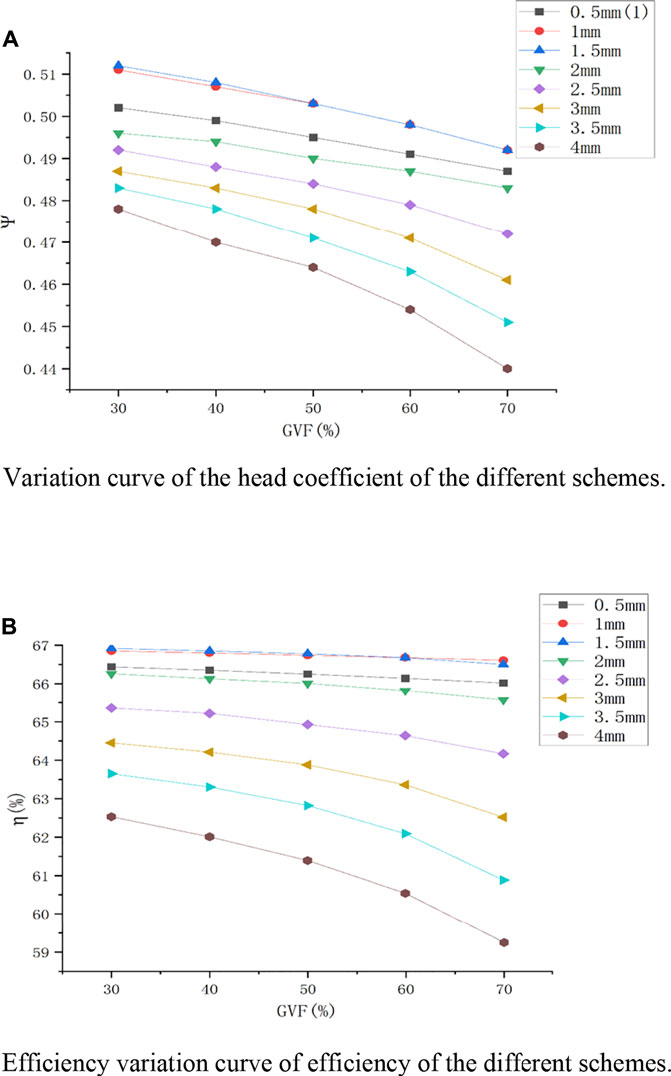
FIGURE 7.
Figure 8 shows the curve of the head coefficient and efficiency of the multiphase pump with respect to the maximum thickness of the composite airfoil when the gas-phase volume fraction is 30%, 50%, and 70%. By comparing the external characteristic curves of the multiphase pump under different schemes, it was found that the change trend in the head coefficient and efficiency with respect to the maximum thickness of the composite airfoil has a “hump"-like characteristic, and the curve trend increases first and then decreases. When the gas-phase volume fraction is 30%, the maximum values of the head coefficient and efficiency are obtained when the maximum thickness is about 1.5 mm, the head coefficient is
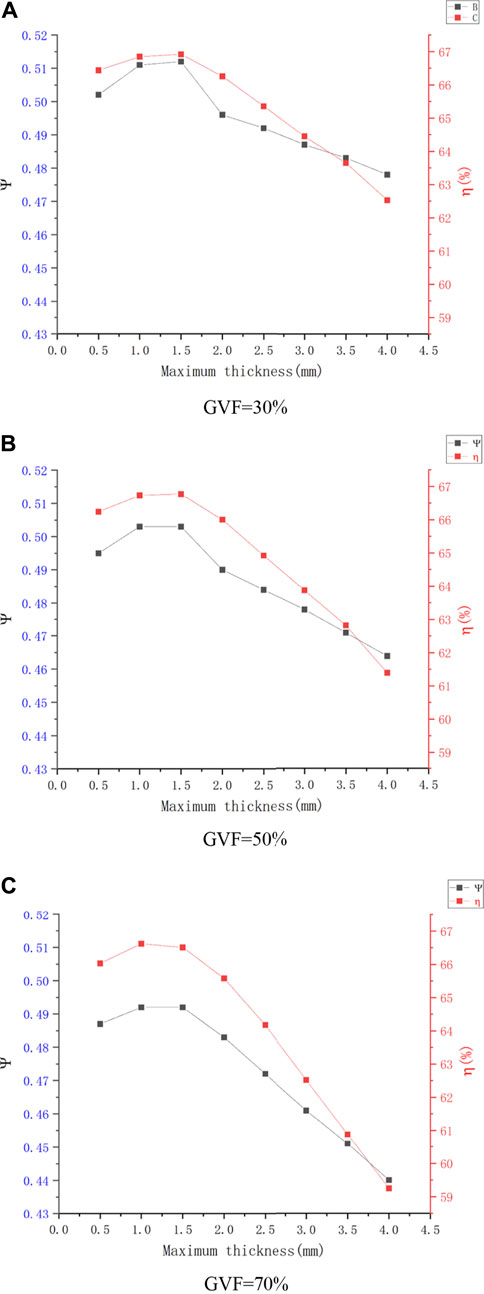
FIGURE 8. External characteristics curve of the different schemes. (A) GVF = 30%. (B) GVF = 50%. (C) GVF = 70%.
In Figure 8, it can be seen that when the maximum thickness of the composite airfoil is 1 and 1.5 mm, the change in the external characteristics of the multiphase pump tends to be consistent. When the change range is 0 ∼ 1 mm, the external characteristics increase with the increase in the maximum thickness. However, when the change range is 1.5–4 mm, the external characteristics decrease with the increase in the maximum thickness. Therefore, it is inferred that there is a maximum thickness in the range 1–1.5 mm to maximize the head coefficient and efficiency of the multiphase pump. Therefore, the composite airfoil’s maximum thickness of 1.25 mm was taken as scheme 9 for the numerical simulation, and the broken line diagram of the head coefficient and efficiency with respect to the maximum thickness of the composite airfoil of the multiphase pump was redrawn, as shown in Figure 7. The results show that when the maximum thickness of the composite airfoil is 1.25 mm, the external characteristics of the multiphase pump are the best. When the gas-phase volume fraction is 30%, the head coefficient is
In order to better explain the influence of the change in the maximum thickness of the composite airfoil on the efficiency of the multiphase pump, the relative thickness ratio coefficient
where
In order to express the change in the efficiency of the modified model, the relative efficiency is defined to represent the changing degree of the efficiency of the modified model compared with the efficiency of the basic model. A positive value indicates that the efficiency of the modified model is greater than that of the basic model, and a negative value indicates that the efficiency of the modified model is less than that of the basic model. The expression is:
where
In order to study the change in the external characteristic parameters of the multiphase pump compared with the basic model in the modification scheme, the mathematical equation for the relative thickness ratio coefficient on the head coefficient and relative efficiency is established to reveal the change law between the relative thickness ratio coefficient and the external characteristic performance parameters of the multiphase pump.
Figure 9C shows the head coefficient of the multiphase pump under different schemes when the gas-phase volume fraction is 70%. The results show that when
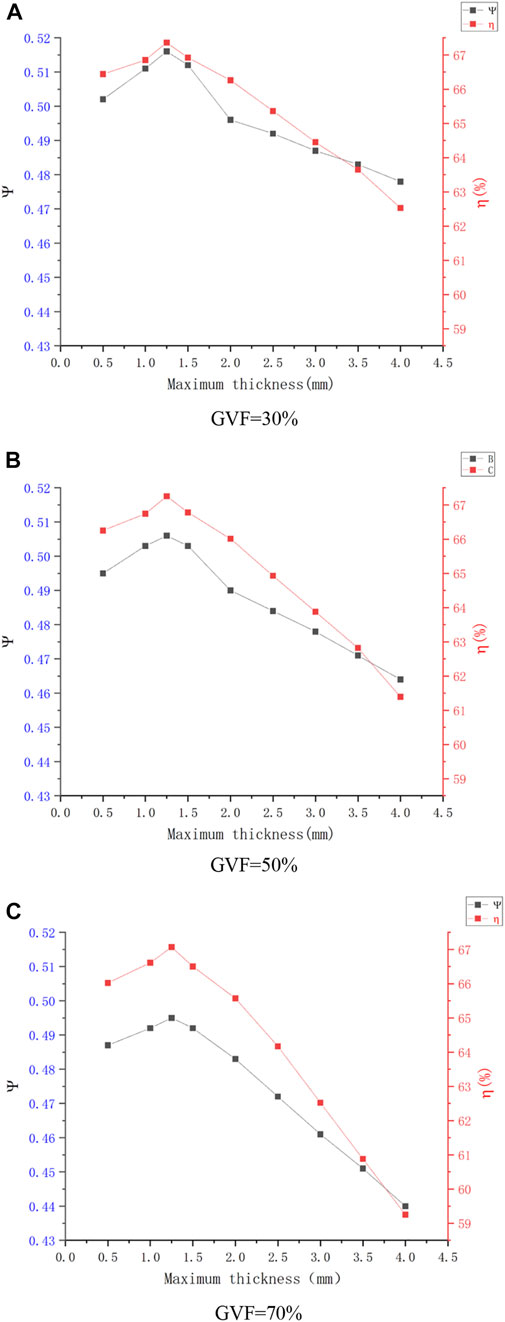
FIGURE 9. Variation curve of the external characteristics after modification. (A) GVF = 30%. (B) GVF = 50%. (C) GVF = 70%.
We drew an
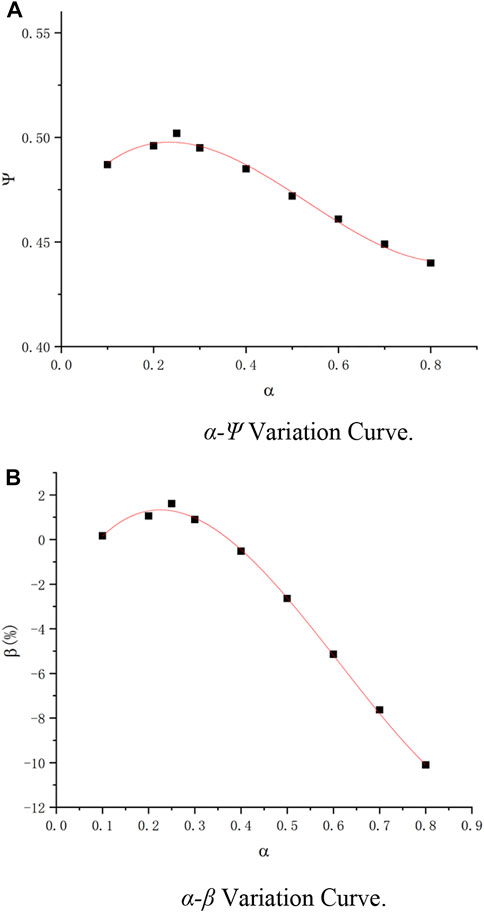
FIGURE 10. Polynomial fitting curve. (A) α-Ψ Variation Curve. (B) α-β Variation Curve.
The polynomial fitting curve expression is as follows:
The efficiency of the multiphase pump under different schemes when the gas-phase volume fraction is 70% was obtained as shown in Figure 10B. After calculation, the relative thickness ratio coefficient and relative efficiency were obtained. The results show that when
The polynomial fitting curve expression is as follows:
4.3 Analysis of the internal flow characteristics of mixed pumps with different maximum thicknesses.
In this study, the modified design of the multiphase pump impeller is realized by changing the maximum thickness of the composite airfoil. Therefore, it is necessary to re-analyze the internal flow state of the compression unit of the multiphase pump. Considering many design schemes, this section selects and analyzes the diagram for the gas-phase accumulation state and the diagram for the blade surface pressure distribution state in the impeller channel when the maximum thickness of the composite airfoil is 1, 2.5 and 4 mm. Figure 11A shows the gas-phase distribution in the whole flow channel of the impeller when the gas-phase volume fraction is 70% and the maximum thicknesses of the composite airfoil are 1, 2.5 and 4 mm. As shown in the figure, the gas-phase distribution on the pressure and suction surfaces of the blades is uniform without large-scale gas-phase aggregation. The gas-phase accumulation area mainly occurs at the hub of the impeller, which accumulates heavily at the outlet of the impeller flow channel, and the volume fraction gradient of the gas-phase changes abruptly, which may lead to a gas blockage at the outlet of the flow passage. With the increase in the maximum thickness of the composite airfoil, the gas-phase aggregation at the outlet of the flow channel gradually slows down, the phase volume fraction gradient changes smoothly, and the gas-phase aggregation phenomenon in this area improves, which indicates that the larger the maximum thickness of the composite airfoil, the more obvious the improvement effect on gas-phase aggregation in the impeller flow channel; this has a certain effect on reducing the gas blockage.
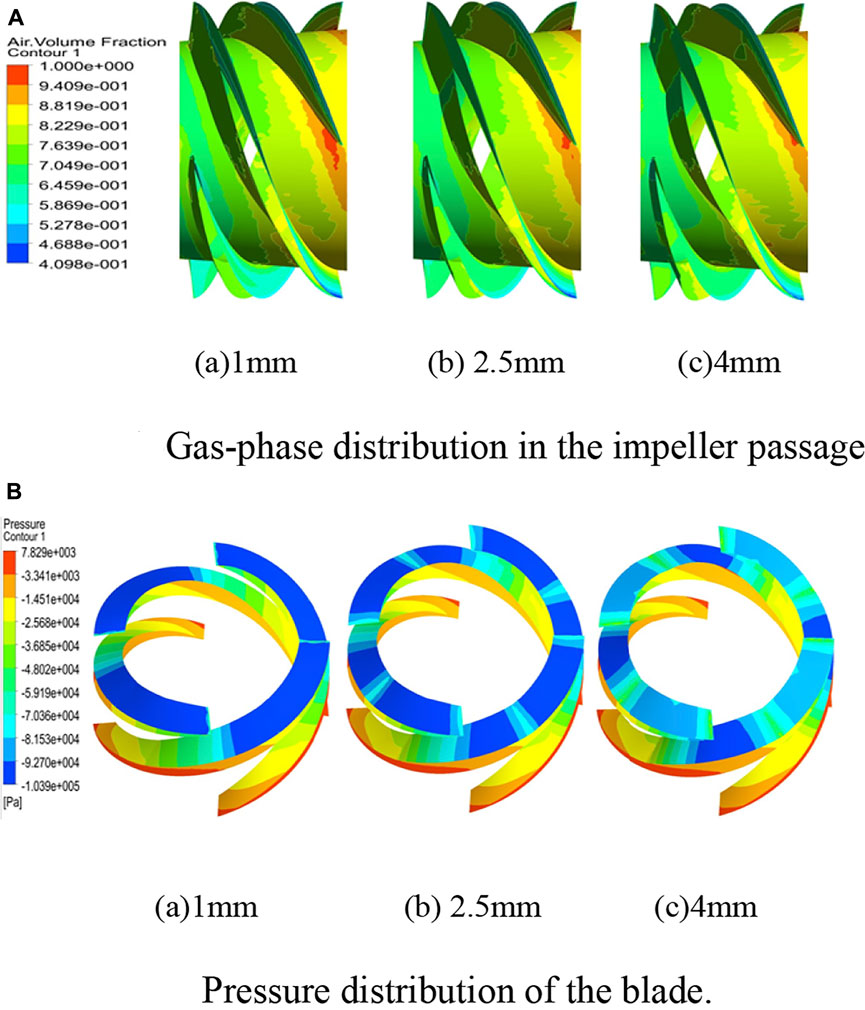
FIGURE 11. Cloud diagram of gas phase and pressure distribution. (A) Gas-phase distribution in the impeller passage. (B) Pressure distribution of the blade.
Figure 11B shows a cloud of impeller blade pressure changes with a gas volume fraction of 70% and maximum composite airfoil thicknesses of 1, 2.5 and 4 mm. As shown in the figure, the blade pressure increases gradually along the extension direction, which is consistent with the increase in the work potential energy of the axial-flow pump. Moreover, there is no obvious sudden change in the pressure on the blade surface, and the pressure gradient changes gently, indicating that there is no fluid disturbance on the blade surface. Due to the different maximum thicknesses of the composite airfoil, there are also differences in the pressure range on the blade surface. When the maximum thickness of the airfoil is 1mm, the leading edge of the blade suction surface is in the low-pressure region, and the pressure gradient has no obvious change. When the maximum thickness of the airfoil is 2.5 mm, the pressure gradient at the front edge of the blade suction fluctuates, and the pressure gradient obviously changes at the inlet and airfoil composite parts. When the maximum thickness of the airfoil is 4 mm, the low-pressure area of the blade appears in the middle of the suction surface of the blade, the pressure gradient at the leading edge of the blade no longer changes in a single trend, the pressure distribution on the suction surface of the blade decreases first and then increases, and the pressure is the smallest in the composite area of the airfoil. It can be seen that the maximum thickness of the composite airfoil has an obvious impact on the pressure distribution of the blade. When the thickness of the composite airfoil on the suction surface of the main airfoil is greater, the change in the pressure gradient at the leading edge of the blade will be more drastic, the fluid disturbance on the blade will be more obvious, and the lost kinetic energy will also increase. Therefore, the maximum thickness of the composite airfoil has a critical range. When the maximum thickness exceeds the critical range, the blade surface pressure will suddenly change, and the fluid will be disturbed.
4.3.1 Gas-phase distribution in the impeller channel
Figure 12 shows the gas-phase distribution of the impeller channel of the multiphase pump when the gas-phase volume fraction is 70%. The figure also shows the maximum thickness of different composite airfoils. By comparing the gas distribution diagrams, it was found that the gas accumulates at the outlet of the impeller channel. By changing the maximum thickness of the composite airfoil, the gas concentration in the impeller decreases. When the maximum thickness of the composite airfoil is 1.25 mm, the gas-phase concentration at the outlet hub of the impeller channel is the smallest, and the gas-phase distribution in the channel is uniform, indicating that when the maximum thickness of the composite airfoil in the modified model is 1.25 mm, improving the gas-phase distribution in the pump’s impeller channel has an obvious effect.
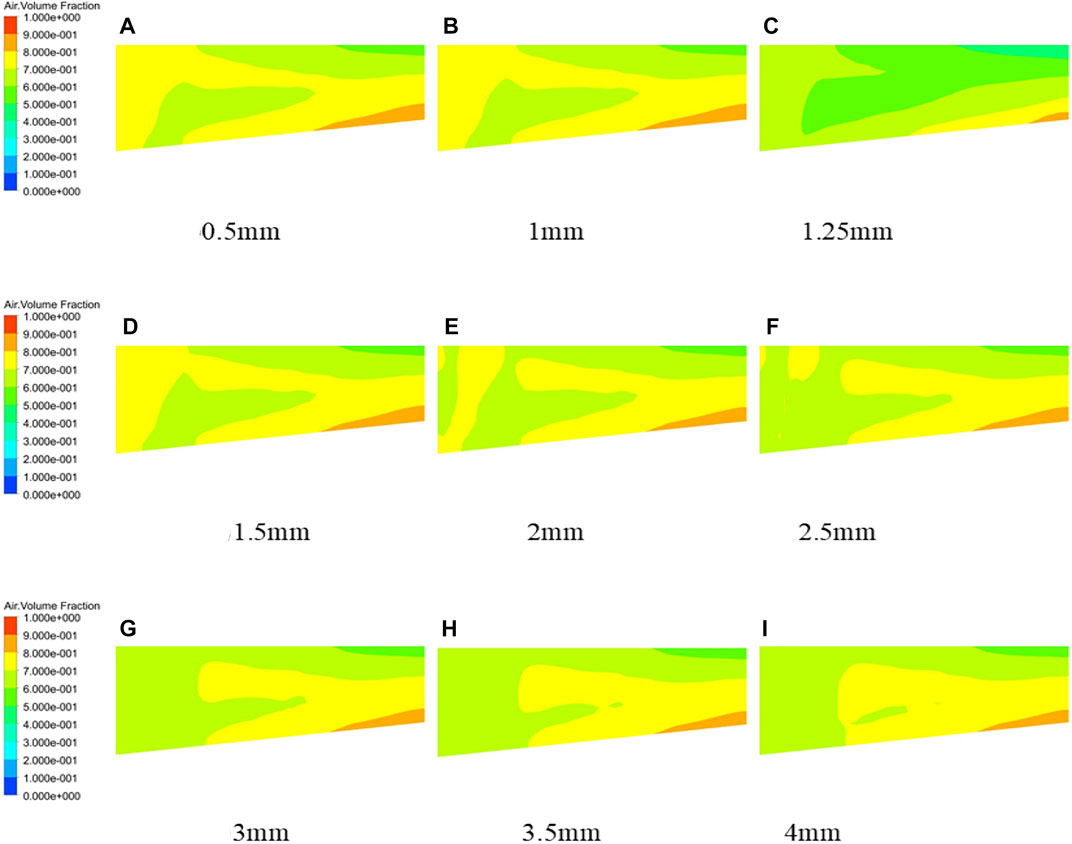
FIGURE 12. Gas-phase distribution diagram of the impeller passage with different maximum thicknesses of composite airfoils. (A) 0.5mm, (B) 1mm, (C) 1.25mm, (D) 1.5mm, (E) 2mm, (F) 2.5mm, (G) 3mm, (H) 3.5mm, (I) 4mm.
4.3.2 Gas-phase distribution in the cascade
Figure 13A shows the gas phase distribution of the mixing pump cascade under different maximum thicknesses. Considering the huge amount of calculation and other factors, only 70% gas volume fraction is analyzed in this section. The analysis results show that the gas-phase distribution in the impeller channel tends to be uniform. In the nine schemes mentioned above, the gas-phase accumulation area appears at the trailing edge of the airfoil, and the accumulation area gradually extends from the blade’s suction surface to the pressure surface. The gas-phase accumulation degree changes with multiple trends under the influence of the maximum thickness of the airfoil. The gas-phase concentration decreases first and then increases in the thickness variation range. With the increase in the maximum thickness of the airfoil, the change in the gas-phase concentration slows down, indicating that the maximum thickness of the airfoil can improve the gas-phase concentration state in the impeller of the multiphase pump. When the maximum thickness of the composite airfoil is 1.25 mm, the gas-phase concentration is the smallest at the cascade that is 0.1 times the blade height of the impeller.
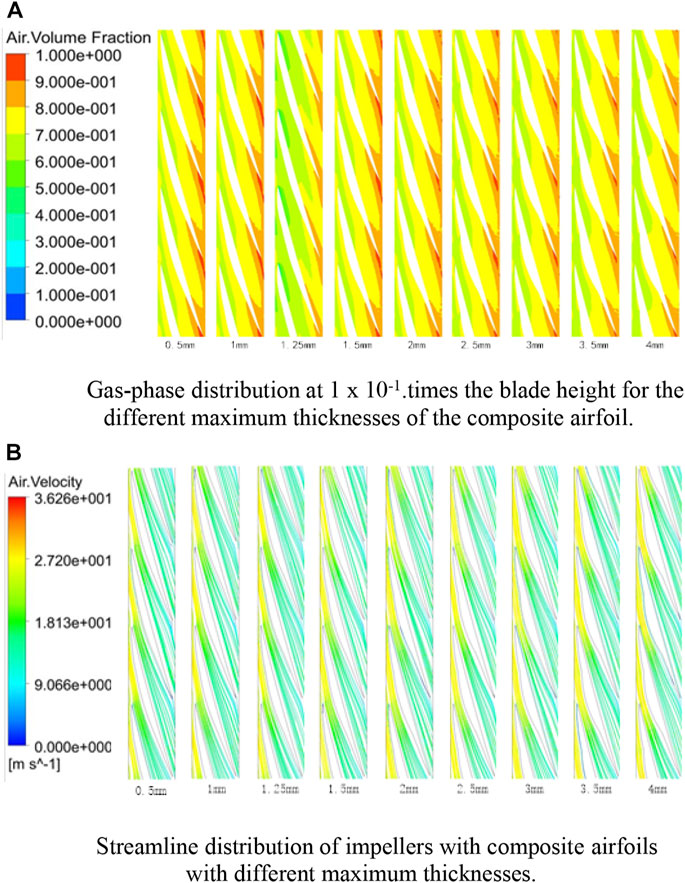
FIGURE 13. Cloud diagram of internal flow characteristics. (A) Gas-phase distribution at 1 × 10⁻¹. times the blade height for the different maximum thicknesses of the composite airfoil. (B) Streamline distribution of impellers with composite airfoils with different maximum thicknesses.
4.3.3 Impeller streamline distribution
As shown in Figure 13B, the streamline velocity is at its maximum at the impeller inlet, decreases along the flow channel direction and reaches the minimum at the impeller outlet, which is due to the work performed by the impeller of the multiphase pump to convert the kinetic energy of the fluid into pressure potential energy, which is finally reflected in the increase in the head obtained by the fluid. At the same time, streamline separation occurs near the pressure surface and suction surface of the airfoil. When the maximum thickness of the composite airfoil changes from 0.5 to 1.25 mm, the streamline separation on the airfoil surface slows down, and when the maximum thickness of the composite airfoil changes from 1.25 to 4 mm, the streamline separation on the airfoil surface increases. The reason is that the overall stall separation state of the airfoil is determined by the airfoil suction surface. With the increase in the maximum thickness of the composite airfoil on the main airfoil suction surface, which can improve the streamline separation on the airfoil’s surface. Therefore, by comparing the impeller streamline diagrams of the multiphase pump under different composite schemes, it can be seen that when the maximum thickness of the composite airfoil is 1.25mm, the stall angle of attack of the composite airfoil is the largest and the flow line adhesion on the airfoil’s surface is strong.
4.3.4 Distribution of turbulent kinetic energy in the impeller channel
In order to determine the energy change of the internal flow field of the multiphase pump, the turbulent kinetic energy of the impeller channel of the multiphase pump in nine schemes is analyzed in this section, as shown in Figure 14. It can be seen from the figure that the gradient change area of the turbulent energy level is concentrated on the inlet and outlet of the impeller, and the gradient change of the turbulent kinetic energy at the inlet is obvious. The change in the energy level gradient at the inlet is due to the change in the fluid flow state when the axial velocity of the fluid is converted to the direction along the impeller channel after the fluid enters the impeller, which is in an unstable state compared with the fluid in the inlet section, and finally leads to the increase in the energy level gradient. The change domain of the energy level gradient at the outlet is similar to that of gas-phase aggregation, indicating that the change in the turbulent kinetic energy at the outlet is related to gas-phase aggregation. The trapped gas leads to flow disorder in this region, and finally shows the increase in the turbulent kinetic energy level gradient. By comparing the changes in the turbulent kinetic energy gradient under different thicknesses, it was found that when the maximum thickness of the composite airfoil is 1.25 mm, the change in the turbulent kinetic energy gradient at the impeller outlet is the smallest, indicating that the fluid flow at the impeller channel outlet of the multiphase pump is more stable at this thickness.
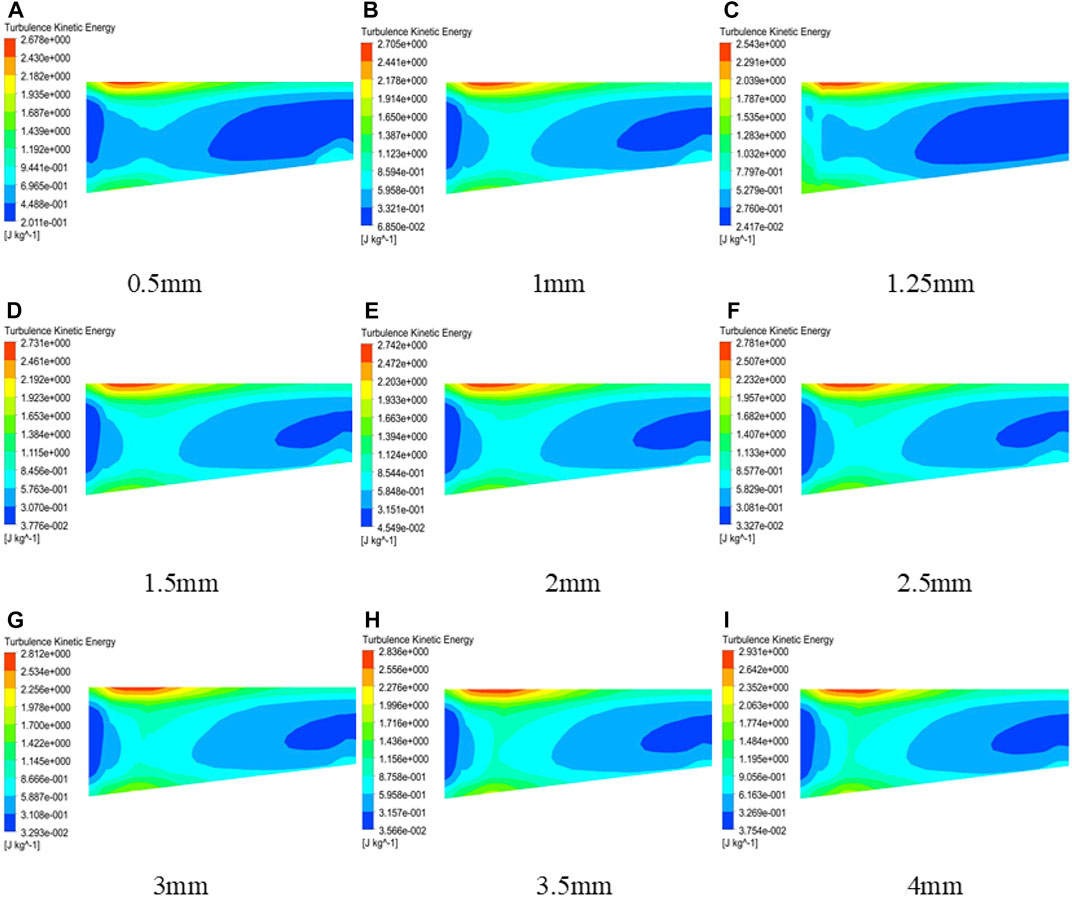
FIGURE 14. Distribution of the turbulent kinetic energy in the impeller passage with composite airfoils with different maximum thicknesses. (A) 0.5mm, (B) 1mm, (C) 1.25mm, (D) 1.5mm, (E) 2mm, (F) 2.5mm, (G) 3mm, (H) 3.5mm, (I) 1mm.
5 Conclusion
Based on the composite method in the middle of the suction surface of the main airfoil, we explored the influence of the change in the maximum thickness of the composite airfoil on the performance of the multiphase pump, determined eight composite schemes with the maximum thickness range of the composite airfoil within 0.5–4 mm, carried out numerical simulations under standard working conditions with an inlet air content of 30%–70%, and took the head coefficient and efficiency as the references for the external characteristics of the multiphase pump. Taking the gas-phase distribution and turbulent kinetic energy distribution in the impeller channel as the internal flow characteristics of the multiphase pump, the following conclusions were made.
1) The airfoil composite method uses the superposition of the suction surface of the main airfoil and the pressure surface of the composite airfoil. The blade thickness of the impeller follows the rule for thickening the 791 airfoil and was analyzed by combining the external and internal flow characteristics of the mixed pump. It was determined that the composite airfoil has the best effect when it is combined in the middle of the suction surface of the main airfoil. The maximum thickness of the composite airfoil refers to the way in which the main airfoil decreases linearly from the impeller hub to the shroud. Finally, the range of the maximum thickness of the composite airfoil is 0.5 mm–4 mm, and eight composite airfoil schemes were determined with 0.5 mm as the interval value.
2) By analyzing the external characteristics of the multiphase pump under different schemes, it was found that the head coefficient and efficiency of the mixed pump show a “hump” curve with the maximum thickness of the composite airfoil. The curve’s trend is characterized by increasing first and then decreasing. When the maximum thickness is around 1–1.5 mm, the maximum value is reached. Because the exterior characteristics of the mixed pump at the end of the interval are similar, this indicates that the interval value when the maximum thickness of the airfoil is taken is too large, and there is still a point within the interval that meets the maximum value of the head coefficient and efficiency. Therefore, a composite scheme with a maximum thickness of 1.25 mm was added. The results show that the external characteristics of the mixed pump are the best when the maximum thickness of the composite airfoil is 1.25 mm. When the volume fraction of the gas phase is 70%, the head coefficient of
3) Through the analysis of the internal flow characteristics of the multiphase pump, it was found that the gas-phase distribution and turbulent kinetic energy gradient in the impeller of the multiphase pump are improved to varying degrees with the change in the maximum thickness of the composite airfoil. When the maximum thickness is 1.25 mm, the gas-phase accumulation degree in the impeller channel is the smallest, and the change in the corresponding turbulent energy gradient is the smallest. This shows that the internal flow field of the multiphase pump can be improved by changing the maximum thickness of the composite airfoil. The internal flow characteristics of the multiphase pump are the best when the maximum thickness of the composite airfoil is 1.25 mm.
This study has achieved good results in hydraulic performance of modified mixed pump. However, due to technical conditions and workload, the data of airfoil parameters are not tracked when the airfoil is combined. The external characteristics and some parameters of internal flow field of the multiphase pump are analyzed only, which can not reasonably explain the performance change of the mixed pump from a micro perspective.
Data availability statement
The original contributions presented in the study are included in the article/supplementary material, further inquiries can be directed to the corresponding authors.
Author contributions
All authors listed have made a substantial, direct, and intellectual contribution to the work and approved it for publication.
Funding
This study was supported by the National Natural Science Foundation of China (No. 82179086), the Central leading local science and technology development projects “Development and industrialization of Bohai bay shallow water multiphase flow meter” and “Research on Installation Technology of Underwater Production System and General Technology of Safety Integrity Level Analysis (SIL) (No. 2019GXB01-01)” of High-tech Ship Scientific Research Program of Ministry of Industry and Information Technology of China.
Acknowledgments
This project is also strongly supported by the 2020 Gansu Provincial Water Conservancy Scientific Experimental Research and technology promotion project, and I would like to express my heartfelt thanks.
Conflict of interest
PJ and ZH were employed by the company Offshore Oil Engineering Co, Ltd. FL was employed by the Company Haimo Technologies Group Corp.
The remaining authors declare that the research was conducted in the absence of any commercial or financial relationships that could be construed as a potential conflict of interest.
Publisher’s note
All claims expressed in this article are solely those of the authors and do not necessarily represent those of their affiliated organizations, or those of the publisher, the editors and the reviewers. Any product that may be evaluated in this article, or claim that may be made by its manufacturer, is not guaranteed or endorsed by the publisher.
References
Cui, Y. (2009). Numerical simulation of hydrodynamic characteristics of airfoil of axial flow pump [D]. Yangzhou: Yangzhou University.
He, X., and Lao, X. (2014). Affecting parameters of lift coefficient of impeller wing of axial flow pump and their sequencing [J]. J. Hebei Tech. Coll. 2014 (01), 1–3.
Kim, J. H., Lee, H. C., Kim, J. H., Choi, Y. S., Yoon, J. Y., Yoo, I. S., et al. (2015). Improvement of hydrodynamic performance of a multiphase pump using design of experiment techniques[J]. J. Fluids Eng. 137 (8), 1–15. doi:10.1115/1.4029890
Liu, X., Wang, J., and Dai, Y. (2012). Aerodynamic design and modeling of composite new wing wind turbine blades. Mech. Des. Manuf. 2012 (03), 90–92.
Ma, X., Li, X., and Wang, N. (2011). The influence of vane spacing on the performance of a mixed pump [J]. J. Xihua Univ. Nat. Sci. Ed. 030 (006), 4872–4881.
Shi, G., Luo, K., and Liu, Z. (2020). Energy characteristics in impeller region of helical axial multiphase pump. J. drainage irrigation Mech. Eng. 38 (7), 670–676.
Shi, L., Fu, L., and Xia, Y. (2018). Simulation and test of influence of maximum camber position of airfoil on hydraulic performance of axial flow pump [J]. J. Agric. Mach. 49 (11), 148–154.
Suh, J. W., Kim, J. W., Choi, Y. S., Joo, W. G., and Lee, K. Y. (2018). Development of numerical Eulerian-Eulerian models for simulating multiphase pumps. J. Petroleum Sci. Eng. 162, 588–601. doi:10.1016/j.petrol.2017.10.073
Yan, D., Kovacevic, A., and Qiang, T. (2016). Numerical modelling of twin-screw pumps based on computational fluid dynamics[J]. ARCHIVE Proc. Institution Mech. Eng. Part C J. Mech. Eng. Sci. 1989-1996 (vols 203-210) 231 (24), 1. doi:10.1177/0954406216670684
Zhang, J. Y., Cai, S. J., Li, Y. J., Zhu, H., and Zhang, Y. (2016). Visualization study of gas–liquid two-phase flow patterns inside a three-stage rotodynamic multiphase pump. Exp. Therm. Fluid Sci. 70 (1), 125–138. doi:10.1016/j.expthermflusci.2015.08.013
Zhang, M., Shi, L., and Wang, Y. (2020). Influence of maximum thickness and maximum camber position of airfoil on hydraulic performance of axial flow pump. China rural water Resour. hydropower 2020 (09), 8–15.
Zhang, M., Shi, L., and Wang, Y. (2020). The influence of maximum airfoil thickness and maximum camber position on hydraulic performance of axial flow pump [J]. Rural Water Resour. Hydropower China 2020 (09), 8–15.
Zhang, W. W., Yu, Z. Y., and Zhu, B. S. (2017). Influence of tip clearance on pressure fluctuation in low specific speed mixed-flow pump passage. Energies 10 (5), 148–154. doi:10.3390/en10020148
Keywords: composite airfoil, maximum thickness, helical axial-flow, gas-liquid, multiphase pump
Citation: Han W, Nan H, Ju P, Zhang H, Li F and Li R (2022) Effect of the maximum thickness of a composite airfoil on the performance of a helical axial-flow gas-liquid multiphase pump. Front. Energy Res. 10:993974. doi: 10.3389/fenrg.2022.993974
Received: 14 July 2022; Accepted: 29 July 2022;
Published: 30 August 2022.
Edited by:
Xiaohu Yang, Xi’an Jiaotong University, ChinaReviewed by:
Shi Guangtai, Xihua University, ChinaXueqiang Li, Tianjin University of Commerce, China
Copyright © 2022 Han, Nan, Ju, Zhang, Li and Li. This is an open-access article distributed under the terms of the Creative Commons Attribution License (CC BY). The use, distribution or reproduction in other forums is permitted, provided the original author(s) and the copyright owner(s) are credited and that the original publication in this journal is cited, in accordance with accepted academic practice. No use, distribution or reproduction is permitted which does not comply with these terms.
*Correspondence: Haozhi Nan, Z3VhcW5tQG91dGxvb2suY29t; Rennian Li, bGlybkBsdXQuZWR1LmNu