 Gen Xiong1,2
 Dongzhe Lu
 Wenhua Wang
 Xin Li
- 1Key Laboratory of Far-shore Wind Power Technology of Zhejiang Province, Hangzhou, China
- 2Renewable Energy Engineering Institute, Power China Huadong Engineering Corporation Limited, Hangzhou, China
- 3State Key Laboratory of Coastal and Offshore Engineering, Dalian University of Technology, Dalian, China
- 4Faculty of Infrastructure Engineering, Institute of Earthquake Engineering, Dalian University of Technology, Dalian, China
- 5School of Civil Engineering and Architecture, Guangxi University for Nationalities, Nanning, China
Owing to the difficulties in the scaled rotor-nacelle assembly (RNA) and support structure design, and alleviation of small scaling effects, the limited dynamic model tests are conducted for the jacket offshore wind turbines (OWTs), which are extensively constructed in the offshore wind farms located in the depth of 40–50 m. To address this limitation, an integrated test method based on aero-hydro-structural elastic similarities is proposed in this study. It comprises a performance-scaled RNA model and a scaled support structure model. A redesigned blade model is adopted in the scaled RNA model to ensure the similarities of aerodynamic thrust loads without modifications of the scaled test winds. Moreover, auxiliary scaled drivetrain and blade pitch control are designed to simulate the operational states of a practical OWT. The scaled model of the OWT support structure is fabricated based on the joint hydro-structural elastic similarity, and the small scaling effects are mitigated by introducing sectional bending stiffness similarities. Subsequently, the dynamic model tests of an ultra-large jacket OWT under wind-only, wave-only, and combined wind and wave conditions are carried out. The accuracy of the fabricated OWT test model is validated based on the recorded responses, and the influence of the dominant frequencies on the dynamic responses of the OWT model is quantitatively evaluated using the wavelet packet-based energy analysis method. Further, the coupling mechanisms of the scaled OWT model under typical wind and wave loads are investigated, and the interactions between the environmental loads and OWT motions are proved.
1 Introduction
Offshore wind energy is gradually becoming a mainstream renewable energy source, and the massive deployment of offshore wind turbines (OWTs) has accelerated this trend over the past decade (Ren et al., 2022). According to the Global Wind Energy Council (GWEC, 2022), the installed capacities of offshore wind farms reached 21.1 GW in 2021, and that in China exceeded 80%. Although superior wind fields enhance the output of OWTs compared to that of onshore wind fields (Park et al., 2021), the interactions among the environmental loads, rotor-nacelle assembly (RNA), and support system pose several problems, such as motion of the support structure, resulting in increased asymmetrical aerodynamic loading on the rotor blades (Wang et al., 2022), particularly for ultra-large OWTs. To accurately predict the structural responses of OWTs under complex environmental conditions, numerous fully coupled simulation tools have been developed, such as the widely used GH Bladed (Bossanyi, 2011), SIMA (DNV, 2018), FAST v8/OpenFAST (Jonkman and Jonkman, 2016; Jonkman and Sprague, 2021), and HAWC2 (Larsen and Hansen, 2007). These coupled simulation tools employ blade element momentum theory and generalized dynamic wake model in aeroelastic analysis. Hydrodynamic loads on the highly slender and large structures are typically calculated via finite element analysis based on the dimensions of the support system using the Morison formula and potential flow theory, respectively. Meanwhile, the differences in the established RNA models in the above simulation tools should be pointed out. The flexibilities of rotor blades are generally simulated using the first two flapwise and the first edgewise modes in FAST v8 and OpenFAST, which is remarkably different from the corresponding finite element model using beam element in SIMA and HAWC2.
Presently, the extensively studies about the coupling mechanism of typical bottom-fixed and floating OWTs are carried out by researchers using the previously described simulation tools. For example, Kim et al. (2016) established the fully coupled numerical model of a monopile and jacket OWT in GH Bladed and investigated the differences in the structural responses between the monopile and jacket OWT. Ren et al. (2022) carried out the dynamic analysis of a multi-column tension leg platform floating OWT under operational and extreme environmental conditions in FAST v7 and investigated the tendon failure to examine the performance of OWT based on the accidental limit states specified in the design code DNV-RP-0286. Zhao et al. (2021) and Putri et al. (2020) studied the dynamic responses of a semi-submersible and spar-floating OWT using OpenFAST and SIMA, respectively, to elucidate the coupling effects between the RNA and mooring system. To verify the accuracy of numerical simulations, comparisons among the various coupled simulation tools for OWTs are performed as part of the IEA OC4 project (Robertson et al., 2014). According to the studies of Larsen et al. (2014), discrepancies in the predicted OWT coupled motions using different numerical tools are attributed to the variability of the essential parameters in the different numerical models. Therefore, the results obtained by numerical simulation need to be further compared and analyzed, and the dynamic model test provides an effective approach (Zeng et al., 2022).
For OWTs under wind and wave loading conditions, besides the structural elastic similarity, the aerodynamic and hydrodynamic loads similarities should also be satisfied to ensure high quality and accuracy in the OWT dynamic tests. For aerodynamic load similarity, it means that the viscous and inertia forces should be appropriately scaled, and the Reynolds number similarity is priorly applied in this case (Çengel and Cimbala, 2006). Hydrodynamic inertia and gravity loads dominate the motions of offshore structures under wave excitation, and the associated Froude number similarity is generalized in the physical model tests of offshore structures under wave loads (Chakrabarti, 1994). Moreover, the differences in the required flow velocity scale ratios between the Reynolds and Froude number similarities should be considered. Therefore, appropriate coordination of the Froude and Reynolds number similarities is a critical issue in OWT dynamic tests.
Various experimental methods have been devised to ensure accurate modeling of aerodynamic and hydrodynamic loads in OWT tests. Wang et al. (2017) performed dynamic model tests of a pentapod OWT under earthquake, wind, wave, and current, and hydrodynamic loading conditions and the OWT model were scaled based on the Froude number and structural elastic similarities. The aerodynamic thrust loads were appropriately scaled using an equivalent circular disc, whereas the gyroscopic effects of the rotor system were neglected. Froude number similarity was applied in the semi-submersible floating OWT model design, and an approximately geometrically scaled RNA model was fabricated by Martin (2011). Subsequently, dynamic tests of the semi-submersible floating OWT model under winds and waves were performed, and the test winds were calibrated to ensure accurate scaling of aerodynamic loads. Ahn and Shin (2019) reported that aggerated wind loads occurred on the support structure model owing to the improved test winds used to accurately model the aerodynamic loads on the geometric-scaled RNA model, which impaired the accuracy of the OWT dynamic model tests. To address this, Du et al. (2016) and Ahn and Shin (2020) proposed a performance-scaled RNA model with updated blade airfoils for the OWT model design, and the accuracy was verified by comparing the results with the numerical results for the prototype RNA.
In addition, according to the recently released offshore wind energy development guidelines effective over the next 5 years in China, the exploration of offshore wind energy at water depths of 30–50 m and the application of ultra-large WTs are primary concerns. Therefore, the potential of commercial application of jacket substructures should be emphasized. Before commercialization, the dynamic characteristics and coupling mechanisms of ultra-large jacket OWTs should be adequately investigated. Hence, dynamic model tests of the ultra-large jacket OWT must be performed to validate numerical analyses and address their limitations. These observations indicate that the scaled RNA model design directly determines the quality of the tests, whereas the design method for ultra-large RNA still warrants further study and validation because of the oversized blade dimensions and inherent complexities of servo systems. Moreover, owing to significant discrepancies between the longitudinal principle and sectional dimensions, small scaling effects should be considered in the scaled model design of ultra-large support structures.
To address these technical challenges associated with ultra-large jacket OWT dynamic model tests, an integrated test method based on aero-hydro-structural elastic similarities is proposed, comprising a performance-scaled RNA model and a scaled support structure model using joint hydro-structural elastic similarities. The remainder of this paper is organized as follows. The derivation of essential similarities for the scaled OWT model design is presented in Section 2. The redesigned scaled RNA model based on the released aerodynamic similarities and the scaled support structure model using hydro-structural elastic similarities are introduced. This section also describes the sensor arrangement and test facilities. The applied wavelet packet-based energy analysis method used for test data processing is introduced in Section 3. Furthermore, the validations of the fabricated OWT test model and the analysis of OWT coupling mechanisms based on the recorded data are presented in Section 4. Finally, based on the observed experimental phenomena, the conclusions regarding the OWT test model design method and coupling mechanisms under different environmental conditions and operation states are summarized in Section 5.
2 Physical dynamic test model design
2.1 Joint similarities for OWT model tests
For the OWT dynamic model tests, in addition to the structural elastic similarity expressed in Eq. 1, the aero and hydro similarities should be ensured, which are represented by the Reynolds and Froude number similarities defined in Eqs 2, 3, respectively. However, as defined in Eqs 2, 3, differences exist in the required velocity scale ratios between the Reynolds and Froude number similarities. Therefore, these similarities cannot be concurrently and strictly satisfied in the dynamic model tests. Considering that the objective of this study is to investigate the dynamic characteristics of an OWT under typical wind and wave loads, strict Reynolds number similarity is substituted by performance-scaled similarities, which include similarities of aerodynamic thrust loads and essential operational parameters. Moreover, hydro-structural elastic similarity is formulated by combining Eqs 1–3, as expressed in Eq. 4. Based on this equation, in addition to the length scale ratio λL, an inertia radius scale ratio λr is used in this study to alleviate the small scaling effects in the design of the scaled OWT support structure model sectional geometries (Huan et al., 2022). To ensure the accuracy of the dynamic model tests, an appropriate scale ratio should be determined before the design of the scaled OWT model. Based on the geometries of the prototype OWT, water depth, and capacities of the experimental facilities, the length scale ratio is designated as 1/75. Subsequently, the similarities between the additional parameters can be obtained, as listed in Table 1.
where λt is the time scale ratio; λρ, λE, and λv are the structural material density, elastic modulus, and velocity scale ratio, respectively.
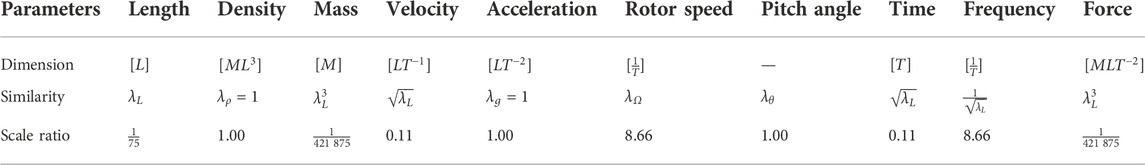
TABLE 1. Essential model parameter scale ratios defined by the ratio of model to prototype.
2.2 Performance-scaled test model design
2.2.1 Prototype OWT concept
The prototype jacket OWT is illustrated in Figure 1A. The original OWT comprised an upwind WT system and jacket substructure. The RNA of the upper WT system was identical to that of the DTU 10 MW baseline WT (Bak et al., 2013). According to the recorded environmental conditions in the southeastern offshore regions in China, the distance from the top of the jacket substructure to the mean sea level needs to be 30.15 m to ensure structural safety, and the hub height of DTU 10 MW WT is 119.00 m, so the tower height should be 88.85 m. The original tower height of DTU 10 MW WT is 115.63 m. Therefore, the tower height is redesigned as 85.48 m to satisfy the requirements under the practical environments. The basic parameters of the RNA and the tower are listed in Table 2. As depicted in Figure 1A, the mud braces and four levels of X-braces are mounted along the four-legged jacket to ensure steady operation of the WT system and structural safety at a water depth of 40.00 m. The geometry and structure of the support system are also shown in this figure.
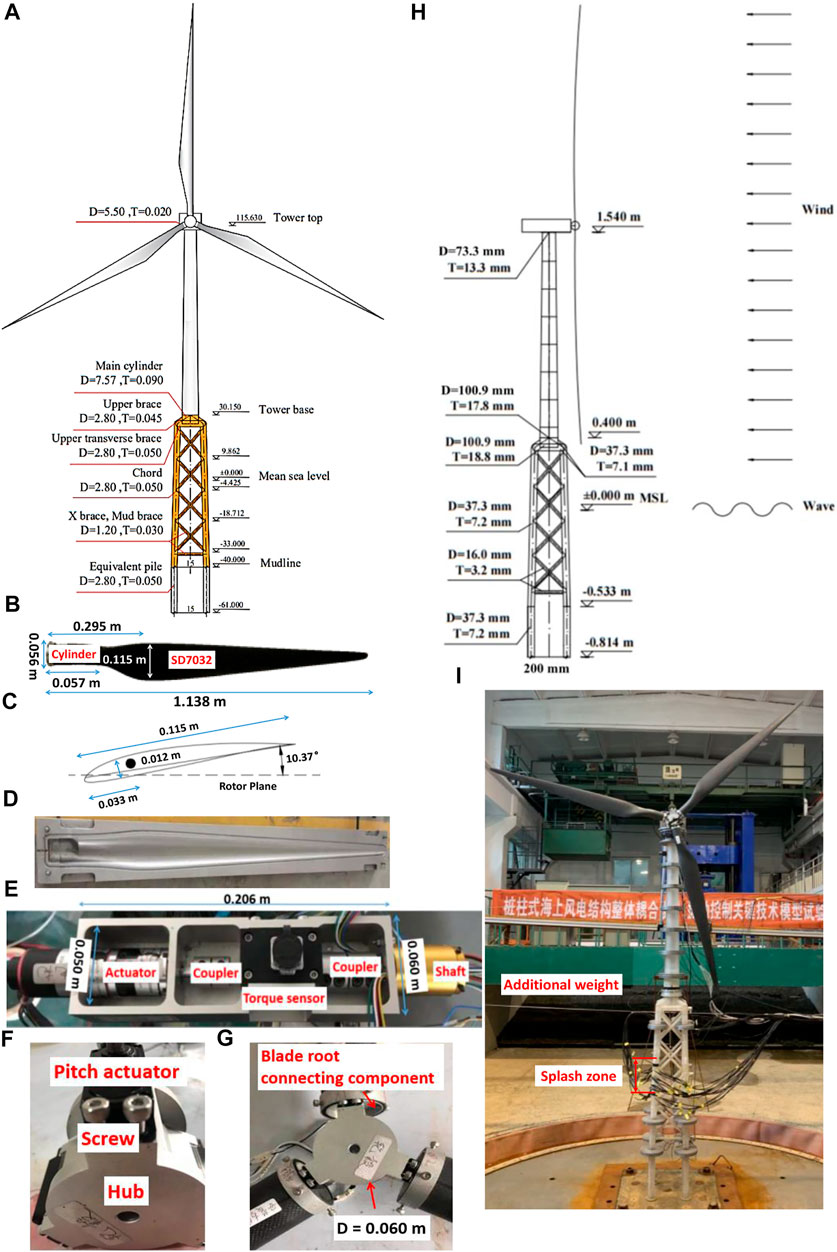
FIGURE 1. Design of performance-scaled test model. (A) Essential parameters of prototype jacket OWT (Unit: m); (B) carbon fiber blade model; (C) schematic of the blade model cross-section at maximum chord length; (D) steel mold; (E) arrangement of drivetrain system; (F) blade pitch system; (G) scaled hub model; (H) parameters of the support structure model; and (I) additional weights.
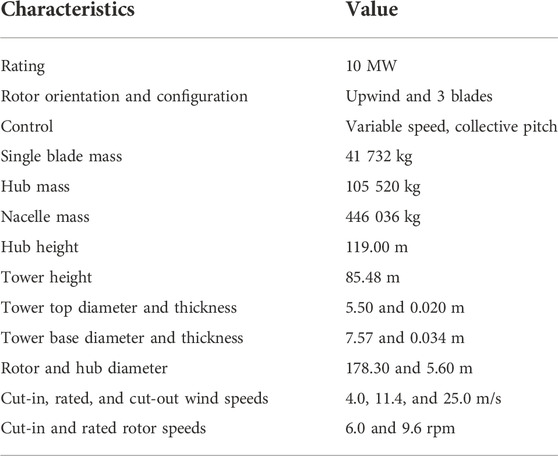
TABLE 2. Basic parameters of prototype OWT.
2.2.2 Scaled rotor-nacelle assembly model
Because of the length scale ratio and prototype RNA used in this study being consistent with the European Union LIFES50 + project, the recommended scaled blade model design in the LIFES50 + project is adopted (Lifes50, 2021). The updated SD7032 airfoil is selected in the performance-scaled blade model design and a circular section is used at the blade root to connect the blade and hub models. The fabricated scaled blade model is shown in Figure 1B. Moreover, the sectional chord length is altered, and the maximum chord length could reach 0.115 m to withstand test wind conditions generated using a simplified wind generation system, as depicted in Figure 1C. The mass of each blade model is strictly limited to 200 g; therefore, high-strength and low-density carbon fibers are used in the fabrication. Meanwhile, to ensure the smoothness of the blade model and fabrication quality, the steel mold shown in Figure 1D is utilized in the fabrication process.
A scaled drivetrain system comprising an actuator, torque sensor, and shaft is designed to ensure similarity of essential operational parameters, such as rotor speed and thrust load. In the scaled drivetrain arrangement shown in Figure 1E, the components are connected using couplers and tightened in an aluminum nacelle model. Sequentially, the scaled model of the nacelle is manufactured based on the drivetrain system arrangement.
An additional scaled blade pitch system is designed to deploy blade pitch control strategies during the tests, as shown in Figures 1F,G. Three-pitch actuators mounted in the transition piece between the blade root and hub model are used to regulate the blade pitch angles. The material of the hub model with a diameter of 0.06 m is the same as that of the scaled nacelle model, and the total mass of the scaled RNA model is 2,860 g, as listed in Table 3.
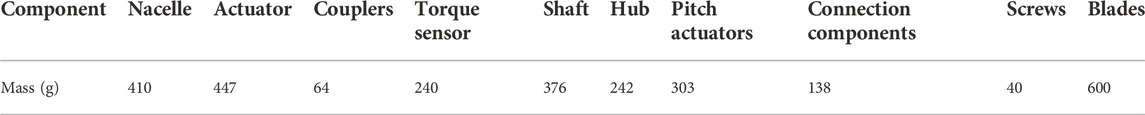
TABLE 3. Masses of the major components of scaled RNA model.
2.2.3 Scaled support structure model
Based on previous mechanical tests, polymethyl methacrylate (PMMA) is selected as the material for the scaled OWT support model owing to its advantages such as stable properties and convenient fabrication. The measured elastic modulus of PMMA is 3.85 GPa, with a density of 1,198 kg/m3. Subsequently, the inertial radius scale ratio for the scaling of sectional geometries is calculated to be 1/88.8 according to the proposed hydro-structural elastic similarity and length scale ratio. The principal dimensions of the support structural model, such as the height and sectional out-diameter of the tower and jacket model are determined by the length scale ratio, the member sectional thickness is scaled using the inertial radius scale ratio to alleviate small scaling effects and ensure fabrication accuracy. The scaled geometries of the tower and jacket models are shown in Figure 1H. Moreover, the density scale ratio is assumed to be 1.0; therefore, the additional weights are uniformly distributed along the support model to satisfy this assumption, except in the splash zone, as depicted in Figure 1I.
2.2.4 Scaled test cases and environmental conditions
Considering that the primary objective is to experimentally investigate the dynamic characteristics and coupling mechanisms of the jacket OWT, typical design load cases (DLCs) are selected according to the measured environmental conditions and offshore standard DNV GL-ST-0437 (DNV GL, 2016). Subsequently, the scale ratios listed in Table 1 are used to scale the recorded environmental conditions, as listed in the model scale column in Table 4. Three typical winds (DLCs 1–3) covering the cut-in to cut-out wind range are selected to study the coupling mechanisms of the dynamic response of OWT under different normal operation states. Additional extreme wind test case 4 is applied to investigate the dynamic behaviors of a parked OWT with the feathered rotor blades. Meanwhile, DLCs 5–8 are performed to investigate the dynamic responses of OWT under regular waves. To reveal the coupling mechanisms, subsequent dynamic model tests are conducted under combined conditions (DLCs 9–12). During the tests, the scaled winds and waves are aligned along the fore-aft (F-A) direction, as shown in Figure 2A. The rotational speed of the RNA model is regulated using the drivetrain system model, and the blade pitch and pitch-to-feather control strategies are deployed using the pitch control system model.
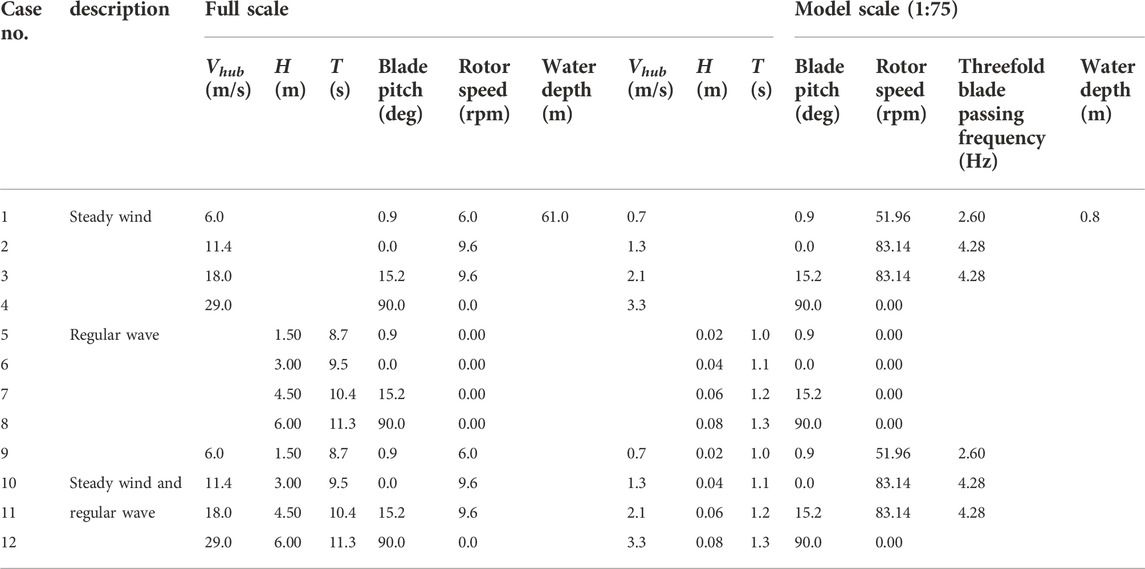
TABLE 4. Selected test cases.
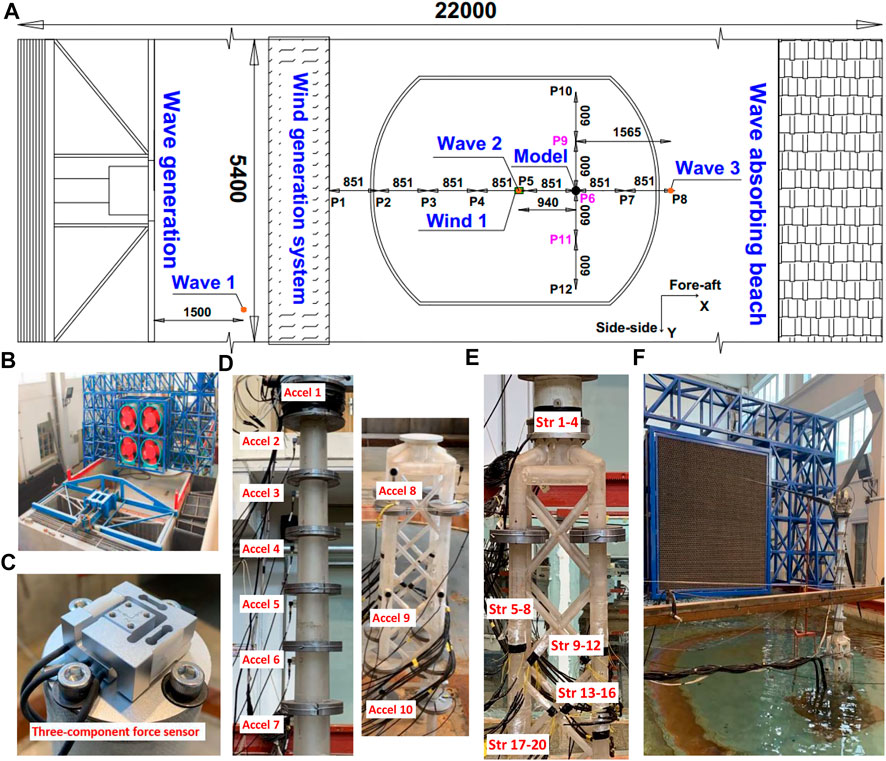
FIGURE 2. Primary sensor arrangement and test equipment. (A) Schematic of the model test basin (Unit: mm); (B) joint wave and wind load simulation system; (C) installed three-component load cell at the tower top; (D) acceleration sensor arrangement along model; (E) strain gauge arrangement; and (F) dynamic model testing of jacket OWT subjected to winds and waves.
2.3 Test equipment and sensor arrangement
A joint wind and wave simulation system developed by the State Key Laboratory of Coastal and Offshore Engineering at Dalian University of Technology was employed to generate scaled wind and wave conditions in the tests. Figure 2A shows the dynamic model tests of the jacket OWT model subjected to wind and wave loads. The model test equipment primarily included wave generation and wind generation systems, both of which are located on the left side of the basin, as shown in Figure 2B. Wave-absorber equipment is placed on the right side of the basin to reduce wave reflection. The dimensions of the basin are 22.0 × 5.4 × 1.2 m, and the maximum water depth is 1.0 m. The maximum height of generated waves is 0.33 m, and the allowable range of the wave period is 0.5–4 s. The usable area of the wind generation system is 2.54 × 2.54 m, and the maximum generated wind speed is 15 m/s.
The sensors used to record the input environmental conditions and dynamic responses of the OWT model are as follows. As depicted in Figure 1E, a torque sensor mounted in the nacelle was used to measure the torque of the designed drivetrain system, and the quality of the generated test wind fields was calibrated prior to testing using a wind sensor positioned at calibration points P1–P12, as shown in Figure 2A. Moreover, the accuracy of the wave generator was measured by the wave gauge numbered “wave 1” positioned in front of the facility and wave gauge numbered “wave 2” placed around the OWT model. An additional wave gauge numbered “wave 3” was used in the tests to record the far field wave profiles. A force sensor with three translational degrees of freedom (DOFs) was installed at the top of the tower in the model to measure the thrust loads, as shown in Figure 2C. The measuring range and resolution of the force sensors on the DOFs are 100 and 0.1 N, respectively. Figure 2D shows ten acceleration sensors with a range of 100 m/s2 uniformly arranged on the support structure in the F-A direction in the model to measure the motion of the structure under different loading conditions. Strain gauges were arranged at the tower base, and the local components of the jacket model measured the structural responses, as depicted in Figure 2E. The numbers and specifications of the sensors are listed in Table 5. In addition to sensor accuracy, the sensor mass was strictly limited to eliminate the undesirable influence of installed sensors on local structural responses. For instance, the force gauge mass should be as low as 65 g to satisfy this requirement. The layout of the dynamic model tests for the jacket OWT is shown in Figure 2F.
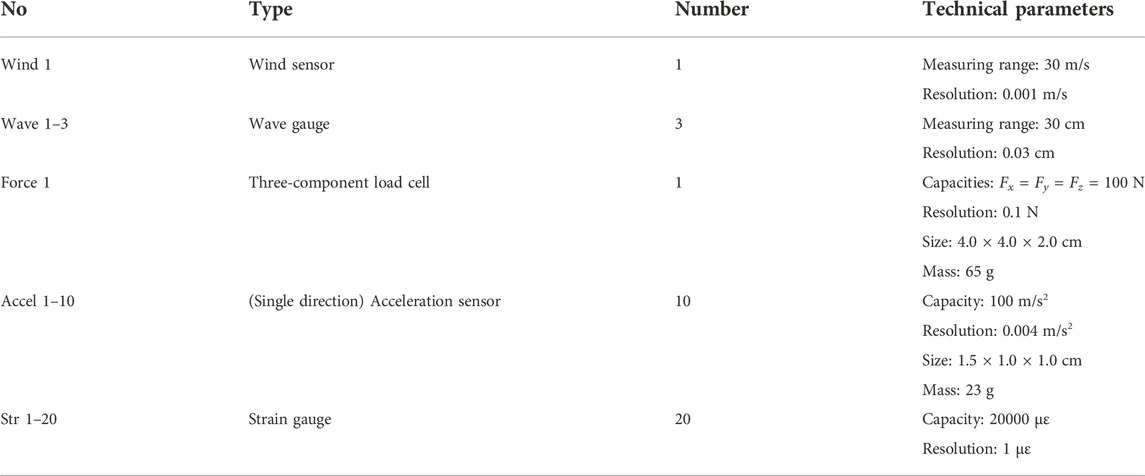
TABLE 5. Sensor specifications and arrangement in OWT dynamic tests.
2.4 Test wind field and wave calibrations
As depicted in Figure 2F, the wind generation system was pre-calibrated to ensure reliable generation of scaled wind fields during testing. Therefore, eight measurement points, P1–P8, were selected in the F-A direction, and the distance between pairs of points was set as 851 mm. The measured scaled wind speed of 2.1 m/s at the different points are listed in Table 6, and points P4–P6 are suitable for measurement compared with the theoretical values. Considering the fluctuations of the generated wind speed at these potential points, point P6 was selected as a feasible location. Moreover, the qualities of the wind speed at point P6 were evaluated based on the measured statistics at evenly distributed points P9–P12 in the side-to-side (S-S) direction. The recorded mean values at points P9 and P11 were consistent with the recorded data at point P6 and the theoretical value; thus, the accuracy of the test wind field at point P6 was confirmed. However, the test wind decreased at points P10 and P12 and the fluctuations in the rotor plane increased, thereby affecting the steady state condition of the test wind fields.
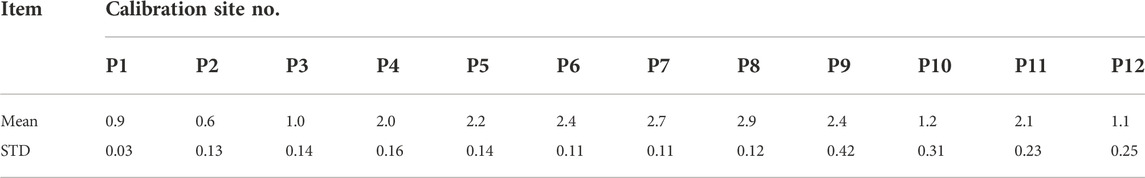
TABLE 6. Statistics of recorded wind speeds at different sites (Unit: m/s).
The wave generator was calibrated using three wave gauges arranged in the basin, as shown in Figure 2A. The recorded wave parameters for the regular wave test cases at the selected OWT model installation point are listed in Table 7. Comparison with the scaled wave parameters indicated that the recorded regular wave heights and periods were consistent with the corresponding theoretical values. Subsequently, the accuracy of the experimental setup was measured based on the calibration. The developed setup satisfied the requirements of the OWT dynamic model tests.
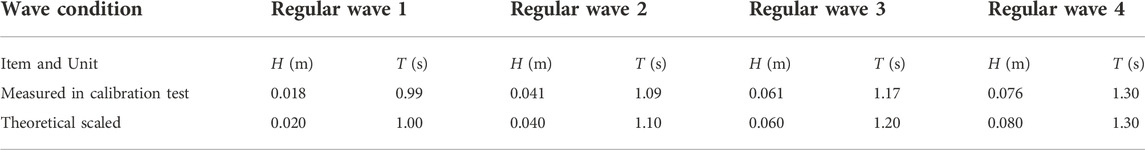
TABLE 7. Comparison of wave parameters between measured and theoretical scaled wave around the OWT model installation point.
3 Wavelet packet-based energy analysis method
In contrast to other signal processing methods, such as Fourier transform, fractal analysis, and Hilbert-Huang transform (Liao et al., 2017; Ling et al., 2019), wavelet packet analysis enables the decomposition of the input signal into low- and high-frequency bands (FBs) with the required resolution (Li et al., 2022), and the influence of the FBs of interest can be quantified using the energy ratio. Owing to these advantages, the wavelet packet-based energy analysis method (Zhang et al., 2021) was applied in subsequent data processing to identify the coupling mechanisms of the OWT model for the selected test cases.
As shown in Figure 3A, the initial signals xi,0,0 is decomposed into two sub-frequency components A1 and D1 with respect to the low-frequency sub-signal xi,1,0∗ expressed in Eq. 5 and the high-frequency sub-signal xi,1,1∗ expressed in Eq. 6. As is evident from these equations, the wavelet basis functions should be selected prior to the decomposition. Meyer wavelet basis functions (h(k) and g(k)) were used in this study, as expressed in Eqs 7, 8 (Zeng, 2016). The newly decomposed FBs can then be obtained after the second decomposition, resulting from the sub-signals in the previous layer. For example, the decomposed FBs AA2 and AD2 in the third layer are derived from FB A1 in the second layer. Based on the characteristics of the wavelet-packet-based energy analysis method, 2j FBs are obtained in the (j+1) layer after completing the j-th decomposition, and the general expressions of the decomposed sub-signals are expressed in Eqs 9, 10. Furthermore, the energy of each decomposed FB can be estimated using Eq. 11, the quantified influence of the decomposed FBs is evaluated based on the defined energy ratio ϕj, m in Eq. 12
where xi,j+1,2m∗ and xi,j+1,2m+1∗ denote the i-th decomposed low-frequency and high-frequency components of the m-th FB in the j-th layer, respectively; h(k) and g(k) represent the low-pass and high-pass filtered Meyer wavelet basis functions, respectively; k is a random number that varies from 1 to N; N denotes the number of discrete sampling points in the initial signal;
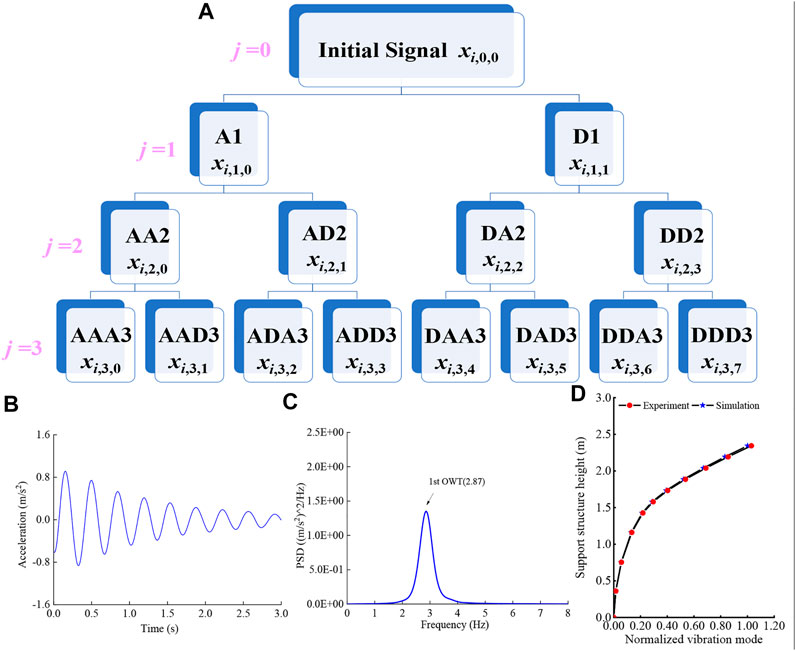
FIGURE 3. Schematic of the decomposed three-layer wavelet packet tree and free decay results of the OWT model under the parked state. (A) Schematic of the decomposed three-layer wavelet packet tree; (B) free decayed histories of tower top acceleration; (C) PSD of free decayed tower top accelerations; and (D) normalized first mode shapes of the scaled model and coupled numerical prototype OWT.
4 Dynamic model tests of scaled jacket OWT
4.1 Estimation of OWT model first natural mode
Before conducting the dynamic tests under winds and waves, a free decay test was performed to identify the first natural mode and nondimensional damping ratio of the OWT model. An initial tower-top displacement in the F-A direction was applied to the scaled test model under the parked state in still water. The measured free decay histories of the tower top acceleration are presented in Figure 3B, a generally decreasing trend is observed owing to structural damping. According to the empirical formula based on structural dynamics (Clough and Penzien, 2006), expressed in Eq. 13, the nondimensional damping ratio can be estimated based on the structural free decayed motions, and the estimated damping ratio of the OWT model is 4.4%. The OWT model damping ratio is less than 5%; therefore, it can be assumed to be a small damping system, and the first natural modes of the system can be identified based on the narrow band peaks of the frequency response functions (Bendat and Piersol, 1980). The power spectral density (PSD) of the free decayed tower top acceleration is depicted in Figure 3C, and the first natural frequency of the OWT model is estimated as 2.87 Hz based on the small damping system assumption. Furthermore, the first natural mode of the OWT model can be identified based on the PSDs of the recorded free-decayed tower and jacket accelerations using the distributed acceleration sensors along the support system model. The normalized acceleration sensor is shown in Figure 3D.
Furthermore, a fully coupled numerical model of the prototype jacket OWT was established in the simulation tool FAST v8 (Jonkman and Jonkman, 2016), and the damping ratio of the support system model was set as 3.3%. Therefore, the introduced small damping system assumptions are also applicable to the established coupled numerical model, and the first natural frequency of the prototype jacket OWT is 0.326 Hz based on the free decayed tower top accelerations. According to the frequency scale ratio defined in Table 1, the corresponding scaled theoretical value should be 2.82 Hz, which is consistent with the measure first natural frequency of the test model. The estimated and normalized first mode shapes of the coupled numerical model are shown in Figure 3D. Evidently, the first mode shape obtained from the numerical model is almost identical to the measured shape in the test model. This indicates that the first bending mode of the OWT support system is appropriately scaled in the tests using the proposed hydro-structural elastic similarity.
where
4.2 Dynamic response analysis of OWT model
According to the aero-hydro-elastic similarities, dynamic model tests of a scaled jacket OWT model were performed under the selected steady winds, regular waves, and combined test conditions. The results of steady wind test cases are compared to identify the variations of the structural responses under different operation states, and the regular wave test cases are conducted to investigate the effect of wave height and period. Then, the comparisons under combined wind and wave conditions are carried out to reveal the interactions among the wind, wave, and scaled OWT model responses. Each test case lasted for 330 s with a sampling frequency of 500 Hz, and the first 150 s of the recorded data in each test were discarded to eliminate the influence of transient effects on the results. The measured histories of the thrust and tower-top acceleration for the selected test cases listed in Table 4 are depicted in Figure 4, and the corresponding statistics are listed in Table 8.
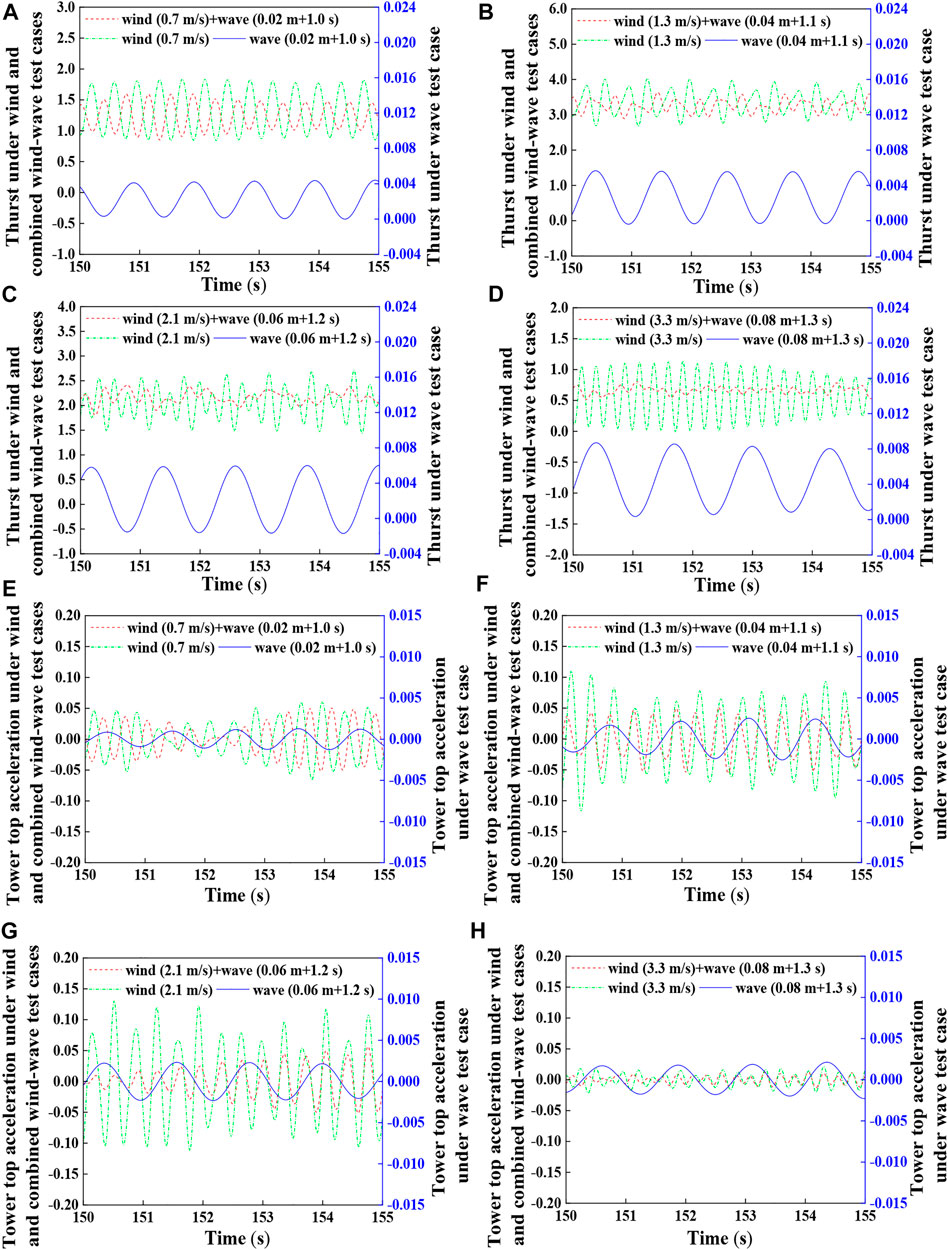
FIGURE 4. Time series of dynamic responses under different test winds and waves. (A–D) Time series of thrust under different test winds and waves; (E–H) time series of tower top acceleration under different test winds and waves.
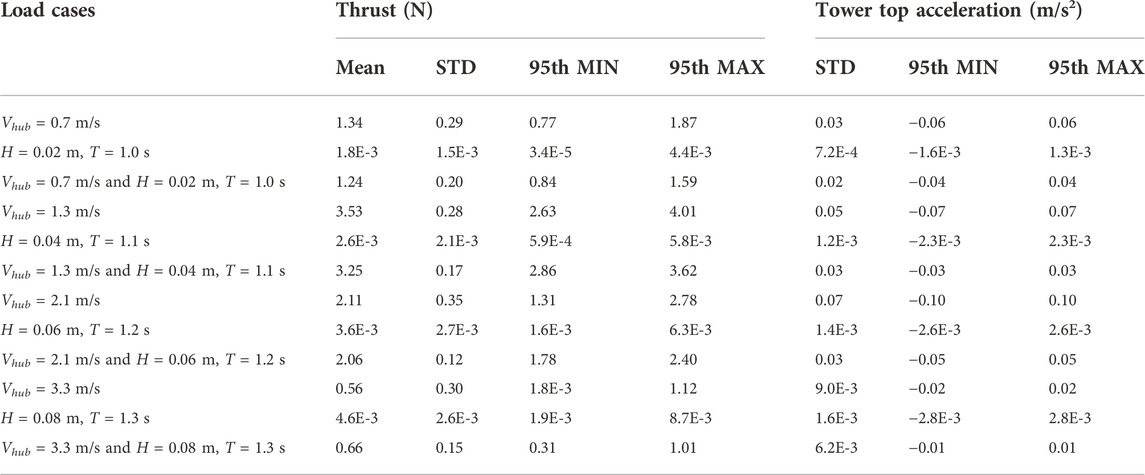
TABLE 8. Statistical comparisons of dynamic responses under different test winds and waves.
Subsequently, the wavelet packet-based energy analysis method introduced in Section 3 was applied to analyze the measured thrust loads and tower top accelerations. To distinguish the frequency components of interest, such as the OWT model fundamental and rotor model rotational frequencies, the decomposed bandwidth in the last layer should be less than 0.25 Hz. This implies that the decomposed FBs should exceed 210, and the time cost is much higher if the original recorded data are directly applied. Considering this requirement, low-pass filtering and down-sampling procedures were performed based on the recommended analysis method by Zayed (2021) to reduce the sampling rate of the original data to 9 Hz without frequency aliasing and maintain the precision and efficiency of data processing. The maximum identified frequency of the filtered data was 4.5 Hz. After five decompositions, 25 decomposed sub-signals were obtained in total. The bandwidth of each FB is 0.14 Hz, which can precisely identify the frequency components of interest. Moreover, the energy ratios of the OWT model responses calculated based on the time series of the decomposed sub-signals in the frequency range of 0–4.5 Hz under the scaled wind, wave, and combined test cases using Eq. 12 are presented in Figure 5.
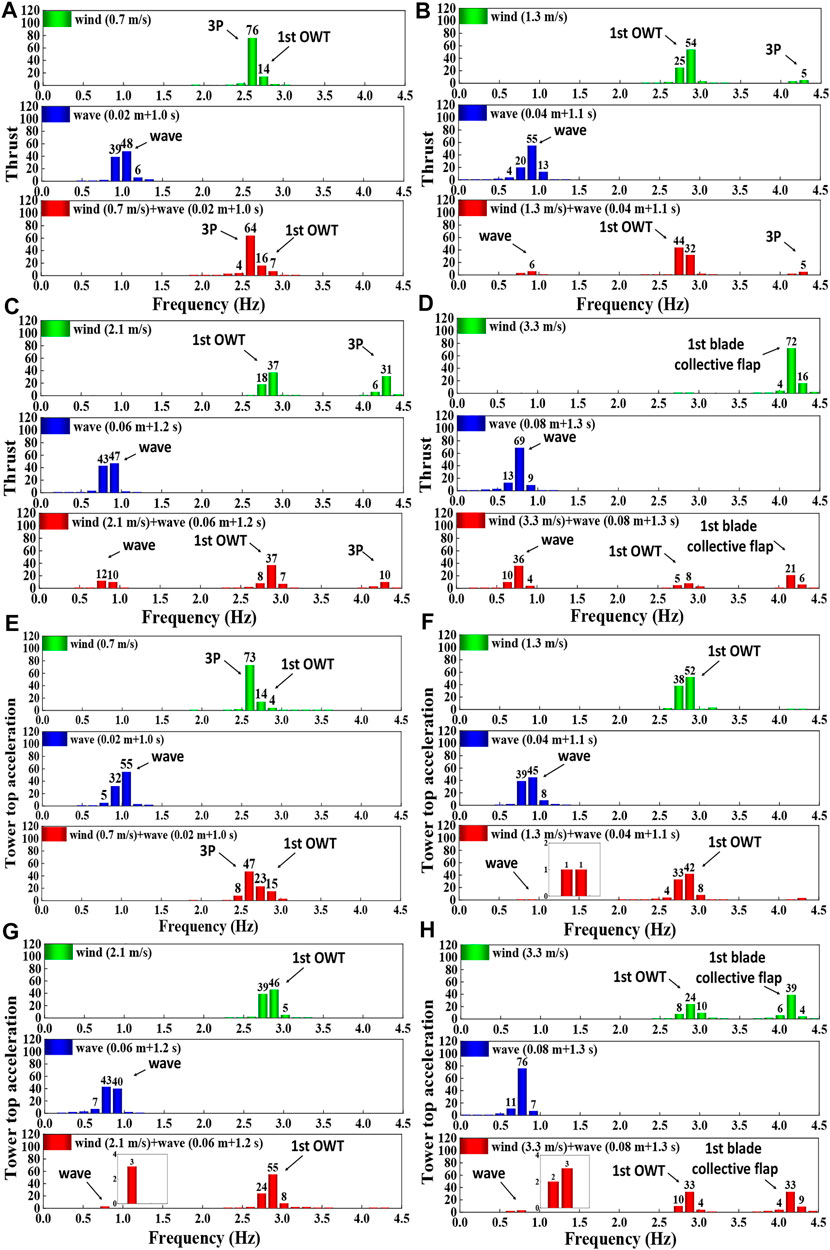
FIGURE 5. Wavelet packet-based energy ratios of dynamic responses under different test winds and waves (Unit: %). (A–D) Energy ratios of thrust loads under different test winds and waves; (E–H) energy ratios of tower top acceleration under different test winds and waves.
4.2.1 Dynamic characteristics of thrust loads under different test winds and waves
• Steady wind test cases
As listed in Table 8, the measured mean thrust loads under the steady test wind speeds of 0.7, 1.3, 2.1, and 3.3 m/s are 1.34, 3.53, 2.11, and 0.56 N, respectively, whereas the corresponding theoretical scaled values of the prototype OWT are 1.18, 3.57, 1.74, and 0.61 N. It can be observed that the modeled mean thrust loads are in agreement with the scaled values. For example, the discrepancies between the measured and theoretical scaled values are only 0.04 N under the test wind speed of 1.3 m/s. The observed discrepancies could be due to the precision of the data acquisition system and the limitations of the performance-scaled RNA model. The latter can ensure the similarity of aerodynamic thrust load under the specified wind speeds without adjusting the scaled test winds using Froude number similarity, rather than the entire range of cut-in to cut-out wind speed. Moreover, an increasing trend of the measured mean thrust loads is observed as the test wind speeds increase to the scaled rated wind speed of 1.3 m/s. Under a normal operation test wind of 2.1 m/s, pitch control strategies were deployed to alleviate the thrust loads on the rotor plane of the scaled OWT model. Minimal thrust loads are observed in the parked state under a test wind 3.3 m/s (rotor speed of 0 rpm and a blade pitch angle of 90°), and these are compared with the other test winds. The accuracy of the designed RNA test model was validated based on this comparison. The performance of the scaled rotor blades and the drivetrain and mechanical control systems, as well as the influence of test wind speeds and mechanical control strategies on the thrust loads were also determined.
The measured thrust load histories are shown in Figure 4. As indicated by the dotted green lines in Figures 4A–D, smoother curves are observed for test winds of 0.7 and 3.3 m/s, whereas the more complex variations are observed for other test winds. The reason for such differences in the thrust loads under different test winds can be explained based on the frequency domain shown in Figure 5. As depicted in Figures 5A,D, the unique dominant 3P and first blade collective flapwise FBs are observed under the test winds of 0.7 and 3.3 m/s, respectively. Consequently, approximately regular variations in thrust loads were observed under these test winds. Based on the definition of the energy ratio in Eq. 12, the quantified influences of the dominant FBs can reach 76% and 92% under each test wind, respectively.
For the remaining test winds, the influence of multiple FBs should be pointed out, as shown in Figures 5B,C. Particularly under the test wind of 2.1 m/s, the comparable influences of the scaled OWT model fundamental and 3P FBs are approximately 55% and 37%, respectively. Owing to the observed coupling effects between the scaled OWT model natural frequency and 3P under the test winds of 1.3 and 2.1 m/s, more complex variations in thrust loads under these test cases were observed.
Therefore, it can be concluded that the coupling mechanisms of the measured thrust loads are sensitive to the inflow test winds and related control strategies. The observed coupling effects between the natural and rotational frequencies of the OWT model should be highlighted.
• Regular wave test cases
Although the OWT model was in a parked state under regular wave test cases, the internal forces of the transition piece between the nacelle and tower models were recorded using the mounted load gauge at the transition piece. The recorded histories of the internal shear force in the F-A direction of the scaled OWT model are plotted using solid blue lines in Figures 4A–D. Evidently, the internal shear forces under the scaled regular waves are much smaller than the thrust loads under the test winds, even for the parked OWT model. According to the energy ratios of the recorded shear forces shown in Figures 5A–D, the wave frequency dominates the response under regular wave excitations. For example, the energy ratio of the wave FB under the regular wave condition (H = 0.04 m, T = 1.1 s) can exceed 90%, as shown in Figure 5B.
• Combined wind and wave test cases
To investigate the variations in the structural responses of the scaled OWT model under the combined wind and wave test cases, the measured statistics of the thrust loads are compared, as listed in Table 8. As shown in the table, for the normal operation scaled OWT model, the measured mean thrust loads under the combined test cases are smaller than those under the steady wind test cases. By contrast, a slightly increased mean thrust load of the parked scaled OWT model was observed under the extreme combined test case compared with the measured thrust load under the extreme steady wind test case. Moreover, in comparison with the STDs and 95th MAX values of the thrust load under steady test winds, significant reductions in such statistics are observed under the related combined wind and wave test cases, in contrast to the increased 95th MIN values of the response listed in the table. Based on the compared thrust load statistics, the variations in the dynamic responses of the scaled OWT model under the combined test cases are quite complex was systematically analyzed using the wavelet packet-based energy analysis method.
The measured histories of the thrust loads under the combined test cases are presented in Figures 4A–D. Evidently, the inflow test winds are the dominant environmental loads under the combined test cases compared to the scaled regular waves. According to the recorded thrust loads, the fluctuations of the response are smaller than the measured data under the steady test winds owing to the interactions among the winds, waves, and scaled OWT model under the combined test cases.
Figure 5 presents the energy ratios of the measured thrust loads under the combined test cases, and the effects of the dominant FBs were quantified using the wavelet packet-based energy analysis method. For the below-scaled rated wind speed combined test case shown in Figure 5A, the rotor rotational frequency dominates the thrust load, which is consistent with the dynamic characteristics under the below-scaled rated test wind. The influence of the dominant rotational FB can exceed 60% in such a combined test case. Accordingly, more complex coupling mechanisms were observed under the scaled rated and above-scaled rated wind speed combined test cases, as depicted in Figures 5B,C. In addition to the rotational frequency, the scaled OWT model’s first and wave frequencies should also be emphasized. For example, the influences of the OWT model structural, rotational, and wave frequencies under the combined test case (Vhub = 2.1 m/s, H = 0.06 m, T = 1.2 s) were approximately 52%, 10%, and 22%, respectively. Meanwhile, the proportion of the scaled OWT model’s fundamental frequency exceeded 70% in the rated combined test case. Therefore, the influence of the scaled OWT model structural frequency is the most significant for the operation of the OWT model under these test cases. Moreover, the first blade collective flapwise frequency were observed for the parked OWT model under the extreme combined test cases and its proportion reached approximately 27%, in addition to the wave and OWT model natural frequencies, as shown in Figure 5D.
Furthermore, the PSDs of the thrust loads under steady test winds and the related combined test cases are shown in Figures 6A–D. As indicated in the figures, the remarkable hydrodynamic damping effects on the OWT model structural, rotor rotational, and first blade collective flapwise frequencies under the combined test cases are observed compared with the steady test winds. Therefore, the alleviated fluctuations in the recorded histories of thrust load under combined test cases are observed.
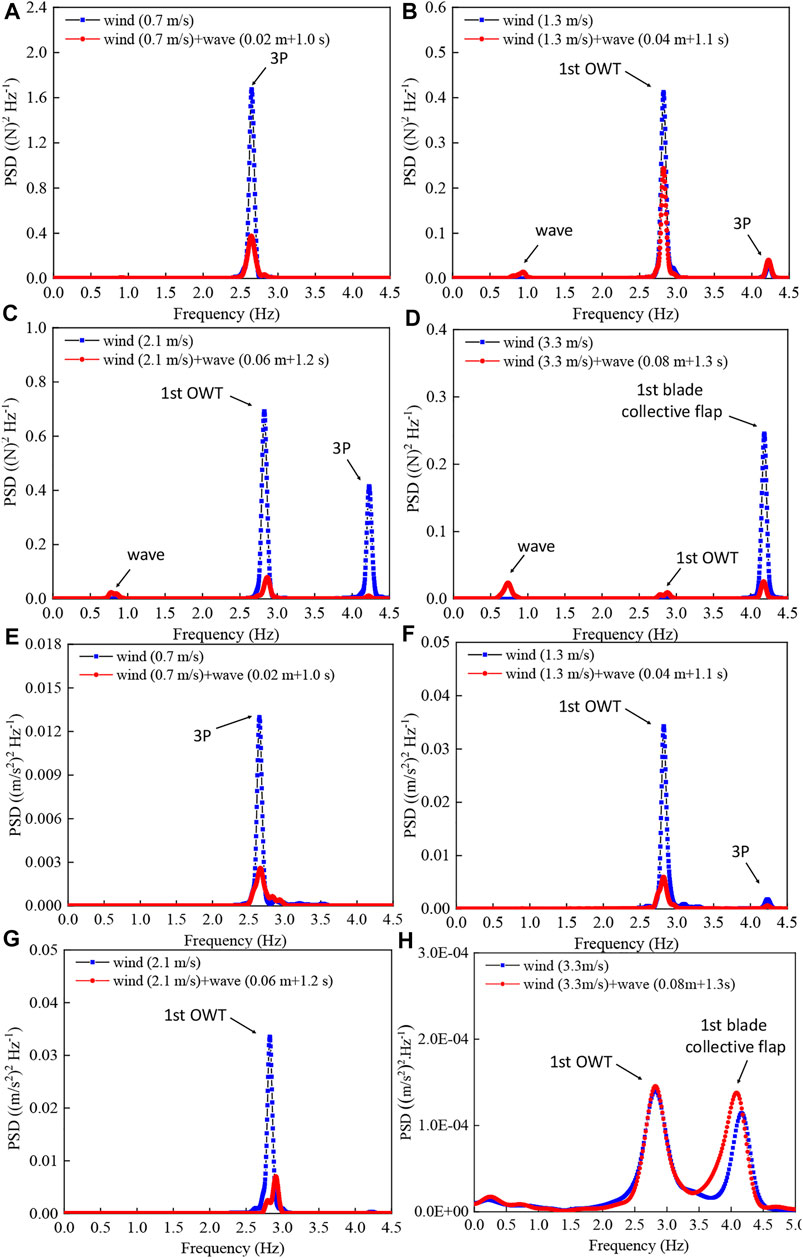
FIGURE 6. Power spectral densities of thrust and tower top acceleration under the steady wind and combined test cases. (A) Power spectral densities of thrust under DLC 1 and DLC 9; (B) power spectral densities of thrust under DLC 2 and DLC 10; (C) power spectral densities of thrust under DLC 3 and DLC 11; (D) power spectral densities of thrust under DLC 4 and DLC 12; (E) power spectral densities of tower top acceleration under DLC 1 and DLC 9; (F) power spectral densities of tower top acceleration under DLC 2 and DLC 10; (G) power spectral densities of tower top acceleration under DLC 3 and DLC 11; and (H) power spectral densities of tower top acceleration under DLC 4 and DLC 12.
The influence of the interactions among the wind, wave, and scaled OWT models under the combined test cases was quantified in the above studies. For the operation OWT test model, the OWT model fundamental and wave frequencies are also observed for these scaled rated wind speed combined test cases, in addition to the rotor model rotational frequency. Moreover, for the parked OWT model, the first blade collective flapwise frequency should also be pointed out.
4.2.2 Dynamic characteristics of accelerations under different test winds and waves
• Steady wind test cases
The increased tower top accelerations are observed under the steady test wind of 1.3 m/s compared with the scaled test wind of 0.7 m/s, as listed in Table 8. As introduced in the previous section, the blades of the scaled RNA model were pitched to 15.2°under a test wind of 2.1 m/s to alleviate the thrust loads, whereas the increased fluctuations in the STD of the thrust loads should be due to the non-uniformity of the generated test wind field. Accordingly, additional fluctuating tower top accelerations were observed under such a test wind. Meanwhile, by comparing with the normal operation test cases, the minimum tower top accelerations are observed for the parked OWT model with the blade pitch-to-feather control strategy under an extreme test wind of 3.3 m/s. The recorded histories of the tower top acceleration under various steady test winds are illustrated in Figures 4E–H.
As the dashed green lines in Figures 4E–G, the generally increasing trend can be seen with the inflow winds in the range of below-scaled to above-scaled rated test winds, and the most significant tower top accelerations are observed under the test wind of 2.1 m/s. Meanwhile, it can be seen that the deployed pitch-to-feather and shaft break procedures effectively mitigated the tower model motions of the parked OWT model under extreme test wind, in comparison with the normal operation test winds, as depicted in Figure 4H. Moreover, based on the wavelet packet-based energy analysis method, the dominant FBs of the tower top acceleration under each test case were identified and are presented in Figures 5E–H. For the normal operation OWT model, the influence of threefold blade passing FB should be highlighted under the test wind of 0.7 m/s, and the proportion of such FB can exceed 70%, as indicated in Figure 5E. Meanwhile, the fundamental FB of the OWT model dominates the response under the remaining operational test winds, as shown in Figures 5F,G. Further, the interactions between the OWT model first bending and RNA model first blade collective flapwise modes are proved under the extreme test wind, and the quantified comparable influence of each dominant FB is about 42% and 49%, respectively, as shown in Figure 5H.
According to the comparisons, it is approximately identical to the variations in the thrust load, and the first increasing and then decreasing trend of tower top accelerations under different test winds are revealed, which should be due to the deployed mechanical control strategies. Moreover, the coupling effects between RNA and OWT support structure models should be highlighted, even in the parked state.
• Regular wave test cases
Based on the statistics listed in Table 8, and the related histories shown in Figures 4E–H, for the presented regular wave test cases, the maximum tower top acceleration is observed under the test case with a wave height of 0.08 m; however, it is quite small with the related ones under the test winds. The energy distributions of the regular tower top accelerations under the regular wave test cases are depicted in Figures 5E–H, where it can be observed that the wave FB dominates the response, and the quantified influence exceeds 90%.
Although the tower top accelerations under the selected regular waves were small, the influence of wave loads on the tower motions of the scaled OWT model under the combined test cases is discussed in the subsequent section.
• Combined wind and wave test cases
The statistics of the tower-top accelerations under the combined wind and wave test cases are listed in Table 8. As presented in the table, either the STDs or the absolute values of the extreme statistics under the combined test cases are smaller than the relevant ones under the related test winds. Meanwhile, the wind was proven to be the dominant load under the combined test cases, as shown in Figures 4E–H. In comparison with the steady test winds, the recorded histories of the tower top accelerations reduced remarkably under the combined test cases, particularly for the normal operation OWT model.
The identified dominant FBs of the response under the combined test cases are illustrated in Figures 5E–H. Owing to the prominent influence of the wind load, the dominant FBs of the response under the combined test cases are approximately identical to the data under steady test winds, for example, the scaled OWT model fundamental, threefold blade passing, and first blade collective flapwise FBs, as depicted in the figures. However, the proportions of the domain FBs are different because of the additional input regular waves in the combined test cases. For example, the proportions of the dominant OWT model fundamental and threefold blade passing FBs are 38% and 55% under the combined wind and wave case (Vhub = 0.7 m/s, H = 0.02 m, T = 1.0 s), while the relevant ones are 18% and 73% under the related test wind.
Moreover, as indicated in Figures 6E–H, significant reductions in the amplitudes of the dominant frequencies caused by hydrodynamic damping under the normal operation combined test cases can be distinctly observed compared with the steady test winds, in addition to the approximate variations under the extreme wind and combined tests. It can be observed that the tower accelerations are reduced, particularly for the motions located at the upper part of the tower, as shown in Figures 7A–C. Furthermore, it can be seen the remarkably decreased 95th MAX values of the tower accelerations under the combined test cases compared with the related scaled steady test winds, especially for the accelerations located at the upper part of tower model. For example, the 95th MAX value of tower top acceleration can reach 0.1 m/s2 under the test wind of 2.1 m/s, while the relevant one is only 0.05 m/s2 under the related combined test case. The above reductions of tower motions under the normal operation combined test cases should be owing to the hydrodynamic damping effects on the dominant OWT model first bending mode in the frequency domain, as shown in Figures 6E–G. Meanwhile, the reductions of the amplitudes of dominant first bending and blade collective flapwise modes caused by hydrodynamic damping can not be observed under the extreme test case, and the tower accelerations under the combined case are comparable with the responses under the related extreme test wind, so it proves that the inflow wind dominates the tower motions under such extreme test case, as shown in Figures 6H, 7D. Moreover, owing to the activated OWT model first bending mode under the wind and combined test cases shown in Figures 6E–H, the maximum tower acceleration is located at the top of the scaled tower model.
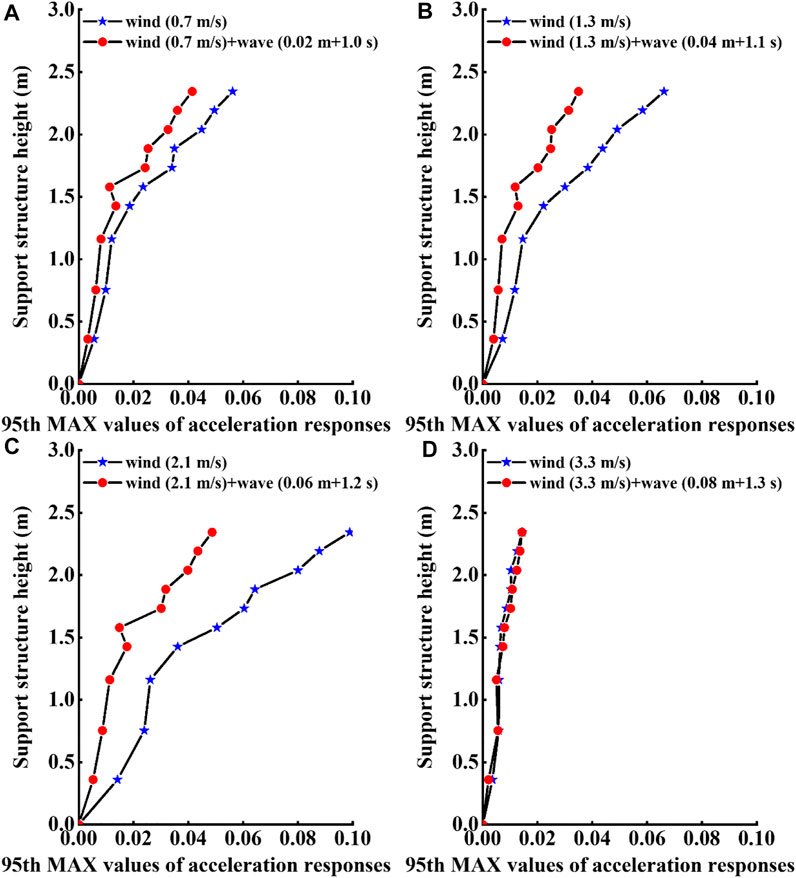
FIGURE 7. Schematic diagrams of the 95th MAX values of the acceleration along the model in the fore-aft direction under the steady wind and combined test cases. (A) Statistics of the measured accelerations under DLC 1 and DLC 9; (B) statistics of the measured accelerations under DLC 2 and DLC 10; (C) statistics of the measured accelerations under DLC 3 and DLC 11; and (D) statistics of the measured accelerations under DLC 4 and DLC 12.
The coupling mechanisms of the tower accelerations under the combined wind and wave test cases are studied, along with the identified dominant OWT model fundamental, RNA model rotational, and blade collective flapwise frequencies, and the distinctive hydrodynamic damping effects on the tower motions of the OWT model.
5 Conclusion
The dynamic characteristics and coupling mechanisms of an ultra-large jacket OWT were investigated based on dynamic model tests in this study. The scaled OWT model was designed based on aero-hydro-structural elastic similarities, and aerodynamic similarity was ensured using performance-scaled similarities consisting of thrust load and essential operational parameter similarities. Subsequently, a scaled blade model is designed, and additional drivetrain and pitch control systems are fabricated. The principal geometries of the support model were scaled using hydro-structural elastic similarity, and the additional weights were generally uniformly distributed to ensure the density scale ratio. The three-component force sensor, acceleration sensors, and strain gauges mounted in the model were used to record the thrust loads, motions, and internal forces of the scaled OWT model. Based on the free decay, typical winds and waves, and combined test cases, the dynamic characteristics of the scaled OWT model were studied, and the following conclusions were drawn.
(1) The first natural mode of the scaled OWT model was estimated based on the free decay test and small damping system assumptions, and it was in good agreement with that of the prototype OWT. Thus, the applicability of the recommended hydro-structural elastic similarity was validated to a certain degree.
(2) The observed variations in the measured mean thrust loads under different test winds were consistent with the related scaled theoretical values. Hence, the fabrication accuracy of the scaled RNA model using performance-scaled similarities was proven. The fluctuations under some test winds are due to the asymmetry of the generated test wind fields using the simplified wind generation system and the scaling effects of the small-scale ratio OWT model tests.
(3) For the scaled steady wind test cases, the influence of the test wind speeds and mechanical control strategies on the thrust loads was proved. It is approximately identical to the variations in thrust loads; the first increasing and then decreasing trend of tower top accelerations under the different test winds are revealed, which should be due to the deployed blade pitch control strategies.
(4) According to the quantified influence of dominant FBs using the wave packet analysis method in the frequency domain, it can be concluded that in addition to the OWT model first natural frequency, the coupling effects between the RNA and support model should be emphasized, even for the OWT model under the parked state, such as the observed first blade collective flapwise frequency under the extreme test wind.
(5) The wave FBs dominate the motions of the OWT model under regular wave inputs, whereas the responses are relatively small compared with those under the steady test winds. The inflow test winds proved to be the dominant loads for the structural responses of the OWT model under the combined test cases; therefore, the coupling mechanisms are approximately identical to the scaled wind test cases, in addition to the observed wave FBs. However, owing to the influence of additional wave inputs under the combined test cases, the quantified influence of the dominant FBs differed from those under the scaled steady test winds.
(6) A significant decrease in the structural motions was observed under the normal operation test cases compared with the responses under steady test winds, which were caused by hydrodynamic damping under the combined test cases. Hence, although the motions excited by wave loads are smaller than those related to wind loads, the induced hydrodynamic damping effects should be pointed out, particularly for the normal operation OWT model.
(7) In future studies, a coupled aero-servo-hydro-elastic numerical model under winds and waves will be established, and fully coupled analyses under different limit states will be performed. Moreover, detailed comparisons of the measured test data with the analyzed results of the fully coupled numerical model will be performed to validate the observed coupling mechanisms and simulation accuracy of the coupled simulation tool.
Data availability statement
The original contributions presented in the study are included in the article/Supplementary Material, further inquiries can be directed to the corresponding author.
Author contributions
Conceptualization, DL; methodology, DL and GX; investigation, GX and ZP; data analysis GX, DL, and ZP; writing—first draft preparation, writing, review and editing, GX, DL, WW, and XL; visualization and proofreading, GX, QL, and WW; supervision and funding acquisition, WW and XL; WW and XL set the objectives of the research. All authors contributed to the article and approved the submitted version.
Funding
The authors acknowledge the support of the National Natural Science Foundation of China (Grant Nos. 51939002 and 52001052).
Conflict of interest
GX, ZP, and QL were employed by Power China Huadong Engineering Corporation Limited.
The remaining authors declare that the research was conducted in the absence of any commercial or financial relationships that could be construed as a potential conflict of interest.
Publisher’s note
All claims expressed in this article are solely those of the authors and do not necessarily represent those of their affiliated organizations, or those of the publisher, the editors and the reviewers. Any product that may be evaluated in this article, or claim that may be made by its manufacturer, is not guaranteed or endorsed by the publisher.
References
Ahn, H., and Shin, H. (2020). Experimental and numerical analysis of a 10 MW floating offshore wind turbine in regular waves. Energies (Basel) 13, 2608–2617. doi:10.3390/en13102608
Ahn, H., and Shin, H. (2019). Model test and numerical simulation of OC3 spar type floating offshore wind turbine. Int. J. Nav. Archit. Ocean Eng. 11, 1–10. doi:10.1016/j.ijnaoe.2017.09.010
Bak, C., Zahle, F., Bitsche, R., Kim, T., Yde, A., Christian Henriksen, L., et al. (2013). Department of wind energy I-report description of the DTU 10 MW reference wind turbine. Copenhagen, Denmark: Department of Wind Energy.
Bendat, J., and Piersol, A. (1980). Engineering applications of correlation and spectral analysis. Hoboken, New Jersey, United States: John Wiley & Sons.
Çengel, Y. A., and Cimbala, J. M. (2006). Fluid mechanics: Fundamentals and applications - 1st ed. McGraw-Hill.
Du, W., Zhao, Y., He, Y., and Liu, Y. (2016). Design, analysis and test of a model turbine blade for a wave basin test of floating wind turbines. Renew. Energy 97, 414–421. doi:10.1016/j.renene.2016.06.008
Huan, C., Lu, D., Zhao, S., Wang, W., Shang, J., Li, X., et al. (2022). Experimental study of ultra-large jacket offshore wind turbine under different operational states based on joint aero-hydro-structural elastic similarities. Front. Mar. Sci. 9, 915591. doi:10.3389/fmars.2022.915591
Jonkman, B., and Jonkman, J. M. (2016). FAST user’s guide: Version 8.16.00. Golden, CO: National Renewable Energy Laboratory.
Jonkman, J. M., and Sprague, M. (2021). OpenFAST documentation. Golden, CO: National Renewable Energy Laboratory.
Kim, B., Jin, J., Bitkina, O., and Kang, K. (2016). Ultimate load characteristics of NREL 5-MW offshore wind turbines with different substructures. Int. J. Energy Res. 40, 639–650. doi:10.1002/er.3430
Larsen, T. J., Yde, A., Verelst, D. R., Pedersen, M. M., Hansen, A. M., and Hansen, H. F. (2014). IEA annex 30 offshore code collaboration continued (OC4) phase I+II.2014. Denmark: Roskilde.
Li, Y., Ning, F., Jiang, X., and Yi, Y. (2022). Feature extraction of ship radiation signals based on wavelet packet decomposition and energy entropy. Math. Problems Eng. 2022, 1–12. doi:10.1155/2022/8092706
Liao, K., Lai, X., Zhou, Z., and Zhu, Q. (2017). Applying fractal analysis to detect spatio-temporal variability of soil moisture content on two contrasting land use hillslopes. Catena (Amst) 157, 163–172. doi:10.1016/j.catena.2017.05.022
Lifes50 (2021). Qualification of innovative floating substructures for 10MW wind turbines and water depths greater than 50m. Stuttgart: University of Stuttgart.
Ling, T., Zhang, L., Huang, F., Gu, D., Yu, B., and Zhang, S. (2019). OMHT method for weak signal processing of GPR and its application in identification of concrete micro-crack. J. Cent. South Univ. 26, 3057–3065. doi:10.1007/s11771-019-4236-y
Martin, H. R. (2011). Development of a scale model wind turbine for testing of offshore floating wind turbine system. Orono: University of Maine.
Park, M., Park, S., Seong, B., Choi, Y., and Jung, S. P. (2021). Current status and prospective of offshore wind power to achieve Korean renewable energy 3020 plan. J. Korean Soc. Environ. Eng. 43, 196–205. doi:10.4491/ksee.2021.43.3.196
Putri, R. M., Obhrai, C., Jakobsen, J. B., and Ong, M. C. (2020). Numerical analysis of the effect of offshore turbulent wind inflow on the response of a spar wind turbine. Energies (Basel) 13, 2506. doi:10.3390/en13102506
Ren, Y., Venugopal, V., and Shi, W. (2022). Dynamic analysis of a multi-column TLP floating offshore wind turbine with tendon failure scenarios. Ocean. Eng. 245, 110472. doi:10.1016/j.oceaneng.2021.110472
Robertson, A., Jonkman, J., Vorpahl, F., Popko, W., Qvist, J., Frøyd, L., et al. (2014). Offshore code comparison collaboration continuation within IEA wind task 30: Phase II results regarding a floating semisubmersible wind system. in Proceedings of the International Conference on Offshore Mechanics and Arctic Engineering - OMAE 9B. San Francisco, California. June 8-13, 2014. U.S. Department of Energy. doi:10.13140/2.1.2822.9121
Wang, W., Gao, Z., Li, X., and Moan, T. (2017). Model test and numerical analysis of a multi-pile offshore wind turbine under seismic, wind, wave, and current loads. J. Offshore Mech. Arct. Eng. 139, 1–17. doi:10.1115/1.4035305
Wang, Y., Shi, W., Michailides, C., Wan, L., Kim, H., and Li, X. (2022). WEC shape effect on the motion response and power performance of a combined wind-wave energy converter. Ocean. Eng. 250, 111038. doi:10.1016/j.oceaneng.2022.111038
Zayed, A. I. (2021). Sampling theorem for two dimensional fractional Fourier transform. Signal Process. 181, 107902. doi:10.1016/j.sigpro.2020.107902
Zeng, J. (2016). Wavelet threshold image denoising algorithm based on MATLAB different wavelet bases. Intelligent Comput. Appl. 6, 6–8.
Zeng, Y., Shi, W., Michailides, C., Ren, Z., and Li, X. (2022). Turbulence model effects on the hydrodynamic response of an oscillating water column (OWC) with use of a computational fluid dynamics model. Energy 261, 124926. doi:10.1016/j.energy.2022.124926
Zhang, S., Zhang, L., Ling, T., Fu, G., and Guo, Y. (2021). Experimental research on evaluation of soil water content using ground penetrating radar and wavelet packet-based energy analysis. Remote Sens. 13, 5047. doi:10.3390/rs13245047
Keywords: offshore wind turbine, scaled model design, basin model test, dynamic characteristics, wavelet packet-based energy analysis method, wind and wave loads
Citation: Xiong G, Lu D, Pan Z, Wang W, Li X and Liu Q (2023) Experimental study of dynamic characteristics of an ultra-large jacket offshore wind turbine under wind and wave loads using aero-hydro-structural elastic similarities. Front. Energy Res. 10:992854. doi: 10.3389/fenrg.2022.992854
Received: 13 July 2022; Accepted: 21 September 2022;
Published: 06 January 2023.
Edited by:
Wei Cheng, Center, TaiwanReviewed by:
Sangeet Patra, Siksha O Anusandhan University, IndiaThanh-Tuan Tran, Kunsan National University, South Korea
Copyright © 2023 Xiong, Lu, Pan, Wang, Li and Liu. This is an open-access article distributed under the terms of the Creative Commons Attribution License (CC BY). The use, distribution or reproduction in other forums is permitted, provided the original author(s) and the copyright owner(s) are credited and that the original publication in this journal is cited, in accordance with accepted academic practice. No use, distribution or reproduction is permitted which does not comply with these terms.
*Correspondence: Dongzhe Lu, bHVkb25nemhlQG1haWwuZGx1dC5lZHUuY24=