 Naibin Jiang1
 Guangyun Min
94% of researchers rate our articles as excellent or good
Learn more about the work of our research integrity team to safeguard the quality of each article we publish.
Find out more
ORIGINAL RESEARCH article
Front. Energy Res., 15 September 2022
Sec. Nuclear Energy
Volume 10 - 2022 | https://doi.org/10.3389/fenrg.2022.990525
This article is part of the Research TopicAdvanced Modeling and Simulation of Nuclear ReactorsView all 14 articles
First, the theory of wet modal analysis and vibration response analysis are introduced, and the semi-empirical vibration equation is derived in this article. Then, the structural models of the fuel rod of M310 and EPR are introduced, and the fuel rod is simplified to a multi-span continuous simply supported beam model subject to multi-point constraints. The fuel rod is simplified as a simply supported beam, and the springs and dimples are equivalent to elastic constraints. In addition, based on ANSYS-APDL, the wet modal analysis and response analysis of fuel rods are carried out. The modal information and transverse vibration response of the fuel rod of M310 and EPR are compared. In addition, combined with the actual operating conditions of EPR, the effects of different transverse and axial flow velocities on the transverse vibration response are discussed. Finally, different failure conditions are designed to explore the impact of clamping failure on the vibration characteristics of the fuel rod of EPR. The results have shown that compared with the fuel rod of M310, the fuel rod of EPR has a lower natural frequency and larger amplitude; the transverse flow velocity has a greater impact on the transverse vibration response; grid failure would reduce the natural frequency of fuel rods, and different positions of failure have different effects on the different-order natural frequencies of fuel rods.
Structures subjected to an axial or transverse flow are common in many processes related to energy generation and conversion. One important phenomenon limiting the development and reliability of these applications is related to flow-induced vibration (FIV), which arises from the fluid–structure coupling (Kaneko et al., 2014; de Santis and Shams, 2017). FIV is one of the factors that would also endanger the operation safety of nuclear power plants (Liu et al., 2017; Ferrari et al., 2020). For example, many structures of nuclear power plants, such as fuel assembly (Planchard, 1985; Ho et al., 2004), reactor internals (Ansari et al., 2008; Choi et al., 2016), and U-tube steam generators (Hassan et al., 2002; Jiang et al., 2017), would vibrate due to the influences of turbulent flow. This vibration is so-called FIV, which belongs to fluid–structure interaction (FSI) vibration. In a pressurized water reactor (PWR), as the heat source of a nuclear reactor, the operating state of the fuel assembly is directly related to the safety of the reactor (Gu et al., 2006). However, under the action of FIV, the transverse vibration of fuel assembly would cause the width of the flow channels between assembly and assembly to vary. Then, the varying width may cause neutron flux fluctuation (Pázsit and Analytis, 1980; Viebach et al., 2018), which would also cause power oscillation and endanger the stable supply of energy. Incidents due to FIV leading to fuel assembly failure have occurred in the past; hence, it is critically important to consider the FIV during the design process (Blevins, 1979; Païdoussis, 1981; Wang and Ni, 2009). The FIV for fuel assembly subjected to turbulent flow attracts many researchers’ interests not only because of its theoretical significance in fluid mechanics but also its applications in nuclear engineering.
Fuel assembly is composed of fuel rods, control rods, spacer grids, and mixing vane grids. Each fuel rod in the fuel assembly is subjected to axial cooling flow and will vibrate vigorously due to the loading imposed by the high axial cooling fluid. To understand the mechanism of the FIV of the fuel rods subjected to fluid loads, many researchers proposed different theories such as self-excited models, parametric excitation models, and forced vibration models (Reavis, 1969; Gorman, 1971; Chen and Wambsganss, 1972). However, the first two of them have fatal defection, limiting their application range. It seems that the forced vibration models are more appropriate, feasible, and could be improved easily (Kaneko et al., 2014). However, the most current dynamics based on forced vibration models for this kind of FIV just consider the effects of the fluid field on fuel rods and fewer effects of fuel rods on the fluid field.
In general cases, the amplitude of FIV of fuel rods is small; nevertheless, it could wear the cladding of fuel rods and make the cladding become thinner (Kim, 2010). This wear phenomenon between fuel rods and cladding is so-called grid-to-rod fretting (GTRF) wear. This progressive GTRF wear of fuel rods is also a key factor that affects the structural integrity of fuel assembly. The GTRF wear is a very complex physical phenomenon, which could be affected by many factors, such as the shape of the springs and the dimples, the clamping force, the flow field in the reactor, and the nonlinear vibration caused by the coolant flow. In addition, manufacturing defects, unreasonable design of fuel rods, and spacer grids may also lead to GTRF wear. In this regard, many researchers have carried out theoretical and experimental research related to GTRF wear, such as research on the FIV mechanism of fuel rods and research on calculation methods of vibration and wear of fuel rods. For example, Rubiolo P. R. has presented a probabilistic method to predict the fretting wear performance of fuel rods. In this approach presented by him, the dynamic response of the nuclear fuel rods can also be calculated by a nonlinear vibration model (Rubiolo, 2006). Kim K. T. has proposed a guideline for fuel assembly and spacer grids to minimize the GTRF wear, which can be used to develop advanced fretting wear resistance technologies (Kim, 2010). Westinghouse has developed a method based on computational fluid dynamics (CFD) to predict the GTRF wear in the fuel inlet region (Yan et al., 2011). These studies have important guiding significance for FIV response and the anti-fretting wear design of fuel rods and can improve the safety and economy of the reactor.
In this work, the FIV responses of M310 and EPR have been studied, and the influencing factors of the response of EPR have also been systematically researched. Compared with M310, EPR has higher power and longer fuel rods. In other words, a more optimized design has been adopted in EPR to meet the higher requirements for safety performance. In order to compare the mode and vibration responses of the fuel rods of M310 and EPR, the models of these two fuel rods are constructed. Then, the mode and vibration responses of the fuel rods of M310 and EPR are compared. The works in this article could provide analytical ideas and a theoretical basis for the optimization of vibration suppression design and the safety evaluation of fuel rods of EPR.
The fuel rod placed in the coolant of the pressure vessel is a typical FSI structure. For an FSI model, the modal analysis is more complicated due to the coupling effect between fluid and structure. However, the wet modal analysis has taken account of the coupling effect. The coupling equation of an FSI model can be written as follows:
where
The fluid loads
where
For the free vibration without considering damping, Eq. 2 can be simplified into
If let
where
Then, Eq. 4 can be substituted into Eq. 3, and it can be obtained by the eigenvalue equation:
By solving Eq. 5, the n-order natural frequency
In this article, the calculation of wet modal analysis is based on ANSYS-APDL.
On the basis of wet modal analysis, further response analysis can be carried out. Then, the vibration behavior of fuel rods can be obtained by response analysis.
According to the modal superposition method, the displacement can be written as follows:
where
The Rayleigh damping hypothesis is introduced here, and Eq. 6 is substituted into Eq. 2. Then, it can be obtained that
where
Combing with Eq. 6 and assuming that the responses between different modes are independent, it can be obtained that
Furthermore, it can be obtained that
The vibration of fuel rods is a random vibration. According to the mechanism of random vibration (Jiang et al., 2018), it can be obtained that
where
By definition, the equation of the autocorrelation-based spectrum can be written as follows:
where
Assuming that the turbulence flow is statistically uniform, it can be assumed that the lag phase of
where
Eq. 12 and Eq. 11 are substituted into Eq. 9, the general expression of vibration response can be obtained:
It is considered that the vibration displacement of fuel rods can be generated by the pulsating part of turbulent flow. Then, it can be obtained that
where
Both uniform fluid excitation and velocity are composed of average and fluctuation terms, which is
The relationship between spectral density below can be obtained from the pulsation analysis, which is
Furthermore, the spectrum is defined by a positive frequency function, which is
where
The transfer function can be expressed as follows:
where
Eqs 15–20 are substituted into Eq. 13, which leads to
In order to simplify Eq. 21, we make the following three assumptions here:
a) The coherence function has nothing to do with frequency but only changes the spatial relationship of fluid excitation. Then, it can be obtained that
where
b) The spatial correlation is only effective when
c) The vibration modes are independent, which lead to
Eqs 22–24 are substituted into Eq. 21, which leads to
where C,
The root-mean-square (RMS) values of the i-order mode of fuel rods caused by turbulent flow are shown in Eq. 25. This equation is obtained based on some assumptions and experimental data, so it has the property of a semi-empirical equation.
For PWR, the axial flow along the fuel rods is not completely uniform, and the equivalent axial velocity can be expressed as follows:
where Q is also the empirical coefficient measured by experiment, and
Eq. 26 is substituted into Eq. 25, and it can be obtained that
where
For PWR, the transverse flow along the fuel rods is variable, which can be expressed as follows:
where
Eq 28 is substituted into Eq. 25, and it can be obtained that
where
For the sake of conservatism, the RMS values under the action of axial and transverse flow are linearly added to estimate the maximum vibration response, which leads to
For modes with similar frequencies, the probability of obtaining a synchronous maximum vibration response is very critical. In this case, the maximum vibration response
where when the difference between frequency and frequency is less than 10%,
In China, third-generation pressurized water reactors have been adopted in the Taishan nuclear power plant (Peng and Li, 2008), which are EPR designed for Chinese nuclear power plants (CEPR) (Xiao et al., 2015). Compared with the M310 reactor, a more optimized design has been adopted in EPR to meet the higher requirements for safety performance (Gu et al., 2006). Two kinds of fuel assemblies can be used in EPR: one is HTP-type fuel assembly designed by Siemens, and the other one is AFA-3G LE-type fuel assembly designed by AREVA. For the strategic cooperation with France, the type of fuel assemblies for the Taishan nuclear power plant is AFA-3G LE (Gu et al., 2006; Xiao et al., 2015).
The design of the AFA-3G LE-type fuel assembly is based on the AFA-3G L-type fuel assembly. Also, the AFA-3G LE-type fuel assembly has 265 fuel rods and 24 guide tubes arranged in a 17 × 17 pattern. Compared with the AFA-3G L-type fuel assembly widely used in Chinese pressurized water reactors, the AFA-3G LE-type fuel assembly also has different structural characteristics on the grid and fuel rods.
The length of the AFA-3G LE-type fuel assembly is 4,802 mm. The number of grids is eleven, of which eight are mixing vane grids, and the others are three spacer grids. In order to be compatible with EPR, along the flow direction of coolant, the span length of these grids is slightly larger at the bottom of the fuel assembly and slightly smaller at the top of the fuel assembly.
As shown in Figure 1, there are two spacer grids at the bottom of the fuel assembly, and the distance between these two spacer grids is relatively small. There are eight mixing vane grids and one spacer grid on the top of the fuel assembly, which are in the active area of a nuclear reactor.
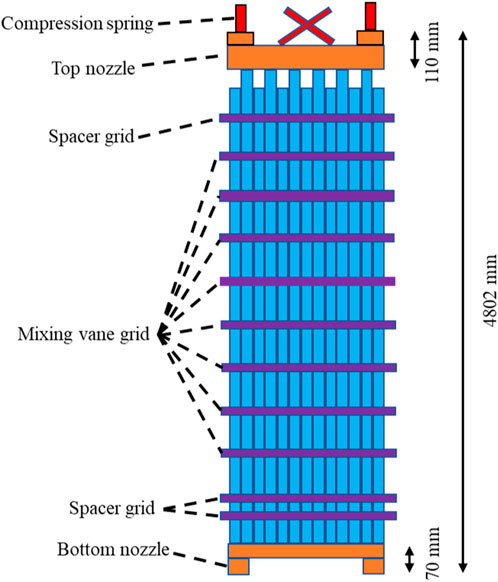
FIGURE 1. Schematic diagram of the AFA-3G LE fuel assembly.
It can be seen from Figure 2 that the fuel rods of AFA-3G LE fuel assembly are composed of bottom and top end plugs, fuel pellets, springs, and supporting tubes. Considering that pressure inside fuel rods and the strain of cladding may change during operation, such as irradiation creep, swelling, or gas generated during nuclear fission, gas chambers are reserved at the top and bottom of cladding, and the fuel pellets are compressed by springs.
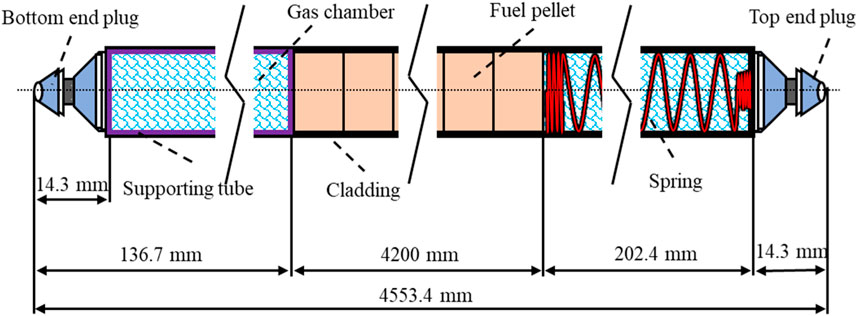
FIGURE 2. Schematic diagram of the fuel rod of EPR.
For the AFA-3G LE fuel assembly, the length of each fuel rod is 4,553.4 mm, and the outer diameter and thickness of cladding are 9.5 and 0.57 mm, respectively. The fuel assembly is constrained by a grid at several points in its axial direction. As an in-grid cell component is used to maintain the stability and enhance the stiffness of fuel rods, the grid is composed of several Zr-4 alloy straps welded with each other. As shown in Figure 3, each fuel rod is constrained by two springs and four dimples, keeping the fuel rod’s stability. The constraint of the grid to each fuel rod can prevent the fuel rod from transverse jumping and allows axial thermal expansion.
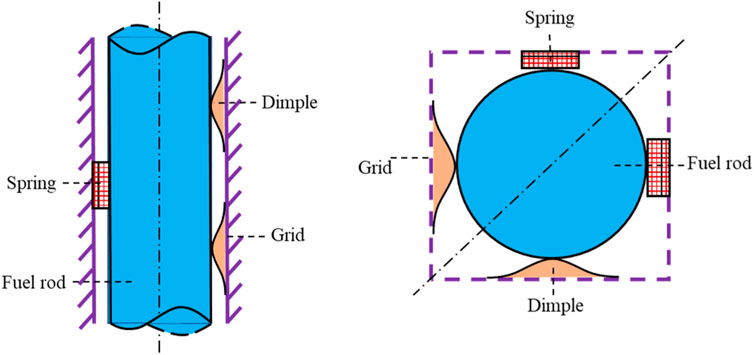
FIGURE 3. Schematic diagram of a fuel rod constrained by the grid.
From Figure 3, it can also be obtained that fuel rods are constrained by two springs and four dimples located in each grid. These constraint points are vertical to the axis of fuel rods, and these constraints are symmetrical along the diagonal of the grid. Therefore, a single fuel rod can be simplified as a plane Euler beam, and the dimples and springs are equivalent to elastic constraints, which are shown in Figure 4.
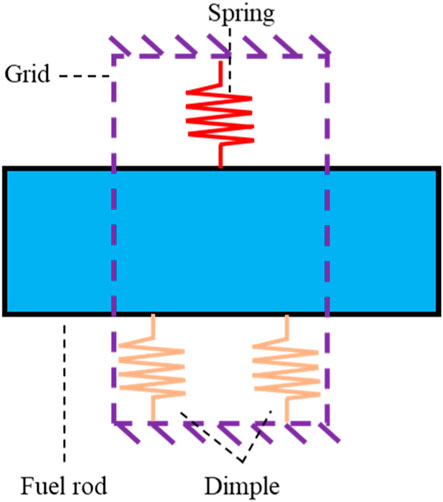
FIGURE 4. Schematic diagram of elastic constraints.
Therefore, it can be obtained from the previous analysis that a fuel rod can be regarded as a model subject to multi-point constraints. Also, in the mechanical analysis, the model subject to multi-point constraints can be regarded as a multi-span continuous simply supported beam.
In summary, a simplified model of fuel rods is shown in Figure 5, with elastic constraints within each grid on the fuel rods.
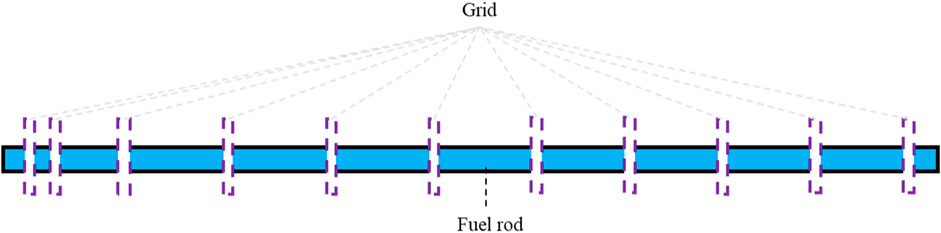
FIGURE 5. Schematic diagram of a multi-span continuous simply supported beam of EPR fuel rods.
The factors that affect the vibration characteristics of fuel rods are stiffness and mass. Due to the presence of a gas gap between fuel pellets, the fuel pellets do not provide bending stiffness. Therefore, when analyzing the FIV characteristics of fuel rods, it can be considered that the stiffness of fuel rods is determined by the stiffness of cladding. The contribution of other parts of fuel rods to the stiffness of fuel rods is small, and only the contribution of other parts to the mass of fuel rods is considered.
Considering a unit length fuel rod with a diameter D and a thickness
At the same time, the influence of coolant on fuel rods should be considered in the wet modal analysis of fuel rods. The static fluid loads of coolant to fuel rods can be equivalent to additional mass to fuel rods, and the additional mass is converted into cladding, which is
where
Therefore, the equivalent linear density of fuel rods is
where
In addition, the material of cladding of EPR is M5 alloy. Mitchel et al. have exhibited a specific empirical relationship between Young’s modulus of M5 alloy and temperature (Dutkiewicz et al., 2017), which is
where E is Young’s modulus.
Under operating conditions, the average temperature of the nuclear reactor is about 583 K, so Young’s modulus of M5 alloy is 76.9 GPa. According to the COGEMA technical report of AREVA, Poisson’s ratio of M5 alloy and the density of cladding can be considered as 0.37 and 6,500 kg/m3, respectively.
Finally, the physical parameters that would be used in the wet modal analysis are shown in Table 1.
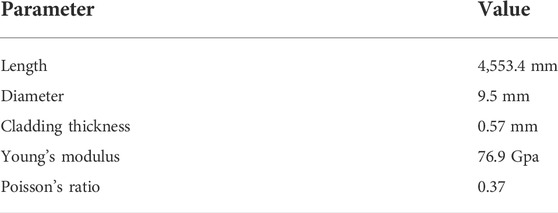
TABLE 1. Physical parameters of EPR fuel rods.
The accuracy of the finite element model could directly affect the rationality of calculation results. The multi-span continuous simply supported beam model should be modeled from the key points to the lines, from bottom to top. Then, three-dimensional Beam4 elements are used to simulate fuel rods here, and the Combine14 element is used to simulate the elastic support between the springs, dimples, and fuel rods.
The ANSYS-APDL is used for wet modal analysis, and the block Lanczos method is used to extract modal information here. The real constants that would be used in each element in the ANSYS-APDL are shown in Table 2.
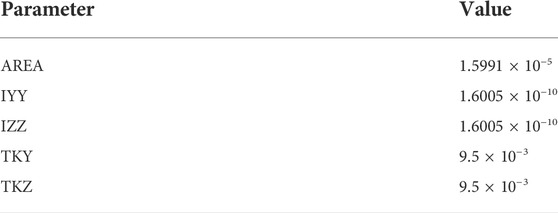
TABLE 2. Real constants used by the Beam4 element.
When establishing a finite element model because the density of fuel rods in its axial direction has a different distribution, it is necessary to establish elements on fuel rods by sections. Also, in order to arrange spring elements on fuel rods, it is necessary to establish corresponding nodes according to the actual situation. In order to avoid axial jumps or rotation of fuel rods, the axial translation and rotation displacement of nodes are both constrained.
The technology of the M310 nuclear reactor is very mature, so it is widely used in China. The length of fuel rods of EPR is longer than M310, and the number of grids of them is also different. So, their vibration characteristics would also be different. Based on this concept, the wet modal analysis of M310 is also carried out here, and the differences in wet modal analysis between M310 and EPR are also compared.
Through the simplified model and model parameters in Table 1 and Table 2, the corresponding finite element model can be established. The natural frequency of fuel rods of EPR and M310 can be extracted by the block Lanczos method, which is shown in Figure 8, Table 3 and Table 4.
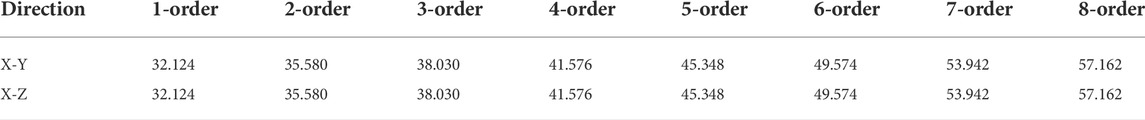
TABLE 3. Frequency of EPR/hz.
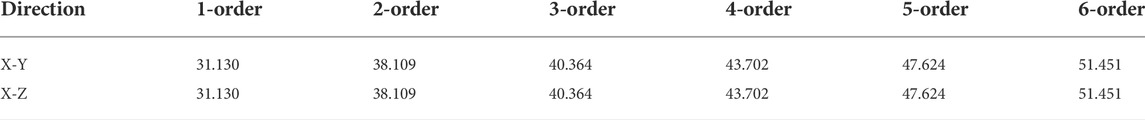
TABLE 4. Frequency of M310/hz.
It can be seen from Table 3 and Table 4 that the natural frequencies on the X-Y and X-Z planes for M310 and EPR are equal. The reason is that the geometric structure and constraints of the finite element model are highly symmetrical. Then, based on this concept, the results of one of the planes can be used for analysis for simplicity. From Figure 6, the 1-order natural frequency of EPR is larger than that of M310, but when the mode order is greater than 1-order, the natural frequency of EPR is smaller than that of M310, mainly because the length of EPR fuel rods is longer than that of M310.
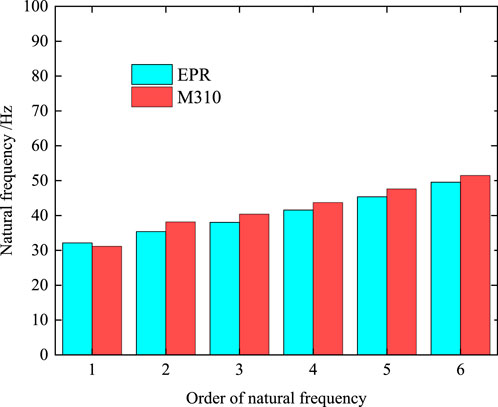
FIGURE 6. Natural frequency of fuel rods of EPR and M310.
The effective mass coefficient can be used to judge whether the order of modal truncation is reasonable. When the modal order is equal to 16 (X-Y and X-Z planes), the effective mass coefficient of the model of EPR is approximately 1. When the modal order is equal to 12 (X-Y and X-Z planes), the effective mass coefficient of the model of M310 is approximately 1. Based on this concept, the first 16-order vibration modes of EPR and the first 12-order vibration modes of M310 are listed in Figure 7.
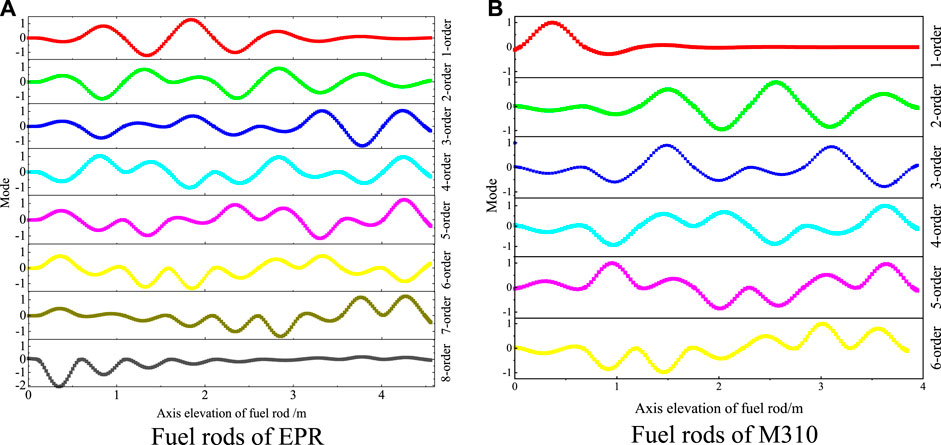
FIGURE 7. Vibration modes on X-Y plane. (A): EPR fuel rod vibration modes on X-Y plane. (B): M310 fuel rod vibration modes on X-Y plane.
For the slender structure of fuel rods, the low-order vibration modes are the most important for the analysis of vibration characteristics. From Figure 7, it can be found that the vibration modes of the fuel rods of M310 and EPR are quite different due to the differences in the number and distribution of their grids. Along the axis direction of fuel rods (from bottom to top), the maximum displacement of the 1-order vibration mode of the fuel rods of M310 occurs between the 1-st grid and the 2-nd grid because the span spacing between these two grids is longer than that between other grids. For the fuel rods of EPR, the distribution between grids is relatively uniform, so the vibration mode is different from that of M310.
Compared with the measured value of natural frequency of the fuel rods of EPR, the error of natural frequency and modes obtained by Beam4 and experimental results is within 3%, so the simulation results presented in this article can be thought to be consistent with the measured results. Therefore, the current numerical model can also be used for the subsequent response analysis of fuel rods.
In order to further consider the differences in the response of the fuel rods of M310 and EPR under operating conditions, the vibration response under the action of transverse and axial flow can be obtained by the theoretical equation introduced in Eqs 28 and 30. Then, it is necessary to introduce the calculation parameters for vibration response.
In order to obtain the vibration response caused by the transverse flow, the vibration modes obtained in Figure 7 are used to calculate the weighted velocity of the transverse flow. Under operating conditions, the transverse flow along the axial direction of fuel rods is not uniform. The simplified transverse flow velocity of M310 and EPR with the axial direction of fuel rods is shown in Figures 8 and 9.
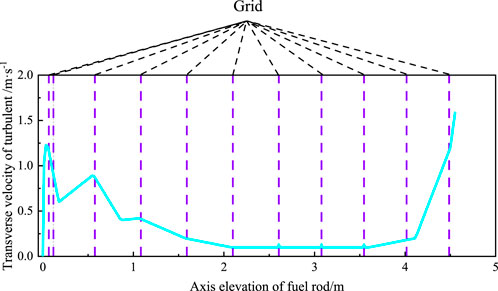
FIGURE 8. Transverse flow velocity of EPR.
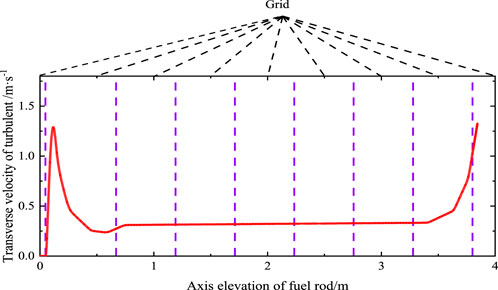
FIGURE 9. Transverse flow velocity of M310.
In order to calculate the vibration response caused by axial flow, it is necessary to obtain the distribution of axial flow velocity. Because the distribution of the axial rate of flow in PWR is approximate, the average flow velocity at the inlet of the reactor core is selected for calculation here. Under operating conditions, the inlet flow velocity of M310 and EPR is different. The average rate of flow at the inlet of the reactor core is shown in Table 5.
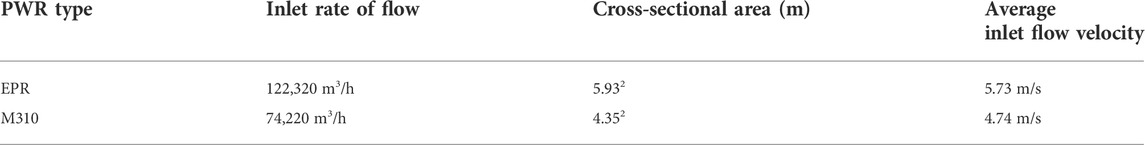
TABLE 5. Inlet rate of flow and velocity.
Since the structural parameters such as the diameter of fuel rods are almost the same as in M310 and EPR fuel assemblies, it can be considered that the C and Q values in Eqs 28 and 30 of axial and transverse flow are the same in the normalized PSD excitation spectrum of fuel rods, which are obtained from experiments.
Under turbulent excitation, the damping of fuel rods consists of two parts, namely, the hydrodynamic damping under the interaction between fluid and fuel rods and the inherent mechanical damping between fuel rods and the support structure. In this article, the damping ratio used is 4.4%.
When calculating the vibration response because the volume density of each section of fuel rods is different, the linear density of each section is also different, as shown in Table 6.
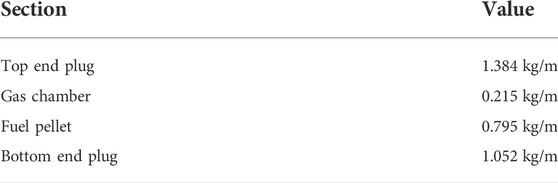
TABLE 6. Linear density of fuel rods.
The results of natural frequency and modes obtained above would directly affect the vibration response of fuel rods. Combing Eq. 28–30 to compile a program for the calculation of vibration response. Then, the total response of fuel rods of M310 and EPR can be obtained. Since the fuel rod is a symmetrical structure, the vibration response of the X-Y plane is similar to that of the X-Z plane. Therefore, the vibration response of any plane can be taken for analysis. Considering the vibration response on the X-Y plane as an example for analysis, as shown in Figure 10.
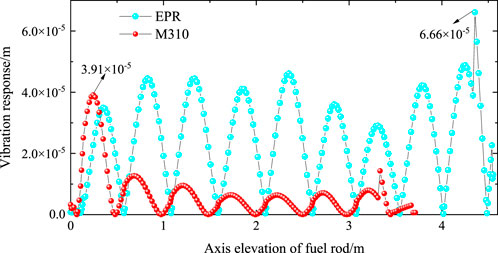
FIGURE 10. Vibration response of fuel rods.
It can be found that in Figure 10, along the axial direction of fuel rods, the vibration response of EPR is more uniform than that of M310. The maximum vibration response of M310 is located between the spans of the first two grids, and this value is much greater than the peak value of the other spans. However, the maximum vibration response of EPR is located between the last 10-th and 11-th grids.
It can also be noted that affected by the structure of fuel rods, the linear density of fuel rods would change suddenly along the axial direction, and the vibration response of fuel rods would change correspondingly at the nodes where the linear density changes suddenly. According to the comparison shown in Figure 10, the maximum vibration response of M310 is slightly smaller than that of EPR. It can also be judged that the vibration of EPR is more unstable than that of M310 under similar operating conditions.
Due to the influences of reactor internals of pressure vessels, the axial velocity of fuel rods at different positions is different (Barbier, et al., 2009). Although the flow direction of coolant is mainly axial, due to its structural characteristics, there is a large amount of irregular transverse turbulence in the fuel assembly (Mulcahy et al., 1980). The transverse flow velocity is also not uniformly distributed along the axial direction of the fuel rods. The numerical research of the vibration response characteristics of fuel rods of EPR under different axial and transverse flow velocities is carried out.
In order to study the distribution of flow field in the lower head of a pressure vessel for EPR, EDF conducted a scale model test, which is Juliette (Barbier et al., 2009). In this scale model experiment, it can be found that under normal operating conditions, the inlet flow velocity in the center of the core is large, while the flow velocity around it is small. The distribution of the flow field is shown in Figure 11 (Puragliesi et al., 2016).
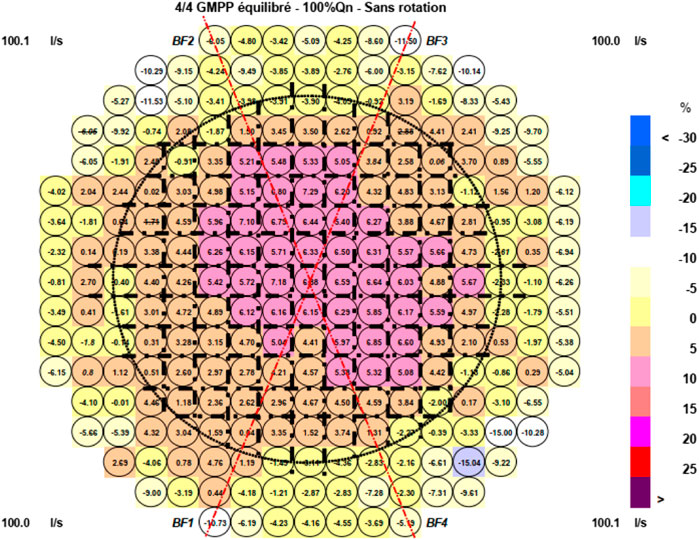
FIGURE 11. Distribution of inlet rate of flow of EPR core.
In Figure 11, the red line is the axis of the inlet nozzle of the coolant, and each small circle represents the fuel assembly. The number of small circles is the distribution coefficient of flow velocity. Taking 6.88 as an example, it represents that the inlet flow velocity of the fuel assembly is 6.88% greater than the average flow velocity.
In order to research the effect of different axial flow velocities on the vibration response of fuel rods under actual operating conditions, different inlet distribution coefficients of flow velocity were selected. The axial flow velocity of fuel rods is calculated, which is
where
According to Eq. 36, it can be obtained that the axial flow velocity is as shown in Table 7.

TABLE 7. Axial flow velocity.
The axial distribution of the transverse response of the fuel rod under different axial flow velocities is obtained. Similarly, taking the results on the X-Y plane as an example, as shown in Figure 12.
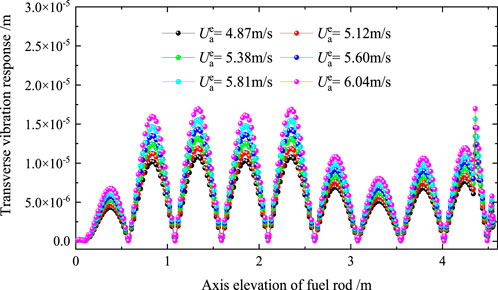
FIGURE 12. Transverse vibration response under different axial flow velocities.
By analyzing the results in Figure 12, it can be found that the axial vibration response of fuel rods would increase with the increase of axial velocity. This indicates that the axial flow velocity has a great influence on the axial vibration response, and the differences in the inlet flow velocity of the core need to be strictly controlled.
For the convenience of description, the definition of equivalent transverse velocity is introduced here, which is
where
Under actual operating working conditions, the transverse flow velocity would vary greatly with the axial direction of fuel rods. Transverse velocity is mainly reflected by the large flow velocity at both ends of fuel rods and the small flow velocity in the middle of fuel rods. In this article, the axial velocity of fuel rods is selected as 5.7 m/s, and the equivalent transverse velocity is selected as 0.1 m/s, 0.5 m/s, 0.9 m/s, 1.3 m/s, 1.7 m/s, and 2.1 m/s. Then, the vibration response of fuel rods under corresponding conditions is calculated.
By analyzing the results in Figures 12 and 13, it can be found that the transverse vibration response of fuel rods would increase with the increase of transverse velocity. By comparing Figure 12 and Figure 13, it can also be found that the transverse vibration response under the transverse flow velocity is larger than that of the axial flow velocity, so the influences of transverse flow velocity on transverse vibration response are greater.
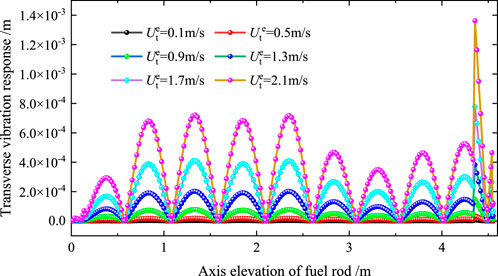
FIGURE 13. Transverse vibration under different transverse flow velocities.
During the design of fuel assembly, in addition to considering the material and structure of fuel rods, it is also necessary to properly confirm the clamping force of springs and dimples on the grid to the fuel rods. When the clamping force is too small, the fretting wear between fuel rods and the grid will be increased. When the clamping force is too large, the fuel rods will be deformed due to excessive constraints.
In this article, the clamping failure is considered as the failure of the support in the grid as shown in Figure 3, that is, all springs and dimples in one grid lose their elastic constraints on the fuel rods. Then, 12 failure working conditions are set for wet modal analysis and response analysis of EPR fuel rods. The corresponding 12 failure working conditions are shown in Table 8.
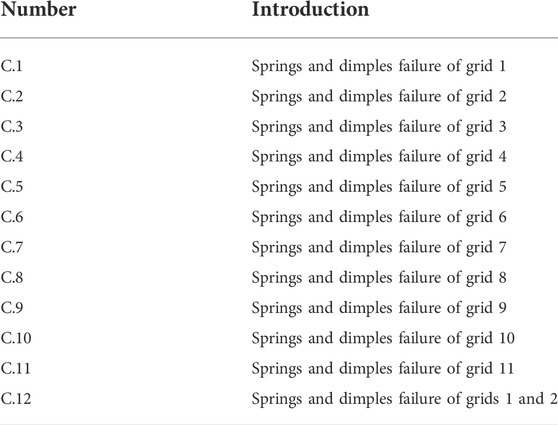
TABLE 8. Failure working conditions.
Under the abovementioned 12 failure working conditions, through the wet modal analysis of fuel rods, the influences of clamping failure on the mode are obtained. Taking the results of the X-Y plane as an example, as shown in Figure 14, where the dotted line represents the natural frequency of the fuel rods without clamping failure.
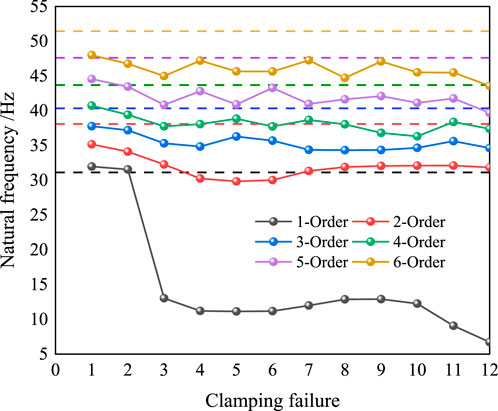
FIGURE 14. Natural frequency under clamping failure and no clamping failure.
It can be found from Figure 14 that the natural frequency of the fuel rods would decrease under the clamping failure. The order of natural frequency and the position of clamping failure are different, and the influences of clamping failure on natural frequency are also different.
The grid failure at different positions has different effects on the natural frequencies. For the 1-order frequency, the failure of the 3-rd to 11-th grids has a great impact on the frequency. However, due to the close distance between the 1-st and 2-nd grids, the failure of the 1-st and 2-nd grids, respectively, has little effect on the frequency, but the failure of the 1-st and 2-nd grids at the same time has a great effect on the frequency. By observing the vibration mode of EPR fuel rods, it can be found that the amplitude of the 1-order vibration mode is mainly distributed behind the 3-rd grids, so clamping failure at these locations has the greatest impact on the 1-order natural frequency.
The influences of clamping failure on the vibration mode are further analyzed. Similarly, taking the vibration mode of fuel rods on the X-Y plane as an example. The dotted lines in Figure 15 represent the position of grids. The 1-order vibration mode of fuel rods under different failure working conditions is shown in Figure 15. Then, the 1-order vibration mode under clamping failure is compared with those without clamping failure.
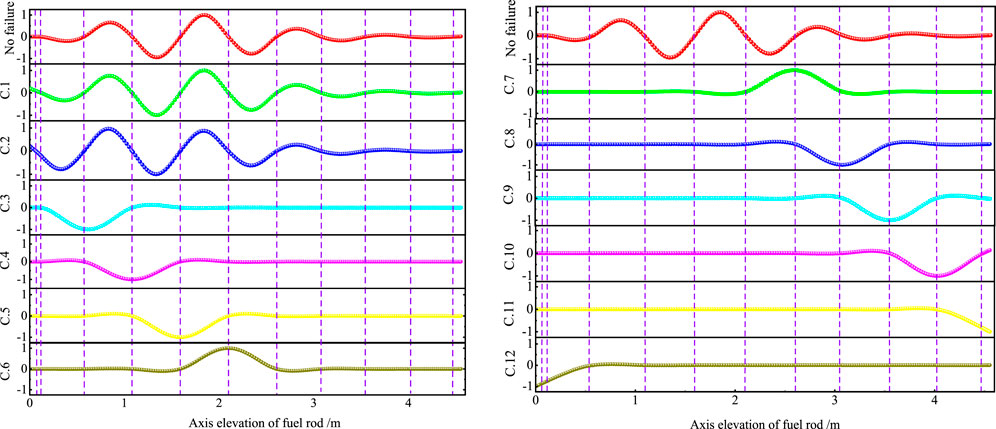
FIGURE 15. 1-order vibration mode under clamping failure.
It can be found from Figure 15 that, for the 1-order mode of fuel rods, the mode of failure of the 1-st and 2-nd grids is similar to the mode without grid failure. Except for the 1-st and 2-nd grids with close grid spacing, grid failure at other locations would cause the maximum amplitude to appear at the corresponding failure location. This is because the grid failure at these locations would make the spacing between adjacent grids longer, which would make the local stiffness decrease at these locations.
Finally, this article has calculated the maximum amplitude of fuel rods under different working conditions of clamping failure. Similarly, the maximum amplitude on the X-Y plane is shown in Figure 16. The dotted line in Figure 16B is the corresponding maximum amplitude when there is no clamping failure.
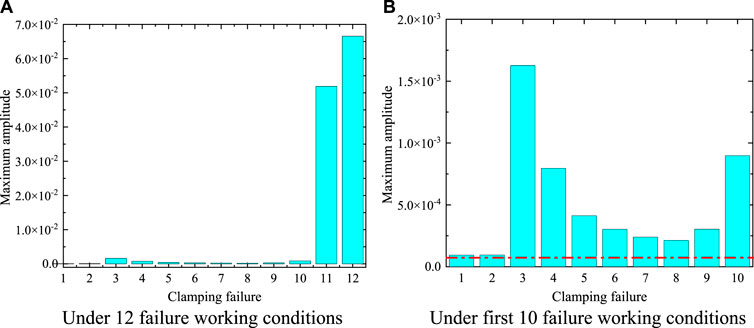
FIGURE 16. Maximum amplitude under clamping failure. (A): Maximum amplitude under 12 failure working conditions. (B): Maximum amplitude under first 10 failure working conditions.
From Figure 16A, it can be found that under the failure working conditions 11 and 12, the maximum amplitude of fuel rods is much greater than that under other failure conditions. From Figure 16B, it can be found that the failure of one of the grids has little effect on the maximum vibration response of the fuel rods due to the close distance between the 1-st and 2-nd grids. From the 3-rd grid, the clamping failure has a great impact on the maximum vibration response of fuel rods.
Considering the fuel rod of EPR as an object, the natural frequency and vibration mode of the fuel rod are discussed in detail by combining numerical and theoretical equations in this article. The amplitude under different turbulent flow velocities is calculated, and the influences of clamping failure on the vibration response of the fuel rod are discussed. The following conclusions can be listed:
1) By comparing the vibration characteristics of EPR and M310, it can be found that compared with the fuel rod of M310, the fuel rod of EPR has a lower natural frequency in general. Under turbulent excitation, the vibration response of fuel rods of EPR is larger than that of M310.
2) The transverse vibration response under the transverse flow velocity is larger than that of axial flow velocity, so the influence of transverse flow velocity on vibration response is greater. The maximum transverse amplitude of the fuel rods would change more dramatically with the transverse velocity than it would change with the axial velocity.
3) Grid failure would reduce the natural frequency and increase the amplitude of fuel rods, and the grid failure at different positions has different effects on the natural frequencies. For the 1-order frequency, the failure of the 3-rd to 11-th grids has a great impact on the frequency. However, due to the close distance between the 1-st and 2-nd grids, the failure of the 1-st and 2-nd grids, respectively, has little effect on the frequency, but the failure of the 1-st and 2-nd grids at the same time has a great effect on the frequency. In addition, the failure of the 11-th grid has the greatest impact on the amplitude, followed by the 3-rd grid.
4) Compared with M310, the fuel rods of EPR are longer, and the core inlet flow of EPR is larger, so the vibration response of EPR is larger. However, it is an effective measure to reduce the vibration response of the fuel rod of EPR by increasing the number of grids and the stiffness of springs and dimples.
The datasets presented in this study can be found in online repositories. The names of the repository/repositories and accession number(s) can be found below: https://data.mendeley.com/datasets/6ds6dtyywk/1.
NJ: designed the methodology, calculated some data, and revised the manuscript. GM: calculated some data, wrote the manuscript, and revised the manuscript. ZF: calculated some data. HQ: provided some parameters.
This study is financially supported by the National Natural Science Foundation of China (No. 11872060) and Special Project for Research and Development in Key Areas of Guangdong Province (No. 2021B0101250002).
The authors declare that the research was conducted in the absence of any commercial or financial relationships that could be construed as a potential conflict of interest.
All claims expressed in this article are solely those of the authors and do not necessarily represent those of their affiliated organizations, or those of the publisher, the editors, and the reviewers. Any product that may be evaluated in this article, or claim that may be made by its manufacturer, is not guaranteed or endorsed by the publisher.
Ansari, S. A., Haroon, M., Sheikh, Z., and Kazmi, Z. (2008). Detection of flow-induced vibration of reactor internals by neutron noise analysis. IEEE Trans. Nucl. Sci. 55 (3), 1670–1677. doi:10.1109/TNS.2008.921490
Barbier, A., Cartier, O., Dolleans, P., Muller, T., Bellet, S., Fontes, J.-P., et al. (2009). “Experimental characterization of hydraulics in the EPRTM lower plenum: Test performed on the JULIETTE mock-up,” in Proceedings of the 13th international topical Meeting on nuclear reactor thermal hydraulics (NURETH-13) (Kanazawa, Japan). September 27-October 2.
Blevins, R. D. (1979). Flow-induced vibration in nuclear reactors: A review. Prog. Nucl. Energy 4 (1), 25–49. doi:10.1016/0149-1970(79)90008-8
Chen, S. S., and Wambsganss, M. W. (1972). Parallel-flow-induced vibration of fuel rods. Nucl. Eng. Des. 18 (2), 253–278. doi:10.1016/0029-5493(72)90144-6
Choi, Y., Park, J. B., Lee, S. J., Park, N. C., Park, Y. P., Kim, J. S., et al. (2016). Model reduction methods for cylindrical structures in reactor internals considering the fluid-structure interaction. J. Nucl. Sci. Technol. 53 (2), 204–222. doi:10.1080/00223131.2015.1035352
de Santis, D., and Shams, A. (2017). Numerical modeling of flow induced vibration of nuclear fuel rods. Nucl. Eng. Des. 320, 44–56. doi:10.1016/j.nucengdes.2017.05.013
Dutkiewicz, O., Marcinkiewicz, K. M., Madokoro, H., Shumski, S., Allison, C. M., and Hohorst, J. K. (2017). RELAP/SCDAPSIM/MOD3.5 analysis of KIT's QUENCH-14 experiment. EPJ Nucl. Sci. Technol. 3, 25. doi:10.1051/epjn/2017019
Ferrari, G., Franchini, G., Balasubramanian, P., Giovanniello, F., Le Guisquet, S., Karazis, K., et al. (2020). Nonlinear vibrations of a nuclear fuel rod supported by spacer grids. Nucl. Eng. Des. 361 (2020), 110503. doi:10.1016/j.nucengdes.2019.110503
Gorman, D. J. (1971). An analytical and experimental investigation of the vibration of cylindrical reactor fuel elements in two-phase parallel flow. Nucl. Sci. Eng. 44 (3), 277–290. doi:10.13182/NSE71-A20161
Gu, Z., Liu, C., and Fu, M. (2006). Strategic considerations on development of nuclear power and the associated fuel cycle in China. J. Nucl. Sci. Technol. 43 (9), 963–966. doi:10.1080/18811248.2006.9711183
Hassan, M. A., Weaver, D. S., and Dokainish, M. A. (2002). A simulation of the turbulence response of heat exchanger tubes in lattice-bar supports. J. Fluids Struct. 16 (8), 1145–1176. doi:10.1006/jfls.2002.0468
Ho, M. K., Hong, G., and Mack, A. N. (2004). “Experimental investigation of flow-induced vibration in a parallel plate reactor fuel-assembly,” in Australasian fluid mechanics conference (Sydney, NSW 2006, Australia: The University of Sydney).
Jiang, N. B., Feng, Z. P., and Zang, F. G. (2018). Theory and application of flow-induced vibration in nuclear engineering. Shang Hai: SHANGHAI JIAO TONG University Press.
Jiang, N. B., Xiong, F. R., Zang, F. G., Zhang, Y. X., and Qi, H. H. (2017). Analysis on vibration response of U-tube bundles caused by two-phase cross-flow turbulence. Ann. Nucl. Energy 99, 328–334. doi:10.1016/j.anucene.2016.09.017
Kaneko, S., Nakamura, T., Inada, F., Kato, M., Ishihara, K., Nishihara, T., et al. (2014). Flow-induced vibrations: Classifications and lessons from practical experiences. Academic Press.
Kim, K. T. (2010). The effect of fuel rod supporting conditions on fuel rod vibration characteristics and grid-to-rod fretting wear. Nucl. Eng. Des. 240 (6), 1386–1391. doi:10.1016/j.nucengdes.2009.12.030
Liu, H., Chen, D., Hu, L., Yuan, D., and Gao, H. (2017). Numerical investigations on flow-induced vibration of fuel rods with spacer grids subjected to turbulent flow. Nucl. Eng. Des. 325, 68–77. doi:10.1016/j.nucengdes.2017.10.004
Mulcahy, T. M., Yeh, T. T., and Miskevics, A. J. (1980). Turbulence and rod vibrations in an annular region with upstream disturbances. J. Sound Vib. 69 (1), 59–69. doi:10.1016/0022-460X(80)90435-6
Paidoussis, M. P. (1981). Fluidelastic vibration of cylinder arrays in axial and cross flow: State of the art. J. Sound Vib. 76 (3), 329–360. doi:10.1016/0022-460X(81)90516-2
Pázsit, I., and Analytis, G. T. (1980). Theoretical investigation of the neutron noise diagnostics of two-dimensional control rod vibrations in a PWR. Ann. Nucl. Energy 7 (3), 171–183. doi:10.1016/0306-4549(80)90082-1
Peng, G., and Li, D. (2008). Design for fuel management of China integrated advanced NPP reactor core. Nucl. Power Eng. 29 (2), 39–42. doi:10.1088/0256-307X/25/2/069
Planchard, J. (1985). Vibrations of nuclear fuel assemblies: A simplified model. Nucl. Eng. Des. 86 (3), 383–391. doi:10.1016/0029-5493(85)90303-6
Puragliesi, R., Zhou, L., Zerkak, O., and Pautz, A. (2016). Steady-state CFD simulations of an EPR™ reactor pressure vessel: A validation study based on the juliette experiments. Nucl. Eng. Des. 300, 41–56. doi:10.1016/j.nucengdes.2015.12.025
Reavis, J. R. (1969). Vibration correlation for maximum fuel-element displacement in parallel turbulent flow. Nucl. Sci. Eng. 38 (1), 63–69. doi:10.13182/NSE69-A19354
Rubiolo, P. R. (2006). Probabilistic prediction of fretting-wear damage of nuclear fuel rods. Nucl. Eng. Des. 236 (14-16), 1628–1640. doi:10.1016/j.nucengdes.2006.04.023
Viebach, M., Bernt, N., Lange, C., Hennig, D., and Hurtado, A. (2018). On the influence of dynamical fuel assembly deflections on the neutron noise level. Prog. Nucl. Energy 104, 32–46. doi:10.1016/j.pnucene.2017.08.010
Wang, L., and Ni, Q. (2009). Vibration of slender structures subjected to axial flow or axially towed in quiescent fluid. Adv. Acoust. Vib. 2009, 1–19. doi:10.1155/2009/432340
Xiao, M., Zhang, H., Ma, C., Bai, C., Zhou, Z., Wang, L., et al. (2015). Practice and prospect of advanced fuel management and fuel technology application in PWR in China. J. Nucl. Sci. Technol. 52 (10), 1226–1231. doi:10.1080/00223131.2015.1029557
Keywords: fuel rod of EPR, vibration response, modal analysis, clamping failure, flow velocity
Citation: Jiang N, Min G, Fang Z and Qi H (2022) Investigation on vibration response characteristics and influencing factors of the fuel rods of EPR. Front. Energy Res. 10:990525. doi: 10.3389/fenrg.2022.990525
Received: 10 July 2022; Accepted: 19 August 2022;
Published: 15 September 2022.
Edited by:
Qingming He, Xi’an Jiaotong University, ChinaReviewed by:
Jingang Liang, Tsinghua University, ChinaCopyright © 2022 Jiang, Min, Fang and Qi. This is an open-access article distributed under the terms of the Creative Commons Attribution License (CC BY). The use, distribution or reproduction in other forums is permitted, provided the original author(s) and the copyright owner(s) are credited and that the original publication in this journal is cited, in accordance with accepted academic practice. No use, distribution or reproduction is permitted which does not comply with these terms.
*Correspondence: Huanhuan Qi, cWlodWFuNzNAMTI2LmNvbQ==; Zhengyan Fang, Zl9sYXBpbjk5QHFxLmNvbQ==
Disclaimer: All claims expressed in this article are solely those of the authors and do not necessarily represent those of their affiliated organizations, or those of the publisher, the editors and the reviewers. Any product that may be evaluated in this article or claim that may be made by its manufacturer is not guaranteed or endorsed by the publisher.
Research integrity at Frontiers
Learn more about the work of our research integrity team to safeguard the quality of each article we publish.