 Yiping Zhang
 Feng Qi1
- 1State Grid Heilongjiang Electric Power Co, Ltd, Haerbin, China
- 2Department of Electrical Engineering, Northeast Electric Power University, Jilin, China
The inertia level is a significant indicator that guides operators to integrate renewable power generation into the power system for safe operation. In this study, a method that can estimate the effective inertia of power grids located in different regions in the interconnected system is proposed by using the synchronous measurement data. Based on the equivalent swing equation formed as a second-order oscillator, the inertia is expressed as a ratio of the time-evolution solution of this equation. To avoid a meaningless ratio, the Hilbert transformation is leveraged to recast the inertia analytical expression, which is composed of the time-independent characteristic parameters of the oscillation signal. Furthermore, the signal identification technique is employed to extract the characteristic parameters from the synchronized measurements so that the proposed scheme can estimate the regional inertia by using only the outputs measured by the synchorphasor measurement units. A comparison of the simulation results and methods validate the effectiveness and robustness of the proposed method.
1 Introduction
The increasing integration of converter-control-based renewable power generation into power systems makes the system inertia a focus of widespread concern due to the small amount of inertia they provide (Yang et al., 2022a; He et al., 2021; Lyu et al., 2022). In addition to the perspective of the whole system, regional inertia has also attracted attention because of the spatial distribution characteristics of the integration of renewable power generation into the system (Pulgar-Painemal et al., 2018; Yang et al., 2022b). The significance of regional inertia is that the island power grid formed by the disconnection of tie lines in the interconnected power system can withstand a sudden interruption of the transmission power to prevent the frequency collapse of the island. Similar to the blackout accruing in South Australia in 2016 (Yan et al., 2018), insufficient regional inertia has no ability to prevent the frequency collapse caused by the disconnection of the tie lies. Nevertheless, this blackout may be foreseen and prevented once the transmission system operator (TSO) can obtain the distance between the minimum requirement inertia and operation inertia of the regional power grids. The former can be determined by the frequency stability constraint of a system (Golpira et al., 2016), while the latter can be obtained by inertia estimation. To summarize, estimating regional inertia can not only assist the TSO in seeking out the low inertia region but also provide guidance for the TSO to integrate renewable power generation into the system from the local perspective.
Access to obtaining regional inertia based on a synchronous measurement can be divided into two categories: online calculation and online estimation. In online calculations, the component inertia is taken as the basic unit to be estimated (Sun et al., 2019), whereas the regional inertia can be obtained by calculating the sum of inertia units in the regional power grids (Arjona et al., 2012; Hajnoroozi et al., 2015; Huang et al., 2018). However, a reduction in the efficiency of online calculations has gradually become prominent with the increasing scale and complexity of power systems.
To adapt to the large-scale interconnected power system, online inertia estimation for regional grid is developed. The regional inertia can be estimated by minimizing the difference between the PMU measured signal and the simulated signal based on the equivalent dynamic model (Sarić et al., 2019; Vahidnia et al., 2013; Chavan et al., 2017). However, the estimation methods based on optimization is model-dependent. Instead of optimization, online estimation based on the analytical expression of the inertia have been developed (Ashton et al., 2017; Wilson et al., 2019; Tuttelberg et al., 2018; Panda et al., 2020). In (Ashton et al., 2017), the regional power grid is aggregated as an equivalent generator so that the regional inertia can be estimated by the ratio of the sudden step power and the rate of change of frequency (RoCoF) at the disturbance moment. Although the accuracy of the RoCoF-based method can be improved by integration calculation (Wilson et al., 2019), the controller response and system damping can also affect the estimation results. In (Tuttelberg et al., 2018), the regional inertia is expressed as a unit impulse response of an equivalent swing equation formed as a first-order transfer function at time zero. The regional inertia estimation based on the step response and impulse response of an equivalent swing equation needs to measure the frequency response trajectory at the moment of disturbance. Recently, the relationship between the inertia and electromechanical oscillation behaviour has been utilized to estimate the equivalent inertia. In (Panda et al., 2020), the inertia of an equivalent generator at the connected bus is expressed based on the maximum point information during oscillation. However, the time corresponding to the extreme point needs to be exactly determined. Overall, these estimation methods highly depend on the measurement of the single point value at the disturbance moment or extreme point, so the robustness to distorted data caused by measurement noise or missing data is poor. Moreover, the estimation accuracy can also disturb by the calculation of RoCoF.
The purpose of this study is to develop a method to estimate the regional inertia of an interconnected power system using wide-area measurements, which has a lower sensitivity to the single point value. An inertia expression based on the swing equation is first developed. Then, an online regional inertia estimation scheme for the interconnected power system is established. Specifically, the contributions of this study are as follows:
1) An inertia explicit expression is developed by using the Hilbert transformation on the time-domain solution of the swing equation formed as a second-order oscillator. The developed inertia expression consists of the characteristic parameters of the oscillation signal with no relation to time, exhibiting prominent differences from the inertia expressions in (Ashton et al., 2017; Wilson et al., 2019; Tuttelberg et al., 2018; Panda et al., 2020).
2) The online estimation scheme for the regional inertia of an interconnected power system is established based on the combination of the developed inertia expression and the adaptive identification algorithm that has been applied in the power system. Unlike the estimation method mentioned above, whose estimation results have a strong sensitivity to single point measurement, the proposed estimation scheme strengthens the robustness of the estimation to noise interference by utilizing the overall information carried by the PMU-measured data.
3) A comparative analysis between the proposed method and commonly used RoCoF-based method is carried out with a large-scale interconnected power system in the simulation circumstance.
The remainder of the paper is structured as follows: Section 2 discusses the power system dynamic response based on the swing equation. In Section 3 the inertia analytical expression is derived. The online estimation scheme for regional inertia is presented in Section 4. Section 5 demonstrates the effectiveness and robustness of the proposed method through simulation data. Section 6 presents the conclusions drawn and discusses future studies.
2 Theoretical basis
The electromechanical dynamic behaviour of a synchronous subsystem in a bulk power system can be equivalent to an aggregated synchronous generator (ASG) (Panda et al., 2020), whose dynamic is modelled as a second-order oscillator, expressed as
where
where
If all variables in (Eq. 2) are in p. u, then the relationships
Based on (Eq. 3), it is reasonable to directly express the inertia by the ratio of
3 Inertia quantification based on the hilbert transformation
As seen from the comparison of (A.3) and (A.4), the difference between
3.1 Hilbert transformation
The time-domain response trajectory of a dynamic system contains complex transient information. The Hilbert transform is an advanced technique to analyse dynamic information during the transient period (Michael, 1994). The Hilbert transformation for the time-domain signal
where
Then, the analytical expression of
where
The Hilbert transformation can convert a real signal in the one-dimensional axis into a complex signal in the two-dimensional plane by representing the amplitude and phase of the real signal as the module and angle of the complex signal, respectively.
3.2 Analytic expression of inertia
The advantage of the instantaneous information extraction of the Hilbert transformation provides the basis for the separation of the phase information. Since the Hilbert transformation is linear, performing it on (Eq. 3) leads to
Multiplying each term in the Hilbert transformed equation by the unit imaginary j and adding each term in the imaginary equation to each term in (Eq. 6), an analytical expression of (Eq. 3) is obtained; i.e.,
where
Since the inertia is the positive real number, its norm is itself. The analytical term is complex; thus, its norm is equal to the instantaneous amplitude of the analytical signal. Consequently, the phase information can be eliminated by norm calculation on both sides of (Eq. 7).
According to the relationship between the instantaneous amplitude of
Since the instantaneous amplitudes of
In (Eq. 10), the initial amplitude of the oscillation power
4 Scheme for regional inertia estimation
The derived inertia analytical expression provides an important basis for the online inertia estimation. It is feasible to estimate the inertia by extracting these characteristic parameters from the observed electromechanical oscillation response. However, practical applications of the regional inertia estimation for the interconnected power system based on (Eq. 10) need further illustration, namely, the equivalent of the multi-region interconnected system and the extraction of oscillation characteristic parameters.
4.1 Equivalence of a multi-region interconnected power system
The generation of the interconnected power system is motivated by insufficient or excessive generation power in the regional grid. Consequently, the partition of the system consisting of multiple interconnected regional power grids can be achieved by finding the boundary buses of each regional grid, which is geographical in nature. A significant sign of the partition an interconnected system is the tie-line connecting regional power grids. In such partitions, each regional grid can be referred to as an ASG whose electromechanical dynamic behaviour is described by (Eq. 2) (Chavan et al., 2017), while the interconnected structure is preserved. Then, the dynamic behaviour of the interconnected power system can be represented by the multiple ASGs model, expressed as
where
where
It can be seen that (Eq. 11) is the high-order extension of (Eq. 2). Although this extension cannot change the EDSO form that the speed and electric power signals follow, it will make the time-domain response of the speed and power complicated; that is, the speed and power signal contain multiple components with different oscillation frequencies due to increased order. The complicated oscillation creates a barrier to directly calculating the regional inertia by using the proposed inertia quantification methodology because (10) is derived based on the speed and power at a single oscillation frequency. Thus, the decomposition of the signal consisting of the components with different oscillation frequencies should be further considered.
4.2 Extraction of the oscillation characteristic parameter
Considering the above situation, the extraction of the oscillation characteristic parameters contains two phases: decomposition and identification (Yang et al., 2017). Signal processing technology based on intrinsic mode function (IMF) sifting provides an effective way to decompose nonlinear, non-stationary, multi-component coupling signals. An IMF satisfies two conditions: 1) the number of local extreme points and zero-crossing points must be equal or differ by at most one in the whole-time window, and 2) the average of the upper envelope and lower envelope is equal to zero at any time. After IMF sifting, the original signal can be expressed as
where
According to the IMF sifting conditions, the IMF in the EDSO signal with multiple components corresponds to the component with a single oscillation frequency. Fortunately, many methods can be used to extract the IMFs of the multi-component EDSO signal, such as the Prony method, the empirical mode decomposition algorithm, and adaptive local iterative filter decomposition (ALIFD). Among them, ALIFD is utilized here due to its better performance than others and robustness to the strong nonstationary behaviour of the dynamic system.
After decomposition, the component with a single oscillation frequency is obtained. The amplitude, decay coefficient, and oscillation frequency of each decomposed signal can then be identified by linear fitting, which can be achieved by least squares fitting (LSF).
4.3 Procedure for the online regional inertia estimation
According to the above analysis, the speed and electric power response of each ASG need to be obtained first. In the p. u, the speed of the ASG can be approximately represented by the average frequency of the regional power grid corresponding to the ASG, which can be obtained by the weighted average of the bus frequency captured by the PMU in the region (Tuttelberg et al., 2018). The electrical power of the ASG can be obtained by the sum of the measured transmission power in the tie lines. By integrating the bus frequency and the transmission power captured by the PMU, the data set for the regional inertia estimation is generated.
As shown in Figure 1, the proposed online inertia estimation method for the interconnected power system consists of five steps, where the step 1 and step 2 are to prepare the input data, step 3 and step 4 are to extract the oscillation parameters, and the inertia of each region is finally estimated by step 5. Specifically, the estimation procedure is as follows:
Step 1: Capture the time-domain response of the bus frequency deviation in each regional grid and tie-line power deviation during the electromechanical oscillation process by using synchrophasor measurements.
Step 2: Integrate the PMU-measured response into the speed and electrical power signal of the ASG corresponding to each regional grid.
Step 3: Decompose the integrated speed and electric power signals with multiple intrinsic modes coupled into the signals with a single oscillation mode by using the ALIFD algorithm.
Step 4: Identify the oscillation characteristic parameters of each ALIFD decomposed signal by linear fitting.
Step 5: Estimate the inertia based on (Eq. 10), where the oscillation characteristic parameters have been determined by step 4.
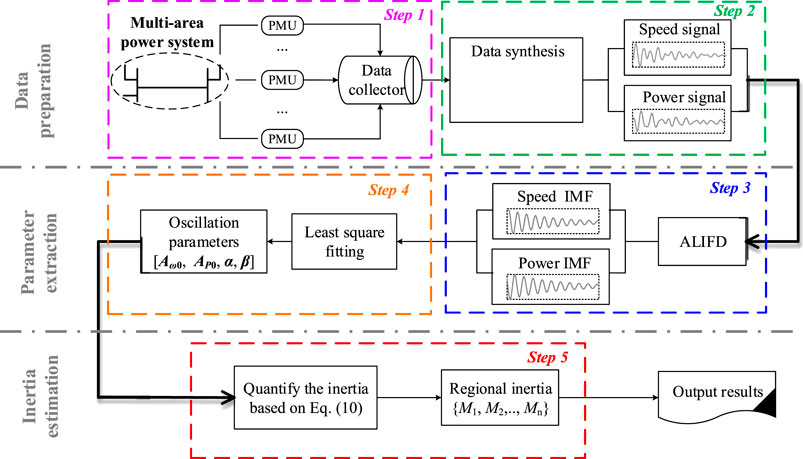
FIGURE 1. Flowchart for the data-driven regional inertia estimation.
5 Numerical simulation
This section tests the performance of the proposed method based on the IEEE standard system, i.e., the 5-region, 16-machine, 68-bus power system (Canizares et al., 2017). The topology of the system is shown in Figure 2. According to the interconnected structure, the test system is geographically divided into five regional power grids, i.e., the New England power grid (Region I), the New York power grid (Region II), and the remaining three equivalent power grids (Region III, Region IV, and Region V). Region I and Region II include generator G1–G9 and generator G10–G13, respectively. Region III, Region IV, and Region V are represented by three equivalent generators G14, G15, and G16, respectively.
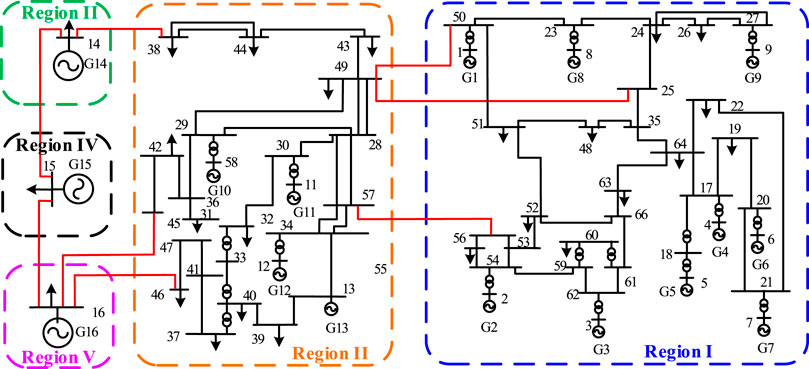
FIGURE 2. Diagram of the IEEE five-region power system.
The test system is established on the DIGSILENT numerical simulation software. The base power, rate frequency, and simulation step are set as 1000 MW, 60 Hz, and 0.01 s, respectively. Moreover, Gaussian noise is added to the simulated signals to imitate the measurement noise.
The proposed regional inertia online estimation method takes the measured signal as input. However, according to the theory in Section 2, the estimation is based on the extraction of oscillation characteristic parameters from the measured signal. Thus, the exact electromechanical oscillation parameters should be extracted before quantifying the inertia by (Eq. 10).
5.1 Oscillation parameter extraction
To stimulate the electromechanical response of the system, a single-phase ground fault with a duration of 0.05 s is carried out at the 31 Bus. Then, the ASG speed and power signals corresponding to the regional grid are generated by the bus frequency and tie-line power, respectively, which exhibit decaying oscillations, as shown in Figure 3.
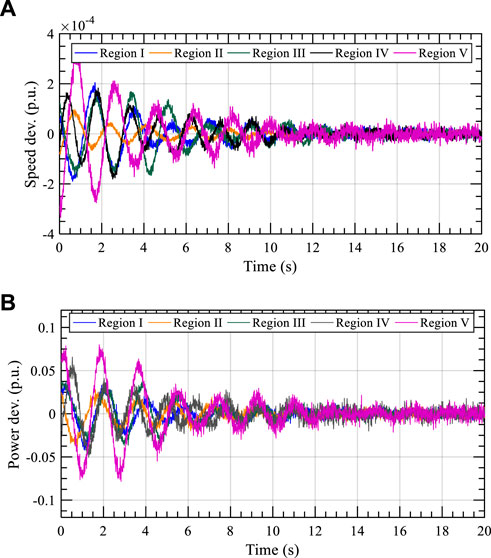
FIGURE 3. Simulated signal: (A) speed deviation signal of ASG I to ASG V and (B) power deviation signal of ASG I to ASG V.
Meanwhile, a spectrum analysis based on a Fourier transform is performed on the filtered speed and power signals to reveal the oscillating components. Figure 4A shows that the ASG speed signal contains three inherent components with a determined frequency. Figure 4B shows that the WFT spectrum of the ASG power signal also contains three inherent components whose oscillation frequencies are the same as the inherent components in the ASG power signals.
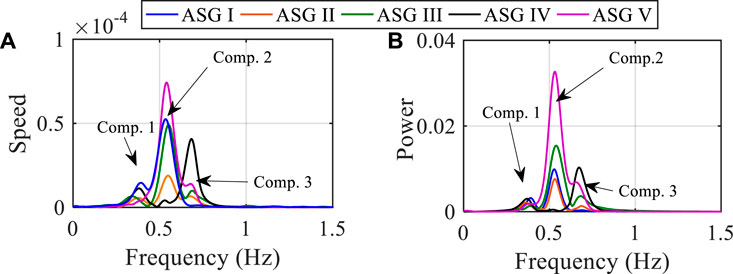
FIGURE 4. Spectrum analysis for the (A) speed signals and (B) power signals.
To extract the oscillation parameters of the inherent oscillation components in the speed and power signal, the ALIFD algorithm is performed. The speed and power signal of each ASG is decomposed by the ALIFD algorithm, generating three components with a single oscillation frequency for each signal. Then, the oscillation parameters of decomposed components are identified by LSF. The identified oscillation parameters are shown in Table 1 to Table 3 where Table 1, Table 2 and Table 3 correspond to the oscillation parameters of inherent component 1, inherent component 2, and inherent component 3, respectively, in the power and speed signals. It can be observed that the same inherent components of the different signals have the same oscillation frequency and decay coefficient, while the initial amplitudes are different.
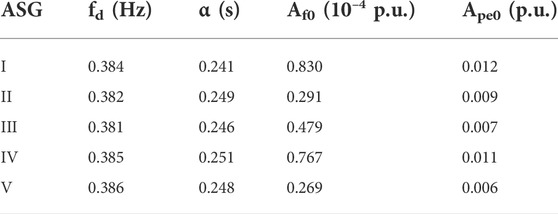
TABLE 1. Oscillation characteristic parameters of comp. One.
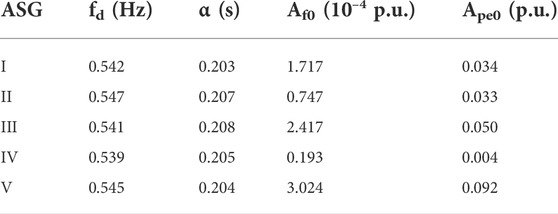
TABLE 2. Oscillation characteristic parameters of comp. Two.

TABLE 3. Oscillation characteristic parameters of comp. Three.
Based on the identified oscillation parameters, the speed and power signals are reconstructed, as shown in Figure 3. As can be seen from the figure, the reconstructed signals also show the decaying trend and have almost the same oscillation process as the original signals, indicating that the parameters extracted by ALIFD-LSF can quantitively represent the oscillation characteristic.
5.2 Regional inertia estimation
After the oscillation characteristic parameters are extracted, the regional inertia can be obtained by using (Eq. 10). This subsection aims to verify the correctness of the proposed inertia analytical expression by comparing the estimated inertia and nominal inertia calculated directly from the system data (Kundur, 1994), where the nominal inertia is shown in Table 4.
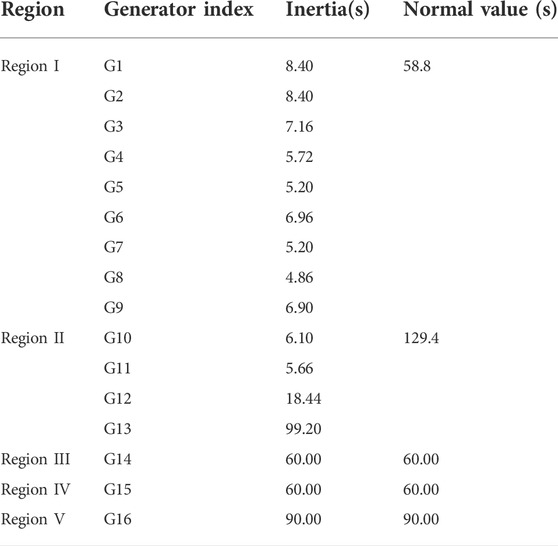
TABLE 4. Inertia Configuration of the test system based on 1000 MVA.
To quantify the accuracy of the estimation results, the relative error between the inertia obtained by the estimation method and the calculated inertia at the same base power is employed and is expressed as
where
According to the extracted oscillation characteristic parameters, three sets of estimation results can be obtained. We first estimate the regional inertia by using the oscillation characteristic parameters in Table 1, which correspond to inherent component 1. The estimated inertia for the five regional power grids in the test system based on inherent component 1 is shown in Figure 5 and Table 5. It can be seen by comparing the estimated inertia marked as a pink square and the real inertia marked as the red points in Figure 5 that the estimated results have a slight deviation from the real inertia. Table 5 shows that the numerical deviation between the estimated inertia and real inertia of Region I to Region V is {-0.8 s, 1.15 s, -0.7 s, 1.01 s, and -1.42 s, respectively}.
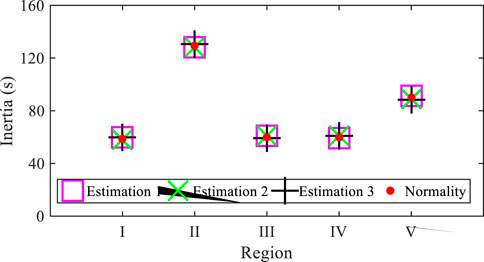
FIGURE 5. Comparison of the estimation results based on the oscillation parameters of the different components.
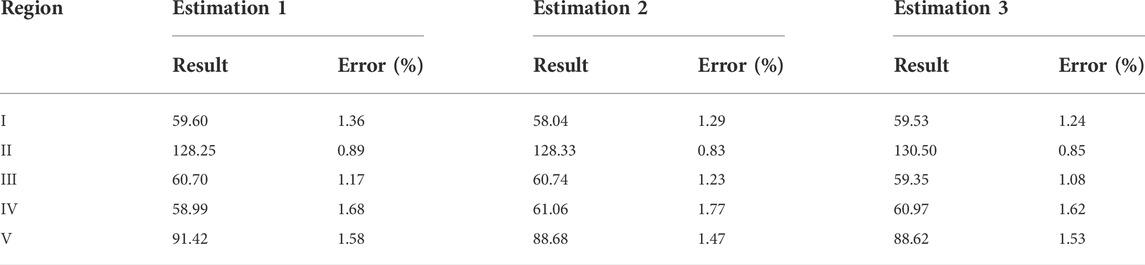
TABLE 5. Estimation results and error based on the oscillation parameter of the different components.
The estimated inertia based on inherent component 2 and inherent component 3, i.e., oscillation characteristic parameters in Table 2 and Table 3 are subsequently obtained, which are also presented in Figure 5. The estimation results based on the parameters in Table 3 and Table 4 are marked as the green cross and black cross, respectively. Apparently, both of them also have a small deviation from the real inertia. As seen from Table 5, the numerical deviation between the estimation and reality of Region I to Region V based on the parameters of component 2 and component 3 are {0.76 s, 1.07 s, -0.74 s, -1.06, and 1.32 s} and {-0.73 s, -1.10 s, 0.65 s, -0.97 s, and 1.38 s}, respectively.
Furthermore, the estimation error is calculated based on the estimation results to indicate the accuracy of the proposed method. As shown in Table 5, the relative errors for the estimation results based on these three inherent components are all small, indicating the accuracy of the proposed method. Moreover, an apparent situation can be seen from Figure 5; that is, the estimation results are almost coincident, which means that the estimated inertias based on the oscillation characteristic parameters of the different inherent components have no significant impact on the estimation results. Moreover, such a situation can also be seen by comparing the estimation error based on the different inherent components in Table 5. This feature means that there is no need to extract the oscillation characteristic parameters of all inherent components hiding in the ASG speed and power signal, which makes the proposed method adaptable to large-scale interconnected power systems.
5.3 Comparison with the RoCoF-based method
To demonstrate the outperformance of the proposed method, the RoCoF-based inertia estimation method, which is based on the frequency events caused by sudden power mismatch between generation and consumption, is carried out with the test system. The frequency response trajectory of each regional power grid caused by a sudden 0.228 p. u. load increase at 1 s is shown in Figure 6A. The mismatched power of each regional power grid can be calculated through the deviation of the generation power after disturbance, from Region I to Region V being 0.038 p. u, 0.072 p. u, 0.034 p. u, 0.034 p. u, and 0.05 p. u, respectively.
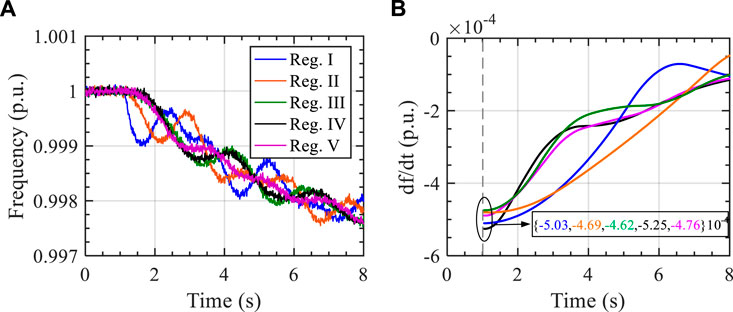
FIGURE 6. Time-domain trajectories caused by a sudden load increase: (A) frequency signals and (B) RoCoF signals.
A lowpass Butterworth filter with a corner frequency of 0.5 Hz is utilized to filter out the slow network modes in the frequency response trajectories, Then, the RoCoF of each regional power grid can be calculated, as shown in Figure 6B. Based on the RoCoF and mismatched power, the inertia can be estimated by the method proposed in (Ashton et al., 2017). The estimation results are shown in Table 6, which is close to the real value. However, the numerical deviation between the estimation and reality of Region I to Region V based on the RoCoF is {-16.74 s, -24.12 s, -13.59 s, - 4.76 s, and -15.04 s}, respectively, which is larger than that of the proposed method. Additionally, it can be seen by comparing the ER of different methods that the inertia based on the proposed method is more accurate than that of the RoCoF-based method.
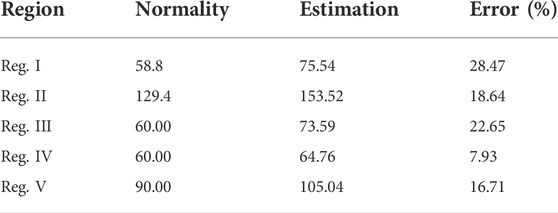
TABLE 6. Estimation results of the RoCoF-Based method.
Theoretically, the inertia expression based on frequency events is described as
6 Conclusion
This paper presented a synchrophasor data-driven method to estimate the regional inertia for an interconnected power system. The estimation scheme is based on the relationship between the regional inertia and the characteristic parameters of the electromechanical oscillation signal, which is developed by the Hilbert transformation of the equivalent swing equation. Since the developed inertia expression is time-independent, the proposed method can accommodate the measurement data under noise conditions. Additionally, there is no need to determine the disturbance time, and the measured data is directly used rather than further derivative calculation, thereby improving accuracy.
The performance of the proposed method is demonstrated on the simulated data of the five-region power system and then compared with the RoCoF-based method. The simulation results showed the outperformance of the proposed method. The proposed method expands the application of the signal identification technique in power systems. To further explore this issue, our future work will include the application of random signal processing technology to realize the real-time estimation of the regional inertia.
Data availability statement
The raw data supporting the conclusions of this article will be made available by the authors, without undue reservation.
Author contributions
YZ and FQ contributed to the conception and design of the proposed strategy. All authors wrote and edited the manuscript.
Funding
This article is supported by the State Grid Corporation of China Science and Technology Project (SGHL0000DKJS2101550).
Conflict of interest
Authors YZ, FQ, YH were employed by the company State Grid Heilongjiang Electric Power Co, Ltd.
The remaining authors declare that the research was conducted in the absence of any commercial or financial relationships that could be construed as a potential conflict of interest.
Publisher’s note
All claims expressed in this article are solely those of the authors and do not necessarily represent those of their affiliated organizations, or those of the publisher, the editors and the reviewers. Any product that may be evaluated in this article, or claim that may be made by its manufacturer, is not guaranteed or endorsed by the publisher.
References
Arjona, M. A., Hernandez, C., Cisneros-Gonzalez, M., and Escarela-Perez, R. (2012). Estimation of synchronous generator parameters using the standstill step-voltage test and a hybrid genetic algorithm. Int. J. Electr. Power & Energy Syst. 35 (1), 105–111. doi:10.1016/j.ijepes.2011.10.003
Ashton, P. M., Saunders, C. S., Taylor, G., Carter, A., and Bradley, M. E. (2017). Inertia estimation of the GB power system using synchrophasor measurements. IEEE Trans. Power Syst. 30 (2), 701–709. doi:10.1109/tpwrs.2014.2333776
Canizares, C., Fernandes, T., Geraldi, E., Gerin-Lajoie, L., Gibbard, M., Hiskens, I., et al. (2017). Benchmark models for the analysis and control of small-signal oscillatory dynamics in power systems. IEEE Trans. Power Syst. 32 (1), 715–722. doi:10.1109/tpwrs.2016.2561263
Chavan, G., Weiss, M., Chakrabortty, A., Bhattacharya, S., Salazar, A., and Ashrafi, F. (2017). Identification and predictive analysis of a multi-area WECC power system model using synchrophasors. IEEE Trans. Smart Grid 8 (4), 1977–1986. doi:10.1109/tsg.2016.2531637
Golpira, H., Seifi, H., Messina, A. R., and Haghifam, M. R. (2016). Maximum penetration level of micro-grids in large-scale power Systems: Frequency stability viewpoint. IEEE Trans. Power Syst. 31 (6), 5163–5171. doi:10.1109/tpwrs.2016.2538083
Hajnoroozi, A. A., Aminifar, F., and Ayoubzadeh, H. (2015). Generating unit model validation and calibration through synchrophasor measurements. IEEE Trans. Smart Grid 6 (1), 441–449. doi:10.1109/tsg.2014.2322821
He, T., Li, S., Chen, Y., Wu, S., and Li, C. (2021). Optimal array reconfiguration of a PV power plant for frequency regulation of power systems. Front. Energy Res. 9, 698003. doi:10.3389/fenrg.2021.698003
Huang, R., Diao, R., Li, Y., Sanchez-Gasca, J., Huang, Z., Thomas, B., et al. (2018). Calibrating parameters of power system stability models using advanced ensemble Kalman filter. IEEE Trans. Power Syst. 33 (3), 2895–2905. doi:10.1109/tpwrs.2017.2760163
Kreyszig, E., Kreyszig, H., and Norminton, E. J. (2011). Advanced engineering mathematics, Hoboken, New Jersey, United States: Wiley.
Lyu, X., Zhao, Y., Grob, D., and Liu, T., (2022). Receding horizon control based secondary frequency regulation for power systems with wind energy integration. Int. J. Electr. Power & Energy Syst. 142, 108282. doi:10.1016/j.ijepes.2022.108282
Michael, F. (1994). Non-linear system vibration analysis using Hilbert transform--I. Free vibration analysis method 'Freevib. Mech. Syst. Signal Process. 8 (2), 119–127. doi:10.1006/mssp.1994.1011
Panda, R. K., Mohapatra, A., and Srivastava, S. C. (2020). Online estimation of system inertia in a power network utilizing synchrophasor measurements. IEEE Trans. Power Syst. 35 (4), 3122–3132. doi:10.1109/tpwrs.2019.2958603
Pulgar-Painemal, H., Wang, Y., and Silva-Saravia, H. (2018). On inertia distribution, inter-area oscillations and location of electronically-interfaced resources. IEEE Trans. Power Syst. 33 (1), 995–1003. doi:10.1109/tpwrs.2017.2688921
Sarić, A. T., Transtrum, M. T., and Stanković, A. M. (2019). Data-driven dynamic equivalents for power system areas from Boundary measurements. IEEE Trans. Power Syst. 34 (1), 360–370. doi:10.1109/tpwrs.2018.2867791
Sun, M., Feng, Y., Wall, P., Azizi, S., Yu, J., and Terzija, V. (2019). On-line power system inertia calculation using wide area measurements. Int. J. Electr. Power & Energy Syst. 109, 325–331. doi:10.1016/j.ijepes.2019.02.013
Tuttelberg, K., Kilter, J., Wilson, D. H., and Uhlen, K. (2018). Estimation of power system inertia from ambient wide area measurements. IEEE Trans. Power Syst. 33 (6), 7249–7257. doi:10.1109/tpwrs.2018.2843381
Vahidnia, A., Ledwich, G., Palmer, E., and Ghosh, A. (2013). Dynamic equivalent state estimation for multi-area power systems with synchronized phasor measurement units. Electr. Power Syst. Res. 96, 170–176. doi:10.1016/j.epsr.2012.11.006
Wilson, D., Yu, J., Al-Ashwal, N., Heimisson, B., and Terzija, V. (2019). Measuring effective area inertia to determine fast-acting frequency response requirements. Int. J. Electr. Power & Energy Syst. 113, 1–8. doi:10.1016/j.ijepes.2019.05.034
Yan, R., Masood, N. A., Saha, T. K., Bai, F., and Gu, H. (2018). The anatomy of the 2016 South Australia blackout: A catastrophic event in a high renewable network. IEEE Trans. Power Syst. 33 (5), 5374–5388. doi:10.1109/tpwrs.2018.2820150
Yang, D., Jin, Z., Zheng, T., and Jin, E. (2022). An adaptive droop control strategy with smooth rotor speed recovery capability for type III wind turbine generators. Int. J. Electr. Power & Energy Syst. 135, 107532. doi:10.1016/j.ijepes.2021.107532
Yang, D., Wang, B., Cai, G., and Wen, J. (2017). Oscillation mode analysis for power grids using adaptive local iterative filter decomposition. Int. J. Electr. Power & Energy Syst. 92, 25–33. doi:10.1016/j.ijepes.2017.04.004
Keywords: inertia estimation, regional grid, electromechanical oscillation, synchrophasor measurement, power system
Citation: Zhang Y, Qi F, He Y, Wang B and Yang D (2022) Synchrophasor data-based inertia estimation for regional grids in interconnected power systems. Front. Energy Res. 10:989430. doi: 10.3389/fenrg.2022.989430
Received: 08 July 2022; Accepted: 10 August 2022;
Published: 02 September 2022.
Edited by:
Xue Lyu, University of Wisconsin-Madison, United StatesReviewed by:
Shiwei Xia, North China Electric Power University, ChinaBin Zhou, Hunan University, China
Copyright © 2022 Zhang, Qi, He, Wang and Yang. This is an open-access article distributed under the terms of the Creative Commons Attribution License (CC BY). The use, distribution or reproduction in other forums is permitted, provided the original author(s) and the copyright owner(s) are credited and that the original publication in this journal is cited, in accordance with accepted academic practice. No use, distribution or reproduction is permitted which does not comply with these terms.
*Correspondence: Yiping Zhang, bnludWpla2l3YTJAb3V0bG9vay5jb20=