 Pablo R. Díaz-Herrera
 Ascención Romero-Martínez2
 Gabriel Ascanio
94% of researchers rate our articles as excellent or good
Learn more about the work of our research integrity team to safeguard the quality of each article we publish.
Find out more
ORIGINAL RESEARCH article
Front. Energy Res., 06 December 2022
Sec. Carbon Capture, Utilization and Storage
Volume 10 - 2022 | https://doi.org/10.3389/fenrg.2022.987166
This article is part of the Research TopicRising Stars in Carbon Capture, Utilization and Storage: 2022View all 6 articles
This work aims to analyze the cost projection of natural gas combined cycles (NGCC) with post-combustion carbon capture (PCC) technology for two promising power plant configurations, namely: conventional NGCC and exhaust gas recirculation (EGR). A thermo-economic analysis was performed considering the second-law efficiency for the CO2 separation process (
Mexico’s greenhouse gas (GHG) emissions from the electricity sector were 126.6 MtCO2eq, corresponding to 19.0% of total national emissions (INECC, 2015). This is due to the fact that around 80% of the Mexico’s electricity generation comes from fossil fuels (SENER, 2018a), with NGCC plants accounting for the largest proportion (∼50%) and they are expected to increase their participation in the long term (SENER, 2019; SENER, 2021). Therefore, technologies to reduce GHG emissions, especially CO2, from current and future NGCCs are of great interest to the country.
Carbon capture and storage (CCS) is a key technological tool for CO2 abatement in NGCC plants. One of the most promising CCS technologies is post-combustion carbon capture (PCC), which consists of separating the CO2 contained in flue gases from the stack through a chemical process with absorption-desorption cycles using an amine-based solvent as carbon captor material. In general, PCC technology is preferred over other CCS technologies (e.g., pre-combustion and oxy-fuel combustion) mainly because it can be coupled to new and existing plants with minor modifications (Figueroa et al., 2008; Freeman and Bhown, 2011; Sanchez Fernandez et al., 2014; Pan et al., 2016) and its higher technology maturity level (Wilcox, 2012; Oh et al., 2018; Feron et al., 2019; Finney et al., 2019).
Another alternative for CO2 mitigation in NGCC plants is the use of blending of natural gas with blue hydrogen (bH2) or green hydrogen (gH2). Especially, gH2 makes sense in the Mexican context, as there are vast renewable energy and water resources available. The Federal Comission of Electricity, a state-owned utility company, has realized this local advantage and, in early 2022, announced the implementation of a pilot project for the use of blending of natural gas with gH2 in a gas turbine (CFE, 2022). The purpose of this is to generate knowledge about the challenges and opportunities of using gH2 in electricity generation and, based on the results, to advance towards commercial scale-up.
Due to the relevant role that CCS and hydrogen could play in the decarbonization of the Mexican electricity sector in the long term, Díaz-Herrera et al. (2021) reported the comparison between PCC technology and the use of bH2 and gH2 in existing NGCCs. The techno-economic analysis considers fuel costs, capital expenditure, operating cost, and the plant capacity factor. The results show that the NGCC equipped with PCC (NGCC + PCC) is a much more economical alternative to reduce CO2 emissions ($140.4/tCO2) than the use of blendings of bH2 ($256.9/tCO2) and gH2 ($435.8/tCO2). Although PCC technology is an excellent alternative to mitigate CO2 emissions in NGCC plants, its high cost is the critical barrier to its commercial-scale deployment (Wilcox, 2012; DOE/NETL, 2010; Rubin et al., 2015; Irlam, 2017; Muhammad et al., 2020; Liu, 2020).
One strategy that several countries have adopted to promote the early deployment of carbon capture technologies in industrial processes that are difficult to decarbonize, such as an NGCC, is the application of a carbon tax (Shirmohammadi et al., 2020). For example, in 1991 Norway was one of the first countries in the world to introduce a carbon tax to reduce emissions from upstream oil and gas operations. This initiative prompted the development of the Sleipner project in 1996, the first large-scale carbon capture and storage (CCS) project in the world (Equinor, 2019). If we look into the North American region, in 2008, the United States implemented a carbon tax credit called 45Q, which provided $10/tCO2 stored via enhanced oil recovery (EOR) and $20/tCO2 stored in geologic formations (GCCSI, 2020). Later, in 2018, the 45Q tax credit was reformed as part of the Bipartisan Budget Act, increasing its value to $35/tCO2 for EOR projects and $50/tCO2 for geological storage (Jones and Sherlock, 2021). Recently, in 2022, the US Inflation Reduction Act has increased the value of the 45Q tax credit to $60/tCO2 for EOR purposes and $85/tCO2 for geological purposes (Bipartisan Policy Center, 2022). Canada introduced an investment tax credit for CCS deployment of $319 million over 7 years from 2021 (Government of Canada, 2021). So far, Mexico still does not have a solid regulatory framework for the financing of CCS projects; however, the recent United States-Mexico-Canada Agreement is expected to be a driver for the insertion and development of the first CCS projects in the country.
Assuming that Mexico acquires the same level of commitment in the fight against climate change as its partners in the short term and, considering that the CAC for a NGCC + PCC plant in the local context is $140.4/tCO2, this value is 1.7 times higher than the 45Q tax credit for geological storage. Therefore, a substantial increase in the tax credit would have to be necessary to implement the first commercial project in the country. This could lead to a significant increase in electricity costs, which would impact the economy of the population. Nevertheless, a positive approach to the fact that PCC technology is still in the research and development phase is that it can reduce its costs through the learning-by-doing effect, so it could be successfully developed in the next few years.
As with other types of technology, it is expected that the first generation of NGCC plants using PCC technology (FOAK plants) can be significantly more costly than later or advanced generations, which are referred to as NOAK plants. This has a favorable economic impact on the technology since the carbon tax could be very high in the early years for FOAK plants and progressively decrease until NOAK plants are economically competitive in the market on their own. A clear example of this was what happened with renewable energy in Mexico. In 2014, the Mexican government implemented clean energy certificates (CECs), a legal instrument promoting investment and development of solar and wind FOAK plants on a commercial scale (DOF, 2014). The CECs were gradually reduced until their cancellation in 2022, once renewable energies reduced their costs to the point of being economically competitive (Forbes, 2022). A very interesting aspect to analyze is the extent to which NOAK plants could reduce their costs or whether they will need to be permanently subsidized to ensure their operation during their useful life. Therefore, the cost projection of the NOAK plants is a key element since it could support the planning of the portfolio of strategies for the energy transition not only in Mexico, but also in other countries that depend on natural gas for their electricity generation (e.g., Japan, the United States, and Canada).
Very few research publications focused on cost projection for FOAK and NOAK NGCC plants equipped with PCC are available in the literature. One of them was published by Rubin et al. (2007), who performed a sensitivity analysis varying different technic-economic parameters for estimating NOAK NGCC power plants equipped with CO2 capture systems. In the case of NGCC + PCC plants, the results show that LCOE of a NOAK plant could be between 12% and 20.4% cheaper compared to a FOAK one. Additionally, (Irlam, 2017) reported the costs of NOAK plants for different industries (power, cement, iron, and steel). In the case of NGCCs, they conclude that the CAC for a FOAK and NOAK plant is $89 and $43/tCO2, respectively. This represents a cost reduction equal to 51.7%. Although both studies explain in-depth the economic assumptions that were considered to arrive at these results, they did not consider the fact that technology costs could also be constrained by thermodynamic principles. This is especially important to analyze, as the PCC plant currently demands a lot of energy for its operation, technological improvements will make it more and more efficient, which in turn will increase its economic performance, here a key question arises: to what extent can the NOAK NGCC + PCC plant be really efficient?
A key indicator to respond the above question is the second-law efficiency for the CO2 separation process (
Oh et al. (2018) focused on heat integration and the design process for the energy penalty reduction in a coal-fired power plant integrated with an amine-based PCC plant. Simulation results show that the net efficiency of the plant is reduced by 9.7% points (3.1% points less than the conventional PCC technology). Saleh et al. (2019) proposed a novel conceptual NGCC configuration integrated with a lithium-based PCC technology, which shows a reduction in its net efficiency equal to 9.2% points, being this value close to the energy penalty of the amine-based PCC technology published elsewhere (Sanchez Fernandez et al., 2014; Díaz-Herrera et al., 2021). Other studies reported the use of thermal solar energy to compensate for the energy penalty of the PCC plant (Li et al., 2012; Lambert et al., 2014; Wang et al., 2015; Liu et al., 2017; Shirmohammadi et al., 2021). A very interesting study on this subject is the one published by Zhai and co-workers (Zhai et al., 2018), who mentioned that a coal-fired power plant with a solar-assisted PCC plant shows a higher LCOE than the conventional PCC technology, mainly because of the increase in the CAPEX associated with the solar farm. Other authors evaluated the energy performance of novel power plant configurations; for example, Lindqvist et al. (2014) notified that an NGCC + EGR has a lower energy penalty than the conventional NGCC plant (7.6% vs. 8.7% points), mainly because its higher CO2 concentration in the flue gas.
Capture level is another strategy to reduce the energy penalty of the power plant and reduce the CAPEX of the PCC (Hildebrand and Herzog, 2009; Wilcox et al., 2017; Feron et al., 2019). This consists of capturing an amount of CO2 at lower rates or partially capturing it to reduce the cost. Several studies focus on the technical and economic implications of the use of the capture level in the PCC plant; one of these is published by Wilcox et al. (2017), who mentioned that there is a direct relationship between the carbon capture level and the minimum thermodynamic work for the CO2 separation (
As can be seen, there is a lot of information in the literature focused on reducing the energy penalty of the PCC plant, as well as its capital cost; nevertheless, very few papers paying attention to the effect of the
This study aims to analyze the cost projection of FOAK and NOAK type plants for two promising NGCC configurations, namely: conventional NGCC and EGR. A thermo-economic analysis was performed considering the
The work is organized as follows. First, the methodology is described. Then, the results are presented and discussed. Finally, a conclusion is reached.
Twelve study cases were evaluated in this work: Conventional NGCC (NGCC) and NGCC with exhaust gas recirculation (EGR), considering two technological maturity statuses, FOAK and NOAK plants, at different carbon capture levels (see Table 1). A thermo-economic analysis was performed considering the
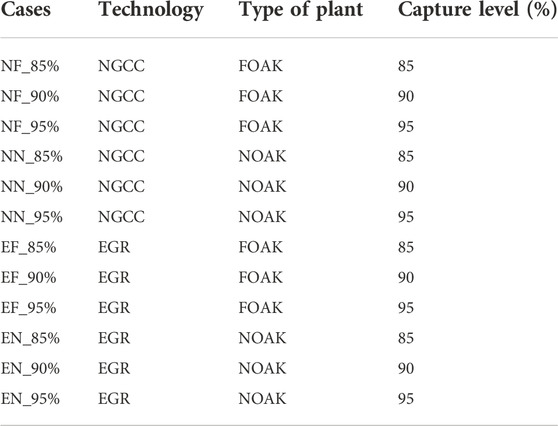
TABLE 1. Study cases assessed in this work.
A brief description of the configuration and operation of the conventional NGCC and EGR power plants is given below:
1. Conventional NGCC. The configuration includes two gas turbine trains in parallel, with a heat recovery steam generator (HRSG) for each gas turbine, and one steam turbine for both HRSG, as shown in Figure 1. The steam produced in the HRSGs goes to the steam turbine to generate power. Three levels of steam are generated in the HRSG: high, intermediate, and low steam pressures.
2. Exhaust Gas Recirculation (EGR) is presented in Figure 2. This alternative has the same configuration as the conventional NGCC case, but with a cooler and a liquid-vapor separator incorporated in each train to cool and remove water from the flue gas recirculated to the gas turbine. The exhaust gas is recirculated at a rate of 35% and subsequently cooled at 40°C before being fed to the compressor (Li et al., 2011; Vaccarelli et al., 2014).
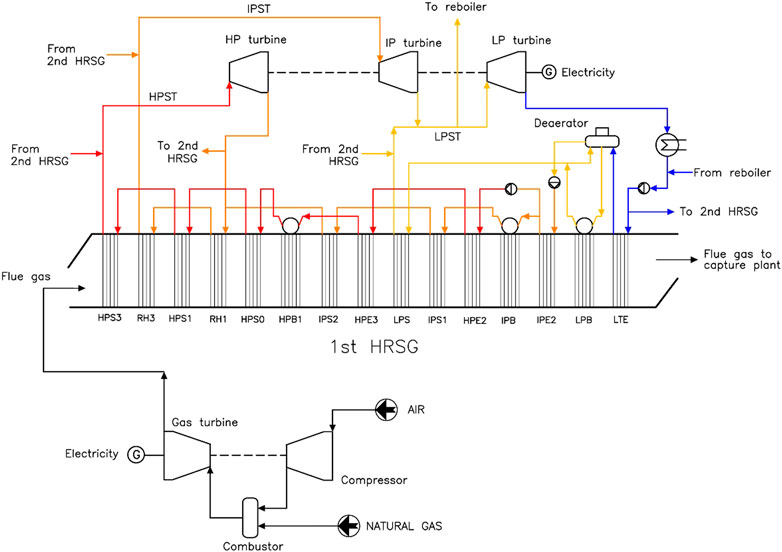
FIGURE 1. Conventional case: Natural gas combined cycle. Extracted from (Díaz-Herrera et al., 2020).
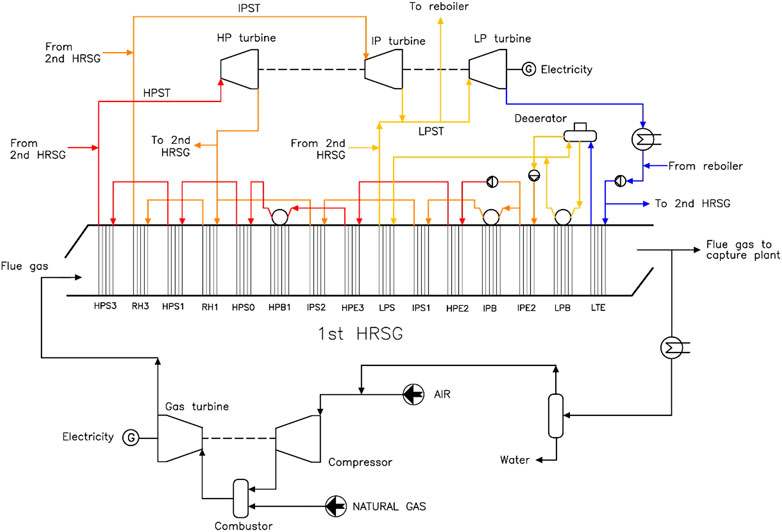
FIGURE 2. Exhaust Gas Recirculation combined cycle. Extracted from (Díaz-Herrera et al., 2020).
In both power plant configurations, low-pressure steam is extracted and sent out to the capture plant reboiler to cover the thermal energy demand for solvent regeneration. At the same time, the power plant supplies the electrical demand of process equipment (e.g., pumps, fans, compressors, among others).
Method to calculate the
The second-law efficiency (
where
where
where
On the other hand, the effect of the
The method selected to calculate the CAPEX for a NOAK NGCC-CCS plant is based on Ref. (Roussanaly et al., 2021), which consists of a hybrid method combining the engineering-economic and the experience curve approaches.
First, the overall plant is decomposed into major technology sub-sections and the capital cost estimation for each one is calculated. For each case, the total CAPEX of all sub-sections corresponds to a FOAK plant. Then, appropriate learning rates (LR) are selected for each major technology sub-section. Table 2 shows the learning rates used for each sub-section. As learning rates are related to technology maturity, each sub-section has different values. For well-known technologies, learning rates are very low (1% ≤), e.g., conventional gas turbine, steam turbine, and HRSG. In contrast, processes with low technological maturity show a higher learning rate, e.g., PCC technology and advanced combustion turbines (EGR gas turbines). It is worth mentioning that there are no measured learning rates for PCC amine-based systems for CO2 capture yet, as only a few plants have been built so far. Thus, learning rates for flue gas desulfurization (FGD) systems were used as a proxy for PCC technology (LR = 11%).
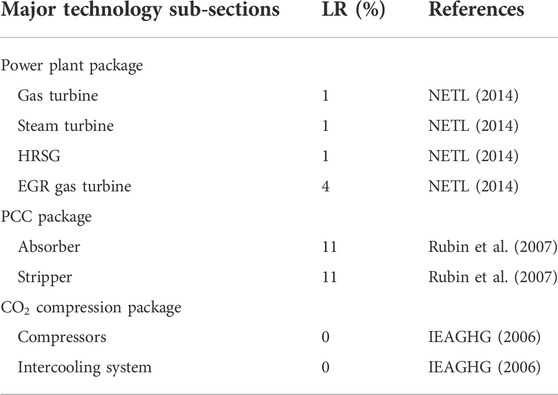
TABLE 2. Learning rates (LR) used for each major technology sub-section.
After the CAPEX and the learning rate of each technology sub-section were estimated, the starting and end points of the experience curves were set. Applying an experience curve using the hybrid method requires assumptions for when cost reductions begin and how long will they continue at the specified learning rate. The guidelines for such assumptions depend on the current maturity of each technology sub-section. For pre-commercial technologies, e.g., PCC plant and EGR gas turbine, the size of the power plant represents the starting point (initial capacity = 800 MW). In contrast, the end point of the cost curve (the point at which the technology can be labeled as mature) can be proxy equal to 20 replications of its initial capacity (Roussanaly et al., 2021). Therefore, in this work, it is assumed that the starting and end points, both for the EGR gas turbine and the PCC plant, are equal to 800 and 16,000 MW, respectively (800 MW * 20 = 16,000 MW). For the commercial technologies sub-sections, we assume the following starting points based on its estimated current capacity (MW) (IEAGHG, 2006): 10,000 MW for CO2 compression; and 240,000 MW for gas turbine, steam turbine, and HRSG; while the end point for each one is estimated adding the end point capacity of the pre-commercial technology component to its estimated current capacity (e.g., gas turbine = 240 GW + 16 GW = 256 GW).
Once all sub-section learning rates and starting/end points for experience curves were specified, Eqs 4, 5 were used to project the future CAPEX for a NOAK plant ($/kW) (Bui et al., 2018):
where n is a specified technology sub-section;
The economic indicators used in this study were the LCOE and the CAC, both reported in 2022 constant-dollar. The LCOE was calculated using Eqs 6, 7 (Rubin et al., 2015):
where the LCOE is in units of $/MWh; FCF is the fixed charge factor (dimensionless); CAPEX is the capital expenditure ($); FOM is the annual fixed O&M costs ($/year); MW is the net power output (MW); CF is the plant capacity factor (%); VOM is the variable O&M costs ($/MWh); FC is the fuel cost per unit of energy ($/MJ); HR is the net power heat rate (MJ/MWh);
The CAC is an indicator that compares a power plant with a carbon mitigation technology to a “reference plant” without CO2 reduction technology and quantifies the average cost of avoiding a unit of atmospheric CO2 emissions per MWh (Metz B et al., 2005). For all cases, the CAC is calculated using Eq. 8. For this work, conventional NGCC without capture (base case) is the reference plant.
The main assumptions for the economic analysis are shown below:
• The baseline fuel cost (FC) for this analysis is $5.8 per million British thermal units ($/MMBtu) based on historical data from Ref. (EIA, 2020; Natural Gas Prices, 2020) (see Supplementary Figure S1).
• For all cases, the CAPEX, FOM, VOM, and, TCO2 are obtained based on a previous work (Díaz-Herrera et al., 2020). The CAPEX and TCO2 were updated from 2017 to 2022 using the Chemical Engineering Plant Cost Index (CEPCI) (ToweringSkills, 2022). While, for the FOM and VOM, we escalated costs from 2017 to current 2022 dollars according to the Mexican Producer Price Index (PPI) normalized to 60 in the year 2008 (INEGI, 2022).
• The
• The economic life of the plant was assumed to be 30 years (SENER, 2018a; SENER, 2018b) with a capacity factor (CF) equal to 85%.
• For NOAK plants, the learning rate was only applied to CAPEX. The projection costs of FOM, VOM, and TCO2 are assumed to be fixed over time because the learning rates for O&M in CCS projects show a very low effect on the overall capture cost (Roussanaly et al., 2021).
• The present work is limited to assessing the CO2 capture and geological storage cost in NGCC plants. The CO2 industrial utilization for commercial purposes (e.g., EOR, synthetic fuel production, beverages carbonation, etc.) is out of the scope of this paper.
Table 3 shows the
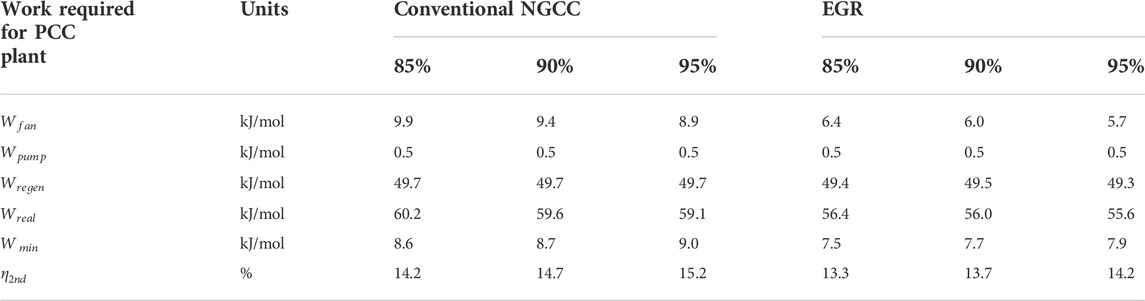
TABLE 3. Second-law efficiency values for NGCC and EGR configuration at different capture levels (%).
Figures 3, 4 show the CAPEX for conventional NGCC and EGR power plants with PCC technology classified by type of plant at different carbon capture levels, respectively. As expected, the PCC package is the technology with the highest cost reduction, with a total CAPEX reduction of around 40% for a NOAK compared to the FOAK plant. While, for the power plant and CO2 compression packages, the CAPEX reduction is marginal. This is because the PCC’s learning technology rate is higher compared to the power plant and the CO2 compression system (see Table 2). For FOAK plants, PCC shows, in general terms, a higher cost than the power plant package. However, it is estimated that the cost of the PCC plant could decrease in the future (NOAK plants), even making it potentially cheaper than the power plant package (see more details in Supplementary Table S4).
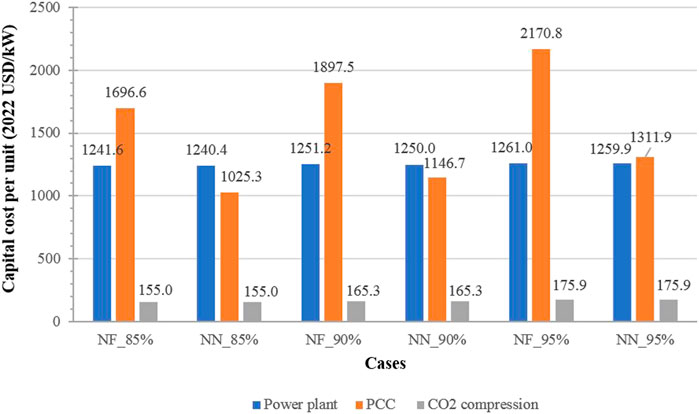
FIGURE 3. Capital cost for conventional NGCC power plant with PCC technology by type of plant (FOAK and NOAK) at different capture levels.
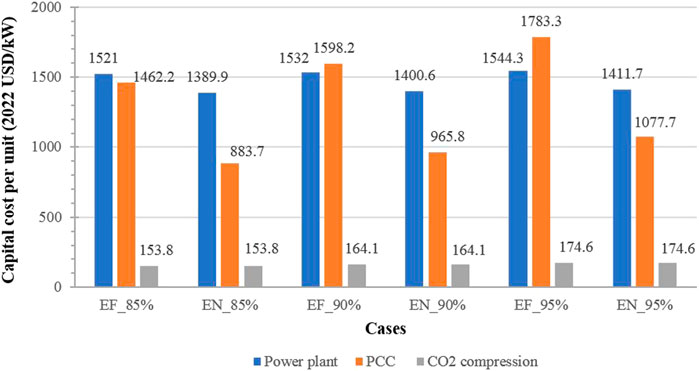
FIGURE 4. Capital cost for EGR power plant with PCC technology by type of plant (FOAK and NOAK) at different capture levels.
The CAPEX reduction in the PCC technology has a significant effect on LCOE. From Figure 5, we can see that CAPEX is one of the most crucial component cost. The estimated CAPEX reduction for a NOAK plant (mainly due to PCC technology) could potentially decrease the LCOE by 10%–11% in comparison with the FOAK plant type. For example, a NOAK NGCC plant with a 90% carbon capture level (NN-90%) has an LCOE equal to $92.5/MWh, which is 10.4% lower than a FOAK plant type (NF-90% = $103.1/MWh). This percentage of the reduction in the LCOE is in good agreement with the results published by Rubin et al. (Rubin et al., 2007).
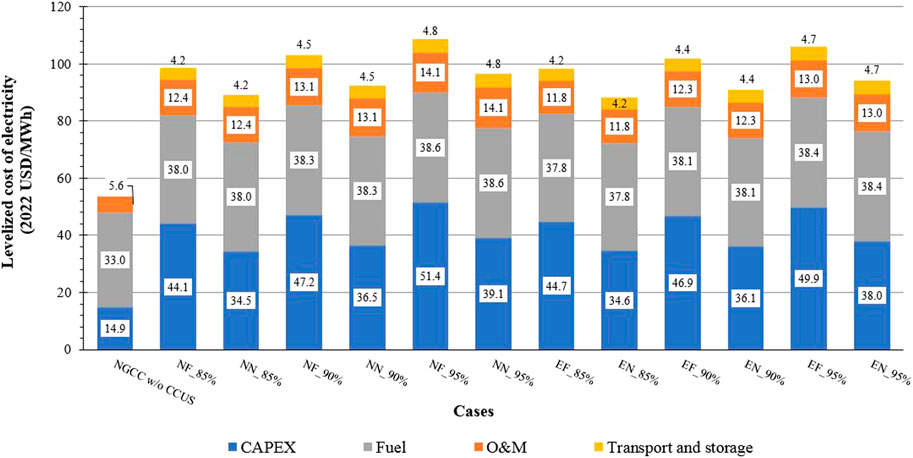
FIGURE 5. LCOE for NGCC and EGR power plants with PCC technology by type of plant at different capture levels.
On the other hand, Figures 6, 7 show the effect of the
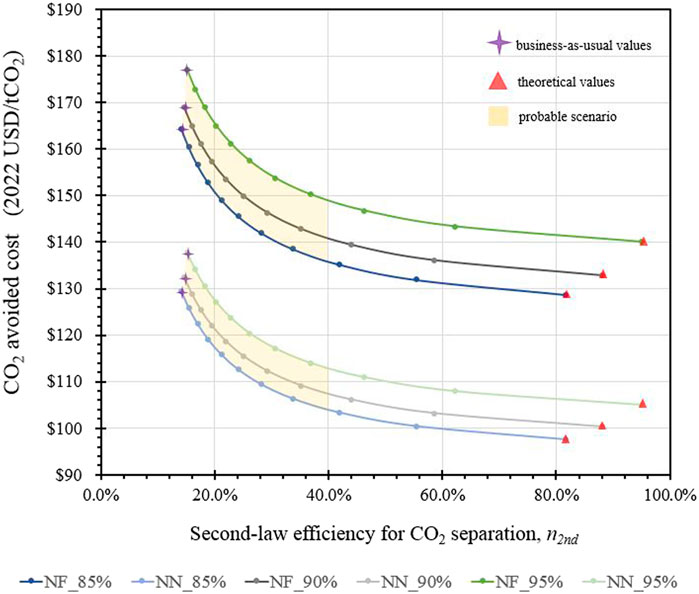
FIGURE 6. Effect of the
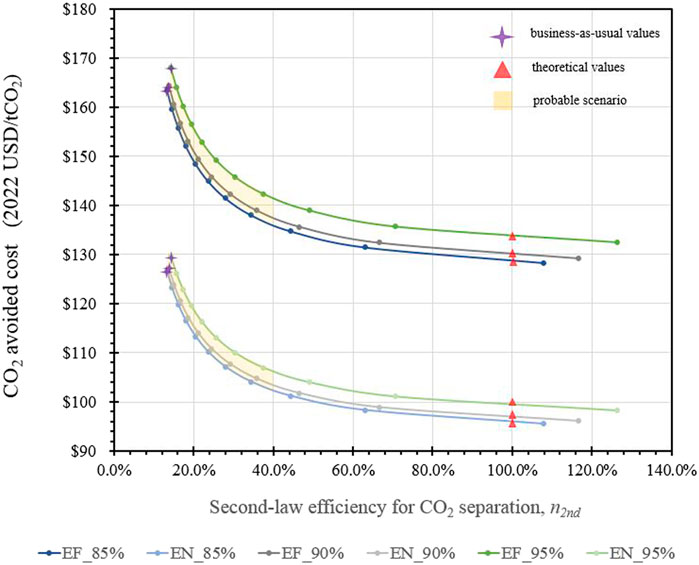
FIGURE 7. Effect of the
In addition, we can observe significant changes in the CAC value between FOAK and NOAK plants. For example, for a conventional NGCC plant with a 90% carbon capture rate (NF-90%), the BAU value for a FOAK plant is $169.0/tCO2 compared to the $132.4/tCO2 for a NOAK plant (NN-90%), which represents a cost reduction equal of 21.6% (see Supplementary Table S5 in the Supplementary Information section). A similar percentage in the cost reductions shows the EGR cases; for example, in an EGR plant with a 90% carbon capture level, the BAU value for a FOAK plant (EF-90%) is $164.5/tCO2 compared to the $127.3/tCO2 for a NOAK plant (EN-90%), representing a cost reduction of 22.6%.
Regarding NOAK-type plants, Figure 8 shows the expected carbon mitigation cost for future NGCC and EGR power plants as a function of the capture rate at
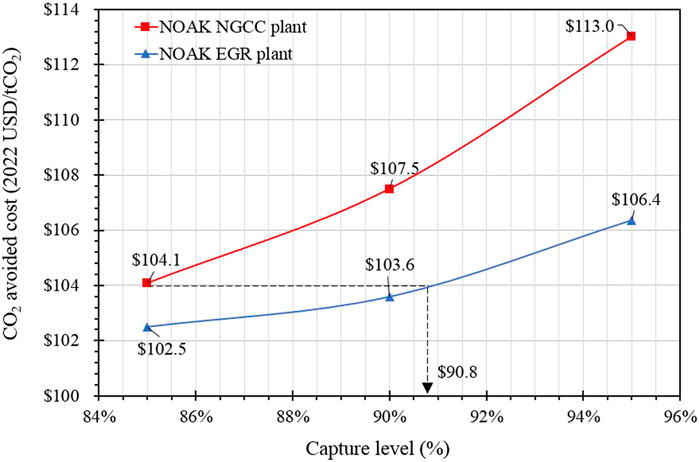
FIGURE 8. Carbon mitigation cost estimation for future NGCC and EGR power plants as a function of the capture level at
One of the thermodynamic implications of assuming a value of
Considering a PCC’s learning rate equal to 11% and an
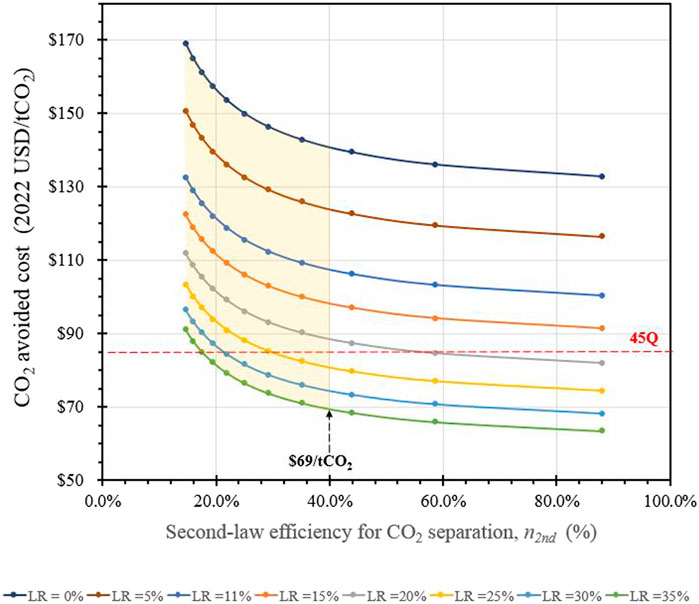
FIGURE 9. Effect of the variation of the learning rate of the PCC technology on the CAC. Note: The curves with learning rate values equal to 0% and 11% correspond to the cases NF_90% and NN_90%, respectively.
This study performed a scenario analysis for estimating the cost of FOAK and NOAK combined cycle plants equipped with PCC. Cost projections for conventional NGCC and EGR configurations were evaluated considering the
• Among the major technology sub-sections involved in a CCS project, PCC shows the highest cost reduction, with a total CAPEX reduction of about 40% for a NOAK compared to a FOAK plant. While, for the power plant and CO2 compression technology sub-sections, the CAPEX reduction is marginal. This CAPEX reduction for NOAK plants potentially represents a decrease in the LCOE by 10%–11%, and the CAC by 21%–23% compared with the BAU values for FOAK plants in similar conditions.
• Considering an
• Assuming a scenario where NOAK plants achieve an
• At 85% capture, the CAC for the conventional NOAK NGCC plant is $104.1/tCO2. Maintaining this same CAC value, the carbon capture rate could increase from 85% to 90.8% if the EGR configuration is implemented.
• Considering a PCC’s learning rate equal to 11% and an
The original contributions presented in the study are included in the article/Supplementary Material, further inquiries can be directed to the corresponding author.
PD-H and GA contributed to the conception and design of the study. AR-M organized the database. PD-H, GA, and AR-M performed the data analysis and interpretation. PD-H wrote the first draft of the manuscript. GA and AR-M wrote sections of the manuscript. All authors contributed to manuscript revision, read, and approved the submitted version.
AR-M would like to thank Mexican Petroleum Institute for the support and participation in the present work.
The authors declare that the research was conducted in the absence of any commercial or financial relationships that could be construed as a potential conflict of interest.
All claims expressed in this article are solely those of the authors and do not necessarily represent those of their affiliated organizations, or those of the publisher, the editors and the reviewers. Any product that may be evaluated in this article, or claim that may be made by its manufacturer, is not guaranteed or endorsed by the publisher.
The Supplementary Material for this article can be found online at: https://www.frontiersin.org/articles/10.3389/fenrg.2022.987166/full#supplementary-material
Bipartisan Policy Center, B. P. C. (2022). Inflation reduction Act (IRA) summary: Energy and climate provisions. Available from: https://bipartisanpolicy.org/blog/inflation-reduction-act-summary-energy-climate-provisions/.
Bolland, O., and Undrum, H. (2003). A novel methodology for comparing CO2 capture options for natural gas-fired combined cycle plants. Adv. Environ. Res. 7 (4), 901–911. doi:10.1016/s1093-0191(02)00085-0
Bui, M., Adjiman, C. S., Bardow, A., Anthony, E. J., Boston, A., Brown, S., et al. (2018). Carbon capture and storage (CCS): The way forward. Energy Environ. Sci. 11 (5), 1062–1176. doi:10.1039/c7ee02342a
CFE (2022). CFE trabaja en proyecto de hidrógeno verde para minimizar dependencia de gas natural. Comisión Federal de Electricidad. Available at: https://app.cfe.mx/Aplicaciones/OTROS/Boletines/boletin?i=2442.
Díaz-Herrera, P. R., Alcaraz-Calderon, A. M., Gonzalez-Diaz, M. O., and Gonzalez-Diaz, A. (2020). Capture level design for a natural gas combined cycle with post-combustion CO2 capture using novel configurations. Energy 193, 116769. doi:10.1016/j.energy.2019.116769
Díaz-Herrera, P. R., Ascanio, G., Romero-Martinez, A., Alcaraz-Calderon, A. M., and Gonzalez-Diaz, A. (2021). Theoretical comparison between post-combustion carbon capture technology and the use of blue and green H2 in existing natural gas combined cycles as CO2 mitigation strategies: A study under the context of mexican clean energy regulation. Int. J. Hydrogen Energy 46 (2), 2729–2754. doi:10.1016/j.ijhydene.2020.10.076
DOE/NETL (2010). Bituminous Coal and Natural Gas to Electricity, Vol. 1.Cost Perform. Baseline Fossil Energy Plants Revision 2 (No. DOE/NETL-2010/1397).
DOF (2014). LINEAMIENTOS que establecen los criterios para el otorgamiento de Certificados de Energías Limpias y los requisitos para su adquisición. Available from: https://dof.gob.mx/nota_detalle.php?codigo=5366674&fecha=31/10/2014#gsc.tab=0.
EIA (2020). U.S. Natural gas imports by pipeline from Mexico. Available from: https://www.eia.gov/dnav/ng/ng_move_poe2_dcu_NUS-NMX_a.htm.
Equinor, (2019). Sleipner partnership releases CO2 storage data. Available from: https://www.equinor.com/en/news/2019-06-12-sleipner-co2-storage-data.html.
Feron, P., Cousins, A., Jiang, K., Zhai, R., Shwe Hla, S., Thiruvenkatachari, R., et al. (2019). Towards zero emissions from fossil fuel power stations. Int. J. Greenh. Gas Control 87, 188–202. doi:10.1016/j.ijggc.2019.05.018
Figueroa, J. D., Fout, T., Plasynski, S., McIlvried, H., and Srivastava, R. D. (2008). Advances in CO2 capture technology—the U.S. Department of energy's carbon sequestration program. Int. J. Greenh. Gas Control 2 (1), 9–20. doi:10.1016/s1750-5836(07)00094-1
Finney, K. N., Akram, M., Diego, M. E., Yang, X., and Pourkashanian, M. (2019). “Chapter 2 - carbon capture technologies,” in Bioenergy with carbon capture and storage. Editors J. C. Magalhães Pires, and A. L. D. Cunha Gonçalves (Academic Press), 15–45.
Forbes (2022). Forbes de la iniciativa de reforma eléctrica: Cancelación de contratos y CFE como rector. Available from: https://www.forbes.com.mx/negocios-guia-forbes-reforma-electrica-cancelacion-de-contratos-cfe-como-rector/#:∼:text=En%20este%20%E2%80%9Cnuevo%20sistema%20el%C3%A9ctrico,la%20energ%C3%ADa%20limpia%20del%20pa%C3%ADs.
Freeman, B. C., and Bhown, A. S. (2011). Assessment of the technology readiness of post-combustion CO2 capture technologies. Energy Procedia 4, 1791–1796. doi:10.1016/j.egypro.2011.02.055
GCCSI (2020). The US section 45Q tax credit for carbon oxide sequestration: An update. Global CCS Institute. Available at: https://www.globalccsinstitute.com/wpcontent/uploads/2020/04/45Q_Brief_in_template_LLB.pdf.
Government of Canada (2021). Budget 2021: Part 2 - Creating Jobs and Growth. Available from: https://www.budget.gc.ca/2021/report-rapport/p2-en.html.
Hildebrand, A. N., and Herzog, H. J. (2009). Optimization of carbon capture percentage for technical and economic impact of near-term CCS implementation at coal-fired power plants. Energy Procedia 1 (1), 4135–4142. doi:10.1016/j.egypro.2009.02.222
House, K. Z., Baclig, A. C., Ranjan, M., van Nierop, E. A., Wilcox, J., and Herzog, H. J. (2011). Economic and energetic analysis of capturing CO2 from ambient air. Proc. Natl. Acad. Sci. U. S. A. 108 (51), 20428–20433. doi:10.1073/pnas.1012253108
IEAGHG (2006). Estimating future trends in the cost of CO2 capture technologies. Cheltenham, United Kingdom: Carnegie Mellon University.
IEAGHG (2011). The cost of CO2 storage: Post-demonstration CCS in the EU. Available from: https://www.globalccsinstitute.com/archive/hub/publications/119816/costs-co2-storage-post-demonstration-ccs-eu.pdf.
INECC (2015). Inventario nacional de Emisiones de Gases de Efecto invernadero. Instituto Nacional de Ecología y Cambio Climático. Available at: https://www.gob.mx/inecc/acciones-y-programas/inventario-nacional-de-emisionesde-gases-y-compuestos-de-efecto-invernadero.
INEGI (2022). Mexican producer price index. Available from: https://en.www.inegi.org.mx/temas/inpp/.
Irlam, L. (2017). Global costs of carbon capture and storage: 2017 update. Glob. CCS Inst. book 67, 5654.
Jones, A. C., and Sherlock, M. F. (2021). The tax credit for carbon sequestration (section 45Q). Congr. Res. Serv., 3.
Lambert, T., Hoadley, A., and Hooper, B. (2014). Process integration of solar thermal energy with natural gas combined cycle carbon capture. Energy 74, 248–253. doi:10.1016/j.energy.2014.06.038
Li, H., Ditaranto, M., and Berstad, D. (2011). Technologies for increasing CO2 concentration in exhaust gas from natural gas-fired power production with post-combustion, amine-based CO2 capture. Energy 36 (2), 1124–1133. doi:10.1016/j.energy.2010.11.037
Li, H., Yan, J., and Campana, P. E. (2012). Feasibility of integrating solar energy into a power plant with amine-based chemical absorption for CO2 capture. Int. J. Greenh. Gas Control 9, 272–280. doi:10.1016/j.ijggc.2012.04.005
Lindqvist, K., Jordal, K., Haugen, G., Hoff, K. A., and Anantharaman, R. (2014). Integration aspects of reactive absorption for post-combustion CO2 capture from NGCC (natural gas combined cycle) power plants. Energy 78, 758–767. doi:10.1016/j.energy.2014.10.070
Liu, J. (2020). Investigation into an energy-saving mechanism for advanced stripper configurations in post-combustion carbon capture. J. Taiwan Inst. Chem. Eng. 108, 43–54. doi:10.1016/j.jtice.2019.12.012
Liu, Y., Deng, S., Zhao, R., He, J., and Zhao, L. (2017). Energy-saving pathway exploration of CCS integrated with solar energy: A review of innovative concepts. Renew. Sustain. Energy Rev. 77, 652–669. doi:10.1016/j.rser.2017.04.031
McDonald, A., and Schrattenholzer, L. (2001). Learning rates for energy technologies. Energy Policy 29 (4), 255–261. doi:10.1016/s0301-4215(00)00122-1
Metz B, D. O., Coninck, H. D., Loos, M., and Meyer, L. (2005). Carbon dioxide capture and storage: IPCC special report, 431.
Muhammad, H. A., Sultan, H., Lee, B., Imran, M., Baek, I. H., Baik, Y. J., et al. (2020). Energy minimization of carbon capture and storage by means of a novel process configuration. Energy Convers. Manag. 215, 112871. doi:10.1016/j.enconman.2020.112871
Natural gas prices - historical chart. 2020 [cited 2020 2020-05-31 12:34:46]. Available from: https://www.macrotrends.net/2478/natural-gas-prices-historical-chart.
NETL (2014). Technology learning curve (FOAK to NOAK), quality guidelines for energy system studies. Pittsburgh, PA: National Energy Technology Laboratory, U.S. Department of Energy.
Normann, F., Garðarsdottir, S. O., Skagestad, R., Mathisen, A., and Johnsson, F. (2017). Partial capture of carbon dioxide from industrial sources - a discussion on cost optimization and the CO2 capture rate. Energy Procedia 114, 113–121. doi:10.1016/j.egypro.2017.03.1154
Oh, S.-Y., Yun, S., and Kim, J.-K. (2018). Process integration and design for maximizing energy efficiency of a coal-fired power plant integrated with amine-based CO2 capture process. Appl. Energy 216, 311–322. doi:10.1016/j.apenergy.2018.02.100
Pan, M., Aziz, F., Li, B., Perry, S., Zhang, N., Bulatov, I., et al. (2016). Application of optimal design methodologies in retrofitting natural gas combined cycle power plants with CO2 capture. Appl. Energy 161, 695–706. doi:10.1016/j.apenergy.2015.03.035
Roussanaly, S., Rubin, E., van der Spek, M., Booras, G., Berghout, N., Fout, T., et al. (2021). Towards improved guidelines for cost evaluation of carbon capture and storage. Available from: https://netl.doe.gov/energy-analysis/details?id=7d80d478-b68b-4598-a934-78cffbb3ddf3.
Rubin, E. S., Davison, J. E., and Herzog, H. J. (2015). The cost of CO2 capture and storage. Int. J. Greenh. Gas Control 40, 378–400. doi:10.1016/j.ijggc.2015.05.018
Rubin, E. S., Yeh, S., Antes, M., Berkenpas, M., and Davison, J. (2007). Use of experience curves to estimate the future cost of power plants with CO2 capture. Int. J. Greenh. Gas Control 1 (2), 188–197. doi:10.1016/s1750-5836(07)00016-3
Saleh, A., Sanchez Fernandez, E., Maroto-Valer, M. M., and Garcia, S. (2019). Conceptual design for integrating lithium-based carbon capture looping systems into natural gas combined cycle power plants. Ind. Eng. Chem. Res. 58 (32), 14975–14990. doi:10.1021/acs.iecr.9b00752
Sanchez Fernandez, E., Goetheer, E., Manzolini, G., Macchi, E., Rezvani, S., and Vlugt, T. (2014). Thermodynamic assessment of amine based CO2 capture technologies in power plants based on European Benchmarking Task Force methodology. Fuel 129, 318–329. doi:10.1016/j.fuel.2014.03.042
SENER (2018a). Programa de Desarrollo del Sistema Eléctrico Nacional (PRODESEN) 2018-2032. Secretaría de Energía. Available at: https://www.gob.mx/cms/uploads/attachment/file/331770/PRODESEN-2018-2032-definitiva.pdf.
SENER (2018b). Tabla de permisos de generación e importación de energía eléctrica administrados al 30 de abril de 2018. Available from: https://www.gob.mx/cms/uploads/attachment/file/323655/INFO_PAGINA_2018-04-30_-_1TablaPermisos.pdf.
SENER (2019). Programa de Desarrollo del Sistema Eléctrico Nacional (PRODESEN) 2019-2033. Secretaría de Energía. Available at: https://www.gob.mx/sener/articulos/prodesen-2019-2033-221654.
SENER (2021). Programa de Desarrollo del Sistema Eléctrico Nacional (PRODESEN) 2020–2024. Available from: https://www.gob.mx/sener/articulos/prodesen-2020-2034.
Shirmohammadi, R., Aslani, A., and Ghasempour, R. (2020). Challenges of carbon capture technologies deployment in developing countries. Sustain. Energy Technol. Assessments 42, 100837. doi:10.1016/j.seta.2020.100837
Shirmohammadi, R., Aslani, A., Ghasempour, R., Romeo, L. M., and Petrakopoulou, F. (2021). Techno-economic assessment and optimization of a solar-assisted industrial post-combustion CO2 capture and utilization plant. Energy Rep. 7, 7390–7404. doi:10.1016/j.egyr.2021.10.091
ToweringSkills (2022). Cost indices. Available from: https://www.toweringskills.com/financial-analysis/cost-indices/.
Vaccarelli, M., Carapellucci, R., and Giordano, L. (2014). Energy and economic analysis of the CO2 capture from flue gas of combined cycle power plants. Energy Procedia 45, 1165–1174. doi:10.1016/j.egypro.2014.01.122
Vega, F., Baena-Moreno, F., Gallego Fernandez, L. M., Portillo, E., Navarrete, B., and Zhang, Z. (2020). Current status of CO2 chemical absorption research applied to CCS: Towards full deployment at industrial scale. Appl. Energy 260, 114313. doi:10.1016/j.apenergy.2019.114313
Wang, F., Zhao, J., Li, H., Li, H., Zhao, L., and Yan, J. (2015). Experimental study of solar assisted post-combustion carbon capture. Energy Procedia 75, 2246–2252. doi:10.1016/j.egypro.2015.07.401
Wilcox, J. Carbon capture. 2012, Available at: https://www.springer.com/gp/book/9781461422143.
Wilcox, J., Psarras, P. C., and Liguori, S. (2017). Assessment of reasonable opportunities for direct air capture. Environ. Res. Lett. 12 (6), 065001. doi:10.1088/1748-9326/aa6de5
Zhai, R., Liu, H., Wu, H., Yu, H., and Yang, Y. (2018). Analysis of integration of MEA-based CO2 capture and solar energy system for coal-based power plants based on thermo-economic structural theory. Energies 11 (5), 1284. doi:10.3390/en11051284
BAU business-as-usual
CAC CO2 avoided cost
CAPEX capital expenditure
CCS carbon capture and storage
EGR exhaust gas recirculation
EOR enhanced oil recovery
FOAK first-of-a-kind plant
LCOE levelized cost of electricity
LR learning rate
NGCC natural gas combined cycle
NOAK Nth-of-a-kind plant
O&M operating and maintenance
PCC post-combustion carbon capture.
Keywords: post-combustion, natural gas combined cycle, cost projection, learning rate, experience curves, second-law efficiency, NOAK plants, carbon tax
Citation: Díaz-Herrera PR, Romero-Martínez A and Ascanio G (2022) Cost projection of combined cycle power plants equipped with post-combustion carbon capture. Front. Energy Res. 10:987166. doi: 10.3389/fenrg.2022.987166
Received: 05 July 2022; Accepted: 16 November 2022;
Published: 06 December 2022.
Edited by:
Anne Mae Gaffney, Idaho National Laboratory (DOE), United StatesReviewed by:
Shuiping Yan, Huazhong Agricultural University, ChinaCopyright © 2022 Díaz-Herrera, Romero-Martínez, Ascanio. This is an open-access article distributed under the terms of the Creative Commons Attribution License (CC BY). The use, distribution or reproduction in other forums is permitted, provided the original author(s) and the copyright owner(s) are credited and that the original publication in this journal is cited, in accordance with accepted academic practice. No use, distribution or reproduction is permitted which does not comply with these terms.
*Correspondence: Pablo R. Díaz-Herrera, cGFibG9yLmRpYXpoQGdtYWlsLmNvbQ==
†These authors have contributed equally to this work and share first authorship
Disclaimer: All claims expressed in this article are solely those of the authors and do not necessarily represent those of their affiliated organizations, or those of the publisher, the editors and the reviewers. Any product that may be evaluated in this article or claim that may be made by its manufacturer is not guaranteed or endorsed by the publisher.
Research integrity at Frontiers
Learn more about the work of our research integrity team to safeguard the quality of each article we publish.