- 1College of Engineering, Hebei Normal University, Shijiazhuang, China
- 2Technical Vocational Institute, Hebei Normal University, Shijiazhuang, China
- 3State Key Laboratory of Enhanced Oil Recovery, CNPC, Beijing, China
- 4Research Institute of Petroleum Exploration and Development, CNPC, Beijing, China
Although it is generally very difficult to supplement flow energy into the tight oil reservoir, there is still good prospect for enhanced oil and gas recovery in this area due to its large proportion of hydrocarbon reserves. However, due to the sensitivity of tight oil reservoir to formation pressure, the porosity and permeability of the reservoir will change greatly with the change of formation pressure in the process oil development, which has a complex impact on dynamic analysis, productivity evaluation and later adjustment of potential stimulation measures. This study mainly focus on the characterization of tight formation rock in the Northwest part of China. In order to get a visual impression of the reservoir core, some routine tests were firstly carried out. After that, porosity and permeability are tested under overburden pressure conditions. Studies show that overburden porosity and permeability will decrease but total decrease percentage will increase with the increase of net effective overburden pressure. The decrease percentage of permeability is much higher compared with that of porosity decrease percentage under overburden pressures. When the net effective overburden pressure is larger than 10 MPa, the decrease of overburden porosity will become relatively small. At the same time, when the net effective overburden pressure is larger than 15 MPa, the decrease of overburden permeability will become relatively small. Taking the pressure-increasing process and the pressure-decreasing process as a whole: the permeability cannot recover to the initial level when overburden pressure is the same as previous round because certain permeability is permanently damaged in the process. At the same time, when the net effective overburden pressure increased to a higher level, the permeability damaged will become relatively smaller. These experiments compose of a comprehensive characterization of formation rock and are of great significance to accurately understand the reservoir damage in the process of tight oil development and reasonably evaluate the productivity of oil producers.
Introduction
With the development of oil and gas resources, many reservoirs with tight composition become the main target for further exploitation of oil companies. In fact, the oil and gas reserve in low permeability reservoirs occupies a great proportion for that of the total world and there is still great potential for enhanced oil and gas production in this field. Wang et al. (2007) selected three indexes as reservoir permeability, initial pressure and burial depth to subdivide low permeability reservoirs into six main types. The idea of improving the development status of low permeability reservoirs is put forward, and the effective technical means to further improve the development efficiency of reservoirs are pointed out. Hu et al. (2018) proposed five sets of development theories for low permeability reservoirs based on the research on developed low permeability reservoirs in China, summarized the key technologies for the development of low permeability reservoirs, and pointed out the direction for the sustainable development of low permeability reservoir. Cao et al. (2006) analyzed the characteristics of low permeability reservoirs, introduced the situation and examples of gas injection to enhance oil recovery in low permeability reservoirs in the world, and finally put forward good suggestions for the development of gas injection projects in low permeability reservoirs in China. According to the characteristics of ultra-low permeability reservoirs, Li et al. (2008) proposed corresponding development ideas, which achieved good results in the pilot development test of Xifeng Oilfield and broadened the ideas of oil and gas development in Ordos Basin. Based on the analysis of low permeability core from the periphery of Daqing oilfield, Zhao et al. (2009) formed the understanding of the development mechanism and law of low permeability reservoirs, and gave the ideas and suggestions for effective development and utilization of such reservoirs. As one measure to know about the formation characteristics, core analysis plays an important role in the whole life time of reservoir for different purposes. In order to realize accurate evaluation of shale gas exploration and development prospects, Wang et al. (2020) confirmed the influencing factors of analysis results of shale core samples based on a large number of core data, and then proposed that a set of systematic and standardized tight rock analysis process and universally applicable experimental methods should be established in the shale oil and gas industry. Based on the basic data of core analysis and so on, Chen et al. (2019) summarized the analysis methods of oil and gas reservoir geological origin and pointed out the future development direction of this research. Considering the significant differences of shale gas reservoirs, Chen and Jin (2012) proposed that laboratory core experiments should be carried out before fracturing of new shale gas wells. According to the results of core analysis, the characteristics of the gas reservoir can be understood, the fracturing process parameters can be optimized, and the pertinence of the development strategy can be improved. Porosity and permeability are the basic characteristics of reservoir formation and they are usually tested at ordinary conditions without special pressure exerted on the test core (He et al., 2010). However, under formation conditions, the pressure exerted on reservoir rock is not the same as that in ordinary testing environments. With the development of reservoir, this pressure will also change with time. Scholars have conducted many research concerning the characteristics of porosity and permeability under overburden pressure conditions and lots of conclusions have been obtained to guide the development of oil and gas reservoir. By measuring the porosity of the core under multiple confining pressures, Zhang et al. (2022) gives a correction method for converting triaxial porosity into uniaxial porosity. Taking Chang 7 tight sandstone reservoir in Ordos Basin as an example, Zhan et al.(2015) studied the change law of formation porosity and permeability with net overburden pressure, which can provide a basis for oilfield exploration and development. Luo et al.(2007) proposed a new method to define the stress sensitivity coefficient, and obtained the relationship between the stress sensitivity coefficient and the initial permeability through indoor physical simulation experiments. This study lays a foundation for establishing numerical simulation of low permeability reservoir. Gao et al. (2016) established a permeability calculation model under a space coordinate system, equalized the seepage law inside the rock to a permeability model in the orthogonal direction of the space, and quantitatively described the change law of permeability anisotropy of the specimen during the overburden test. Chen et al. (2016) established the dimensionless power relationship between permeability and effective overburden pressure by analyzing and comparing the experimental data of overburden pressure porosity and permeability, and achieved the purpose of optimizing the calculation model of logging permeability. Luo et al. (2009) used a variety of experimental methods to analyze the deformation characteristics of low permeability reservoir rock overburden pressure, and defined a new rock stress sensitivity coefficient to express the relationship between permeability and effective overburden pressure, which has certain application value on site. Wang et al. (2017) analyzed the experimental data of shale core and established the calibration model by using mathematical analysis method. The study can provide technical support for full diameter correction, overburden pressure correction and reserve parameter study of shale reservoir. Xue (2005) studied the change relationship of reservoir rock permeability, porosity and pore volume compressibility with net overburden pressure, gave the regression expression between them, and conducted mechanism analysis from the aspects of rock pore characteristics and skeleton characteristics. Taking Chang 8 tight sandstone reservoir in Ordos Basin as an example, Bai et al. established a mathematical model of the relationship between overburden pressure physical properties and normal pressure physical properties, and finally compared it with the logging interpretation model to verify the effectiveness of the model (Bai et al., 2020). Wang et al. (2020) used CMS-300 overburden pressure test system, cast thin section, scanning electron microscope, and other means to clarify the relationship between porosity and permeability of tight core and overburden pressure under formation conditions, which can provide a basis for tight oil reserve evaluation in Longdong area of China. Gao and He (2008) took the second section of Shahejie Formation in Shengtuo Oilfield as the research object, and successfully obtained the relationship between interlayer distribution and remaining oil distribution by carrying out random modeling research on interlayer distribution. All these studies concentrated on only some aspect of reservoir rock characterization.
The exploitation of tight oil resources is largely influenced by the characteristics of formation rocks. Li et al. established a stress-sensitive numerical model considering both matrix and multi-scale fracture heterogeneity in view of the characteristics of fractured tight reservoirs such as strong heterogeneity and strong stress sensitivity. The calculation results can provide a basis for rational production allocation and development plan optimization of tight fractured reservoirs (Hong et al., 2022). Yin and Liu et (2022) analyzed the influencing factors of stress sensitivity of tight sandstone reservoir by taking the rock samples of Jiyang Depression in Bohai Bay Basin as an example, and clarified the relationship between different effective stresses and rock permeability, which provided support for efficient and comprehensive development of tight reservoirs. Gao et al. (2022) carried out the permeability stress sensitivity experiment by using the rocks of the tight gas reservoir of H group in some basin, analyzed the field productivity by using the experimental results, and put forward suggestions for determining the reasonable production pressure difference in the process of tight oil exploitation. Gao et al. (2021) took the shale oil reservoir of Chang 7 layer in Ordos Basin as the research object, considered the stress sensitivity characteristics of the reservoir, obtained the permeability change law under the action of stress sensitivity, and optimized the reasonable working system of shale oil horizontal wells by using numerical simulation and other methods. Taking the sensitivity of tight oil reservoir to formation pressure into consideration, this study deals with the comprehensive characterization of tight oil formation rock in the Northwest part of China. In order to get a visual impression of the reservoir core, some routine tests such as scanning electron microscope, cathode luminescence, and mercury intrusion test were firstly carried out. After that, porosity and permeability of rock sample are tested under overburden pressure conditions. The test instruments, test preparation, test procedure and so on are described in detail. Finally, the test results concerning the change law of porosity and permeability under overburden conditions are thoroughly analyzed. This study can be of great significance to accurately evaluate the reservoir damage in the process of tight oil development and reasonably calculate the productivity of oil producers.
General test
The target formation in this research is in the Northwest part of China and its sedimentary environment is the leading edge of delta. The average porosity is of 16.2% and the average permeability is of 0.9 × 10⁻³μm2.
Analysis by scanning electron microscope
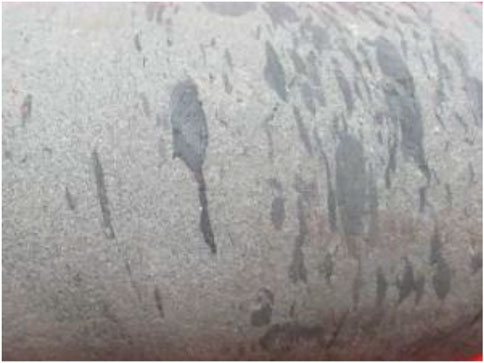
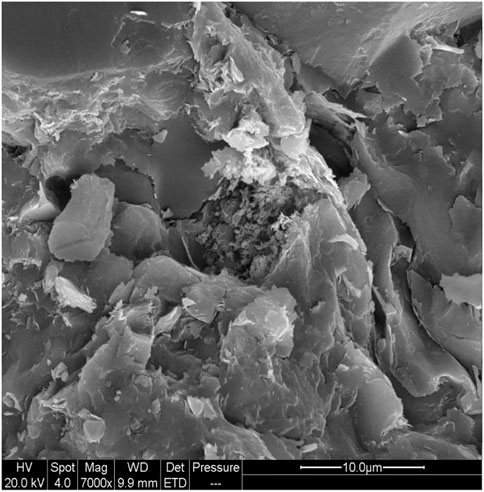
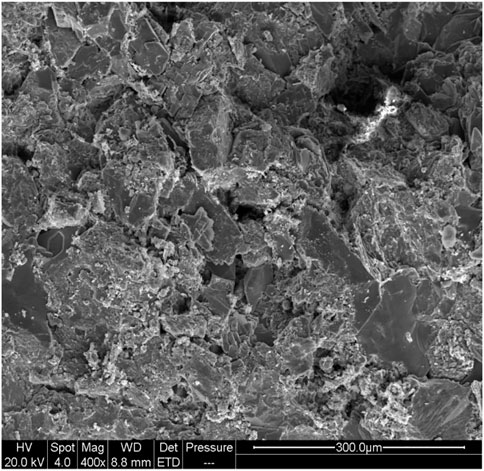
The reservoir rock is mainly sandstone and particles of the rock are in thin manner. The real photo of core sample is as shown in Figure 1. Through wettability test experiment, its water wettability index is tested as 0.24 and its oil wettability index is tested as 0.17, so it is identified as weakly water-wet type. The pores in the rock are mainly inter-particle type and mica is largely developed as the interstitial matter. Through analysis by scanning electron microscope, results are as shown in Figure 2 and Figure 3.
From Figure 2, it is demonstrated that mica is mainly developed as the agglutinate in the rock. Actually, the sample is mainly composed of quartz, feldspar and rock debris. The matrix is mainly illite; the cement is mainly secondary quartz; the cementation type is mainly siliceous cementation; the lithology is dense and the weathering degree is weak; the particle size is between 30 and 500 μm, with point contact, good sorting and roundness. From Figure 3, it is clear that the pore in the rock is mainly of the inter-particle type, and there is also feldspar dissolution pores in the sample.
Minerals identification by cathode luminescence
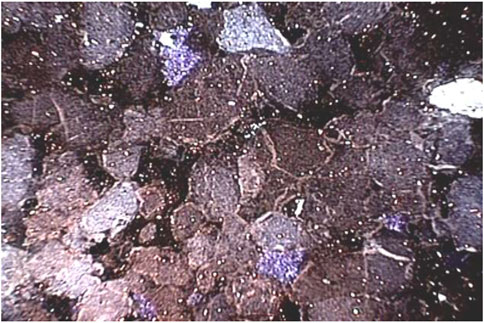
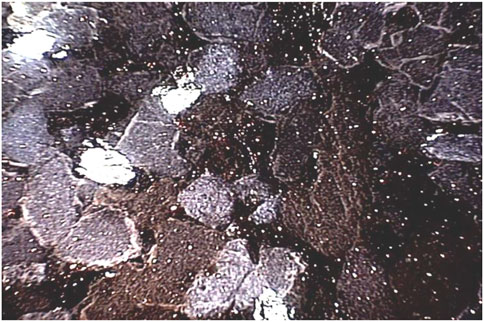
The minerals in the rock are also identified by cathode luminescence method. This test is conducted under the standard SY/T 5916-2013 of China and pictures are as shown in figures below.
From Figure 4 and Figure 5, analysis results are demonstrated clearly. Quartz will show a brown or blue light under testing conditions and the light is generally not very strong. Feldspar will show a strong blue light under testing conditions and alteration is generally common. Kaolinite agglutination is relatively scattered and will show an indigo blue light.
Pore-throat structure identification by mercury injection test
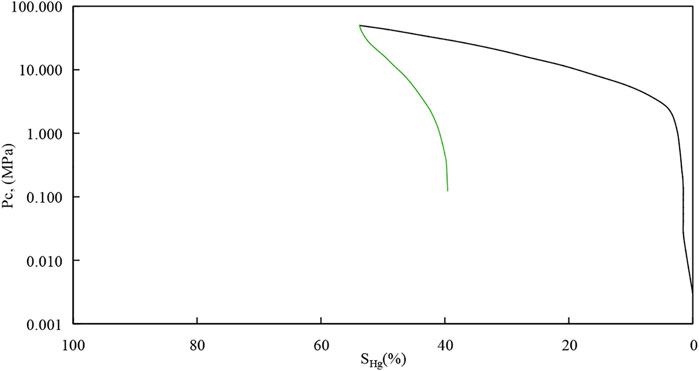
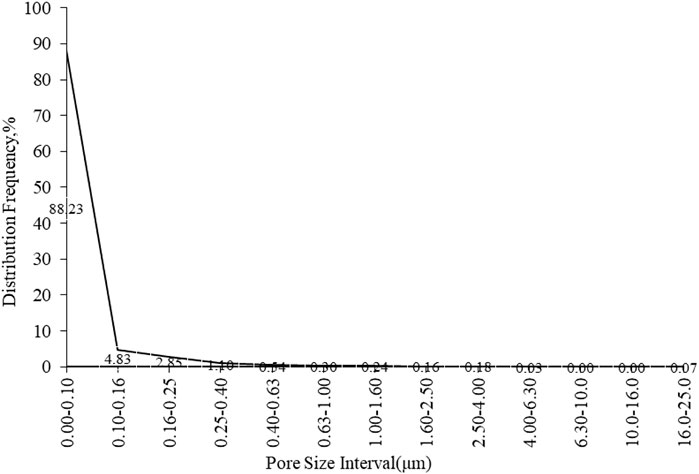
Mercury injection test is also conducted with experiment AutoPore IV 9510 to explore the pore-throat structure of formation core. Intrusive mercury curve is firstly obtained as Figure 6. From Figure 6, as for the saturation, it is demonstrated that the maximum intrusive mercury saturation can reach only around 54%. In the mercury withdraw curve, it is clear that the mercury saturation can reach around 40%. The difference between the two values is relatively small. As for the capillary pressure, the highest value in the mercury injection process can reach about 50 MPa. These pressures at different test points can also be used to calculate the pore-throat diameters of rock sample (Li, 2015), the calculated data are demonstrated as Figure 7. From Figure 7, it is shown that the pore-throat diameters range from 0 to around 25 μm. Furthermore, the distribution frequency is the highest for pore-throats with diameter below 0.1 μm. The distribution frequency can reach around 97% for pore-throats with diameter below 0.4 μm. The biggest diameter range of pore-throats are between 16 and 25 μm, and its distribution frequency is around 7%. These results clearly show that the diameters of pore-throats in the formation rock are very small, which directly lead to the low productivity of reservoir formation.
Experiments under overburden pressure
For tight oil reservoir, its formation characteristics are greatly influenced by the overburden pressures. Overburden pressure refers to the pressure exerted onto the bottom rock by the overlying rock. Pore pressure refers to the fluid pressure borne by the formation pore, and it is also called formation pressure. Net effective overburden pressure refers to the difference between the overburden pressure and the pore pressure. Overburden pressure can be exerted onto the core sample by using the hydro-static pressure in the laboratory, and in this way, the stresses received by the core will be the same in all directions. Generally, the pore pressure will remain the same, and the overburden pressure will be increased to test porosity and permeability at different conditions. In this experiment, the test gas used is the industrial grade helium.
Test instruments
The instruments used in the experiment mainly include four aspects: The first is the porosity and permeability test instrument CMS-300 which can modeling the condition under overburden conditions, and its working pressure is not less than 50 MPa with precision of its pressure transducer as ±0.1%; The second is the helium porosity test instrument, and its helium injection pressure is between 0.70 and −1.50 MPa with precision of its pressure transducer as ±0.1%; The third is the barometer with grade 0.4; The fourth is the vernier caliper with division value 0.02 mm.
Test preparation
(1) Prepare the core sample as a cylinder based on the dimension of the core holding unit. The ratio between the core length and the core diameter is no less than 1.0. Ensure the two side surfaces are parallel and are perpendicular to the axes of the core.
(2) Put the core sample into the core holding unit. Pressurize the solvent under room temperature conditions, so that the solvent can enter into the core and finally make the core clean with no hydrocarbons and salts in it.
(3) In view of the low clay content in the core sample, vacuum oven is used for sample drying and the temperature is set as 90°C.
(4) Based on the formation data obtained before, the pore pressure is set the same as formation pressure. The highest overburden pressure is obtained by multiplying the formation pressure gradient with the formation depth. The highest effective overburden pressure is the difference between the highest overburden pressure and the pore pressure.
Test procedure
(1) Switch on to preheat the instrument, and calibrate (if necessary) the pressure system and the reference system before the experiment starts.
(2) Based on the requirements in standard GB/T 29172-2012 of China, test the porosity and permeability under normal pressure.
(3) Put the core sample into the core holding unit, exert 5.0 MPa onto the core as the initial pressure.
(4) Gradually increase the overburden pressure, and test the porosity and permeability under different pressures as the pressures are kept steady. Stop this process until the overburden pressure reaches the highest point and totally at least five pressure points should be tested and recorded in this process.
(5) After the experiment is finished, take out the core and switch off the gas and the electricity. Make necessary dust abatement and protection for the test instruments.
Porosity measurement under overburden pressure
Porosity refers to the ratio between the pore volume and the total volume of the rock. The volume involved for porosity test includes total volume, particle volume and pore volume of the rock. If only two of the three volumes are obtained, the porosity can be calculated accordingly. Actually, under overburden pressure conditions, the total volume, particle volume and pore volume will all change. Among them, the volume of particle is thought to only have little change. On the basis of ignorance of particle volume change, porosity can be obtained by testing the total volume and pore volume of core samples.
Since the core sample is in the form of cylinder, based on Eq. 1 below, its volume can be calculated by using its length and diameter which are tested by vernier caliper:
In Eq. 1,
V refers to the total volume of core sample, and its unit is cm3;
d refers to the diameter of core sample, and its unit is cm;
l refers to the length of core sample, and its unit is cm.
Concerning the pore volume of core sample at different overburden pressures, it can be tested and calculated by using the Boyle’s law. The core sample will be connected to a pressure vessel which is filled with gas. The pressures of vessel gas can be tested before and after the connection with core sample. The pore volume of core sample can be calculated by using the formula below:
In Eq. 2,p1 refers to the initial pressure of pressure vessel full of gas, and the unit is MPa; p2 refers to the pressure after the vessel is connected with the pore of core sample, and the unit is MPa; V1 refers to the volume of pressure vessel, and the unit is cm3; Vp refers to the pore volume of core sample, and the unit is cm3.
Concerning the calculation of porosity, it can be calculated as Eq. 3 below. The total volume of core sample will decrease with the increasing overburden pressure, and this has to be considered in the calculation process.
In Eq. 3,
Permeability measurement under overburden pressure
The methods for gas permeability testing include steady-state method and unsteady-state method. Steady-state method is based on Darcy’s law, that is, the fluid volume rate flowing through unit cross-sectional area is directly proportional to the gradient of potential energy and inversely proportional to the fluid viscosity. Unsteady-state method adopts the technique of “pressure decrease”, that is, the permeability is calculated based on the attenuation law of pore pressure with time.
In this experiment, steady state method is used for testing of permeability, and the corresponding formula is as below:
In Eq. 4,Kg refers to the gas permeability tested, and its unit is mD;p0 refers to the atmospheric pressure, and its unit is MPa;p1 refers to the pressure at inlet of core sample, and its unit is MPa;p2 refers to the pressure at outlet of core sample, and its unit is MPa;Q0 refers to the volume flow rate under atmospheric pressure, and its unit is cm3/s;
Results and discussion
Based on work above, test data are obtained and they are illustrated in figures below.
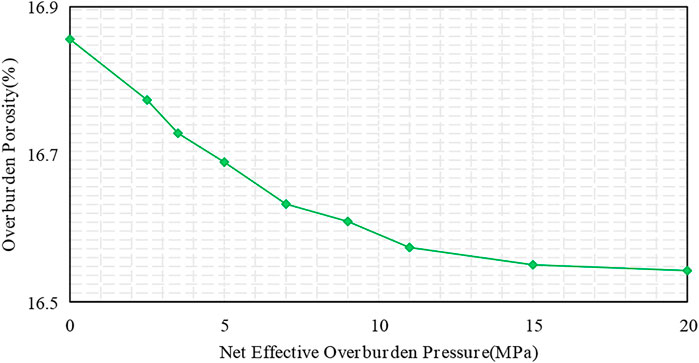
Figure 8 refers to the relationship between overburden porosity and net effective overburden pressure. It can be seen that the porosity is 16.9% when net effective overburden pressure is 0 MPa. Then, the porosity will decrease with the increasing of net effective overburden pressure. When the net effective overburden pressure increases to 20 MPa, the porosity decreases to 16.5%.
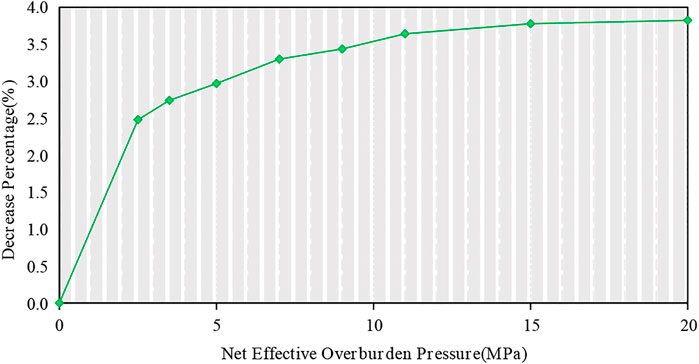
In order to see the decrease trend in more detail, Figure 9 is drawn concerning the decrease percentage of overburden porosity with net effective overburden pressure. Decrease percentage refers to the ratio of porosity difference to porosity at zero effective overburden pressure. The porosity difference refers to the difference of porosity at different effective overburden pressures with the porosity at zero effective overburden pressure.
From Figure 9, it is clear that the decrease percentage increases with the increase of net effective overburden pressure. The percentage is about 3.8% when the net effective overburden pressure reaches 20 MPa. Generally, when the net effective overburden pressure is lower than 10 MPa, the increasing speed is relatively high; when the net effective overburden pressure is larger than 10 MPa, the increasing speed becomes relatively low.
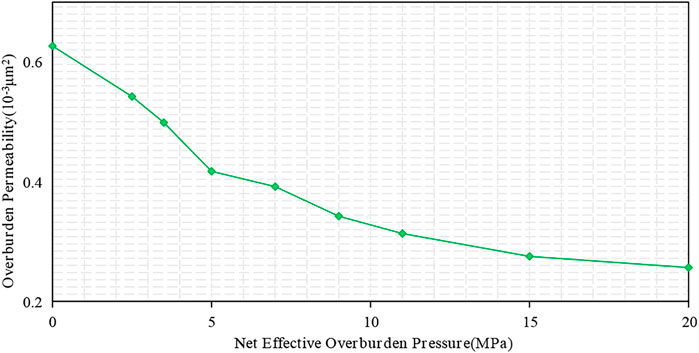
Figure 10 is about the relationship between overburden permeability and net effective overburden pressure. It can be seen that the permeability is 0.63 × 10⁻³ μm2 when net effective overburden pressure is 0 MPa. Then, the permeability will decrease with the increase of net effective overburden pressure. When the net effective overburden pressure increases to 20 MPa, the permeability decreases to 0.26 × 10⁻³ μm2.
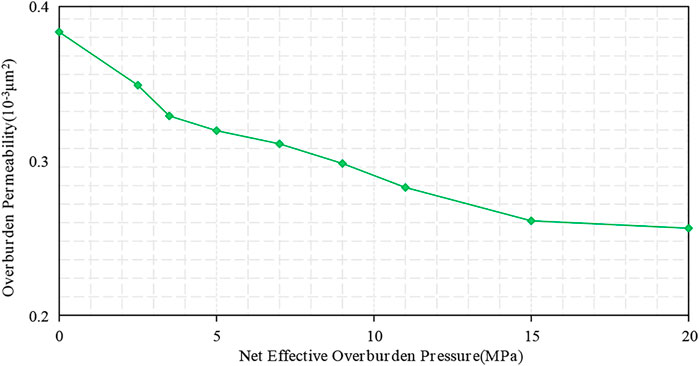
Figure 11 is also about the relationship between overburden permeability and net effective overburden pressure. However, this process is actually conducted continuously at the end of that in Figure 10, and the overburden pressure starts to gradually recover from 20 to 0 MPa. From the curve in Figure 11, it is clear that the permeability will increase with the decrease of net effective overburden pressure. When the net effective overburden pressure decreases to 0 MPa, the permeability increases to 0.38 × 10⁻³ μm2.
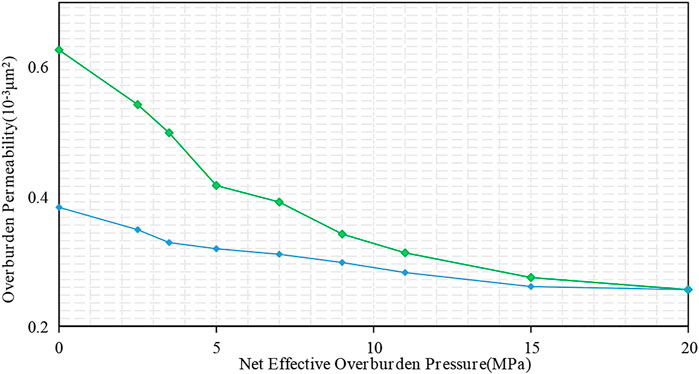
In order to make the whole process easier to understand, curves are drawn on the same figure as Figure 12. From the figure, it is obvious that the permeability is not the same even at same overburden pressures. In the overburden pressure increasing process, the permeability decreases greatly. In the decreasing process of overburden pressure, the permeability increases only at a relatively low speed level concerning the speed level in the previous round. This means that the permeability cannot recover to the initial level when overburden pressure has been removed and the permeability is permanently diminished in the process.
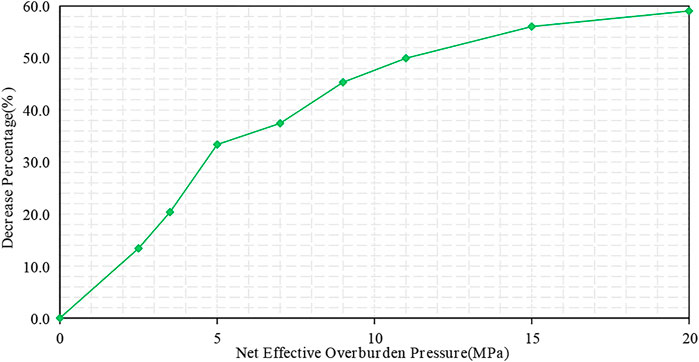
In order to see the decrease trend in more detail, Figure 13 is drawn concerning the decrease percentage of overburden permeability with net effective overburden pressure. Decrease percentage refers to the ratio of permeability difference to permeability at zero effective overburden pressure. The permeability difference refers to the difference between permeability at different net effective overburden pressures and the permeability at zero net effective overburden pressure.
From Figure 13, it is clear that the decrease percentage increases with the increase of net effective overburden pressure. The percentage is about 59% when the net effective overburden pressure reaches 20 MPa. This is much higher compared with that of porosity decrease percentage under overburden pressures. Generally, when the net effective overburden pressure is smaller than 15 MPa, the increasing speed is relatively high; when the net effective overburden pressure is larger than 15 MPa, the increasing speed becomes relatively low.
Overburden permeability change in both the pressure-increasing process and the pressure-decreasing process are also studied in detail. Figure 14 illustrates the relationship between the decrease percentage of overburden permeability and the net effective overburden pressure. Decrease percentage here refers to the ratio of permeability difference to permeability at corresponding (the same) net effective overburden pressure in the pressure-increasing process when the permeability is relatively high. The permeability difference refers to the difference between permeabilities at the same net effective overburden pressure in the two processes.
From Figure 14, it is clear that the decrease percentage decreases with the increase of net effective overburden pressure. This means that the permeability damaged percentage during the pressurizing process is in a decreasing manner when the net effective overburden pressure increases. In other words, when the net effective overburden pressure is in a high level, the permeability damaged is relatively small. The largest percentage is about 39% when the net effective overburden pressure recovers at 0 MPa. This is also much higher compared with that of porosity decrease percentage under overburden pressures. However, this is relatively lower than that illustrated in Figure 9. Generally, the decreasing speed is in a relatively steady level during the whole process.
Conclusion
Unconventional oil and gas mainly include tight oil and gas and shale oil and gas. Shale gas has become a hot spot in the exploration and development of unconventional natural gas in the world, and the related research on tight oil is also rising. Due to the complex geological conditions and deep burial depth of tight oil in China, a series of new scientific and technological problems have arisen. For example, the seepage mechanism and exploitation theory of tight oil are not clear, so it is impossible to form industrial productivity and efficient development in a wider area. Therefore, it is very urgent to carry out related reservoir formation research, and this research is definitely of important scientific value and practical engineering significance. This paper actually started from the view of reservoir sensitivity analysis, and it first introduced the conventional test results of scanning electron microscope, cathode luminescence and mercury injection, which produced intuitive understanding of the reservoir core. Then, the test details of overburden permeability and overburden porosity are introduced, and a series of results are obtained. The results show that:
Overburden porosity will decrease but total decrease percentage will increase with the increase of net effective overburden pressure. As for the target tight oil formation, when the net effective overburden pressure is larger than 10 MPa, the decrease will become relatively small. Overburden permeability will decrease but total decrease percentage will increase with the increase of net effective overburden pressure. As for the target tight oil formation, when the net effective overburden pressure is larger than 15 MPa, the decrease will become relatively small. The decrease percentage of permeability is much higher compared with that of porosity decrease percentage under overburden pressures. Overburden permeability change in both the pressure-increasing process and the pressure-decreasing process are all studied: the permeability cannot recover to the initial level when overburden pressure is the same as previous round and some permeability is permanently diminished in the process. The permeability damaged percentage during the pressurizing process is in a decreasing manner when the net effective overburden pressure increases. In other words, when the net effective overburden pressure is in a high level, the permeability damaged is relatively small.
In all, this study mainly deals with the characertistics of tight oil formation, which can provide good reference for dynamic analysis, productivity evaluation and later adjustment of potential stimulation measures in tight oil development.
Data availability statement
The original contributions presented in the study are included in the article/supplementary material, further inquiries can be directed to the corresponding authors.
Author contributions
HK, XZ, and CZ contributed to the conception and design of the study. JG conducted the experiments and wrote the first draft of the manuscript.
Funding
This work was supported by Open Fund of State Key Laboratory of Enhanced Oil Recovery, CNPC (Grant no: 2022-KFKT-29), by Science and Technology Project of Hebei Education Department (Grant no: QN2018158) and by Science and Technology Fund of Hebei Normal University (Grant no: L2017B21).
Acknowledgments
The authors acknowledge the contributions of Hebei Normal University, State Key Laboratory of Enhanced Oil Recovery and Research Institute of Petroleum Exploration and Development, CNPC that aided the efforts of the authors.
Conflict of interest
XZ and JG were employed by the company State Key Laboratory of Enhanced Oil Recovery, CNPC and XZ and JG were employed by the comany Research Institute of Petroleum Exploration and Development, CNPC.
The remaining authors declare that the research was conducted in the absence of any commercial or financial relationships that could be construed as a potential conflict of interest.
Publisher’s note
All claims expressed in this article are solely those of the authors and do not necessarily represent those of their affiliated organizations, or those of the publisher, the editors and the reviewers. Any product that may be evaluated in this article, or claim that may be made by its manufacturer, is not guaranteed or endorsed by the publisher.
References
Bai, Y., Jing, C., Yun, Y., Tian, F., Kang, S., and Xie, X. (2020). Physical logging interpretation model for tight sandstone reservoirs in southern Ordos Basin —Taking chang-8 tight reservoir in yanchang formation, southern Ordos Basin as an example. Unconv. Oil Gas 7 (3), 24–30. doi:10.3969/j.issn.2095-8471.2020.03.004
Cao, X., Guo, P., Yang, X., and Li, S. (2006). An analysis of prospect of EOR by gas injection in low-permeability oil reservoir. Nat. Gas. Ind. 26 (3), 100–102. doi:10.3321/j.issn:1000-0976.2006.03.033
Chen, M., and Jin, Y. (2012). Shale gas fracturing technology parameters optimization based on core analysis. Pet. Drill. Tech. 40 (4), 7–12. doi:10.3969/j.issn.1001-0890.2012.04.002
Chen, J., Like, S., Wang, X., and Hu, H. (2016). [Expression of midkine and microvessel density in salivary adenoid cystic carcinoma]. Fault-Block Oil Gas Field 23 (2), 189–193. doi:10.6056/dkyqt201602012
Chen, H., Hu, H., and Wu, H. (2019). Geological genetic analysis of oil and gas reservoir development. Chin. J. Geol. 54 (1), 192–212. doi:10.12017/dzkx.2019.012
Gao, W., and He, S. (2008). The influence of formation pressure change of DINA 2 reservoirs in permeability. J. Southwest Pet. Univ. Sci. Technol. Ed. 30 (4), 86–88. doi:10.3863/j.issn.1000-2634.2008.04.021
Gao, C., Xie, L. Z., Xiong, L., and Wang, Y. S. (2016). Analysis of direction-dependent characteristics of permeability of sandstone with ultra-lowly permeability in confining pressure tests. Rock Soil Mech. 37 (4), 948–956. doi:10.16285/j.rsm.2016.04.006
Gao, Z., Qu, X., Huang, T., Xue, T., and Cao, P. (2021). Stress sensitivity analysis and optimization of horizontal well flowback system for shale oil reservoir in Ordos Basin. Nat. Gas. Geosci. 32 (12), 1867–1873. doi:10.11764/j.issn.1672-1926.2021.10.018
Gao, H., Shan, L., and Liu, C. (2022). Application of digital core technology in the study of tight gas stress sensitivity. Petrochem. Ind. Appl. 41 (1), 89–94. doi:10.3969/j.issn.1673-5285.2022.01.019
He, Z.-b., Wang, Z.-h., Zhang, J., Qin, F.-l., Li, F.-q., Du, S.-y., et al. (2010). A method of productivity evaluation in low porosity and low permeability reservoirs—by taking weicheng oilfield in dongpu depression for example. J. Oil Gas Technol. 32 (6), 81–86. doi:10.3969/j.issn.1000-9752.2010.06.018
Hong, L., Yu, H., Yang, H., Deng, H., Xu, L., and Wu, Y. (2022). Adaptive stress sensitivity study of fractured heterogeneous tight reservoir. Pet. Drill. Tech. 50 (3), 99–105. doi:10.11911/syztjs.2022054
Hu, W., Yi, W., and Bao, J. (2018). Development of the theory and technology for low permeability reservoirs in China. Pet. Explor. Dev. 45 (4), 685–697. doi:10.1016/s1876-3804(18)30072-7
Li, S.-h., Zhao, J.-y., Cui, P.-f., Yang, J.-l., and Chen, W.-l. (2008). Strategies of development technology for ultra-low permeability reservoir. Lithol. Reserv. 20 (3), 128–131. doi:10.3969/j.issn.1673-8926.2008.03.026
Li, A. (2015). Physical properties of Petroleum reservoir. 3rd edition. Qingdao, China: China University of Petroleum Press.
Luo, R.-l., Cheng, L.-s., Peng, J.-c., and Zhu, H.-y. (2007). A new method of determining relationship between permeability and effective overburden pressure for low-permeability reservoirs. J. China Univ. Pet. Ed. Nat. Sci. 31 (2), 87–90. doi:10.3321/j.issn:1000-5870.2007.02.018
Luo, R.-l., Cheng, L.-s., Li, X.-Z., Zhu, H.-y., and Wan, Y.-j. (2009). The deformation characteristics of low permeability reservoir rocks under confining pressure. Nat. Gas. Ind. 29 (9), 46–49. doi:10.3787/j.issn.1000-0976.2009.09.012
Wang, G., Liao, F., and Li, J. (2007). The development situation and future of low permeability oil reservoirs of SINOPEC. Petroleum Geol. Recovery Effic. 14 (3), 84–89. doi:10.3969/j.issn.1009-9603.2007.03.025
Wang, K., Yan, W., Feng, M.-g., Wang, J.-b., and Wang, Y. (2017). A correction research for full diameter and overburden pressure of shale-reservoir: A case from wufeng and longmaxi formations in jiaoshiba shale gas field. Sci. Technol. Eng. 17 (21), 228–232. doi:10.3969/j.issn.1671-1815.2017.21.036
Wang, N., Si, S., Song, P., Yeng, H., Wang, X., and Wang, H. (2020). Variation of overburden pore and permeability of tight core Chang 7 in area X233 of Longdong region. J. Qinghai Univ. Nat. Sci. 38 (2), 96–102. doi:10.13901/j.cnki.qhwxxbzk.2020.02.014
Wang, S. (2020). Correlation of shale core analysis results and its influencing factors. Nat. Gas. Ind. 40 (1), 160–174. doi:10.3787/j.issn.1000-0976.2020.01.021
Xue, Q. (2005). Investigation on characteristics of physical parameters under formation overburden pressure. Pet. Geol. Recovery Effic. 12 (6), 43–45. doi:10.3969/j.issn.1009-9603.2005.06.014
Yin, D., and Liu, D. (2022). Experimental study on influence of pressure sensitive effect on seepage in tight fractured reservoirs. Contemp. Chem. Ind. 51 (4), 815–819. doi:10.3969/j.issn.1671-0460.2022.04.014
Zhan, S., Qi, L., Zhang, Y., Li, L., and Zhao, Z. (2015). Changes in porosity and permeability with net overburden pressure in tight sandstone reservoirs. Complex Hydrocarb. Reserv. 8 (2), 52–56. doi:10.16181/j.cnki.fzyqc.2015.02.012
Zhang, L., Wang, M., Shan, G., and Pan, B. (2022). Experiment study on overburden porosity and permeability of volcanic rocks in Changling fault depression and its correction method. Glob. Geol. 41 (1), 147–152. doi:10.3969/j.issn.1004-5589.2022.01.013
Keywords: low permeability, overburden pressure, laboratory test, porosity test, core analysis
Citation: Kang H, Zhou X, Gao J and Zhang C (2022) Comprehensive characterization of formation rock for tight oil exploitation. Front. Energy Res. 10:986726. doi: 10.3389/fenrg.2022.986726
Received: 06 July 2022; Accepted: 10 August 2022;
Published: 29 August 2022.
Edited by:
Fei Wang, Qingdao University of Science and Technology, ChinaCopyright © 2022 Kang, Zhou, Gao and Zhang. This is an open-access article distributed under the terms of the Creative Commons Attribution License (CC BY). The use, distribution or reproduction in other forums is permitted, provided the original author(s) and the copyright owner(s) are credited and that the original publication in this journal is cited, in accordance with accepted academic practice. No use, distribution or reproduction is permitted which does not comply with these terms.
*Correspondence: Hao Kang, aGFva2FuZ0Bob3RtYWlsLmNvbQ==; Jian Gao, Z2FvamlhbmVvckAxMjYuY29t
 Hao Kang
 Xinyu Zhou3,4