 Yang Hu
 Ye Tang
94% of researchers rate our articles as excellent or good
Learn more about the work of our research integrity team to safeguard the quality of each article we publish.
Find out more
ORIGINAL RESEARCH article
Front. Energy Res., 14 November 2022
Sec. Carbon Capture, Utilization and Storage
Volume 10 - 2022 | https://doi.org/10.3389/fenrg.2022.986646
This article is part of the Research TopicRising Stars in Carbon Capture, Utilization and Storage: 2022View all 6 articles
Because of the coupling of CO2 absorption and treatment, conventional carbon capture power plants lack the flexibility of power plant operation. This paper provides a liquid storage carbon capture power plant (LSCCPP) with solution storage, analyzes the “energy time-shift” features of the solution storage, and creates a joint operating model of the LSCCPP and Power to Gas(P2G) based on this. Taking into account the carbon market trading mechanism, this paper develops a low-carbon economic dispatch model for an integrated electric-gas energy system with the LSCCPP, with the goal of achieving the lowest overall system cost. Moreover, the proposed dispatch model is solved by transforming the model into a mixed-integer linear programing problem and calling CPLEX. Finally, a modified example system is used to demonstrate the validity of the proposed model. The results show that the suggested low-carbon dispatch model has a significant reference for enhancing the system’s use of wind power and accomplishing the low-carbon efficient functioning of the integrated electric-gas energy system.
High-quality energy development has drawn attention worldwide due to the rising economic demand, population increase, and environmental strain. One of the most effective strategies to encourage the change of the energy structure is to take into account both the production and supply of energy in its entirety, as well as the benefits and synergistic effects of various energy sources (Liting et al., 2019; Su et al., 2021). In order to achieve the goals of collaborative optimization and operation complementarity, the Integrated Electricity-Natural Gas System (IEGS) integrates multiple energy structures, including traditional fossil energy, natural gas, and renewable energy. It is anticipated that this system will develop into a new development model for energy utilization (Cheng et al., 2017; Dong et al., 2020).
IEGS takes electricity as the main body, integrates various forms of energy such as natural gas, and uses P2G devices and gas turbines to realize the two-way flow of energy network and natural gas network (Leonzio, 2017; Zheng et al., 2019). P2G technology synthesizes methane from hydrogen and carbon dioxide through chemical reactions to promote wind power consumption; Gas turbines transform synthetic natural gas into electrical energy to supply electrical load, strengthening the coupling of the grid and natural gas network. Literature (Clegg and Mancarella, 2015) analyzed the workflow of P2G and evaluated the impact of P2G on power and natural gas networks. Literature (Jiang et al., 2022)proposed a two-stage robust collaborative scheduling model for the power-natural gas integrated energy system with P2G equipment, aiming to effectively deal with the uncertainty of wind power output. Literature (Wei et al., 2017) smoothed the net load curve of electric-gas interconnected integrated energy system by using the coordinated action of P2G and gas turbine to stabilize the load fluctuation. In the above studies, peak clipping and valley filling of P2G and wind power consumption were mainly considered, and the source of CO2 from P2G raw material was not studied.
At present, the carbon capture power plants transformed from coal-fired power plants by carbon capture technology have excellent CO2 supply channels and have received extensive attention (Hetti et al., 2020; Zhong et al., 2020). Therefore, some scholars proposed coupling Carbon Capture System (CCS) with P2G, using CCS to capture CO2 as the source of raw materials for P2G to synthesize methane, reducing the cost of CO2 raw materials for P2G, and converting CO2 captured by carbon capture power plants into economic benefits. Literature (Zhou et al., 2018; Zhang and Zhang, 2020)took the electric-gas-carbon capture power plant as a whole and formed the carbon cycle in the system to improve the level of carbon utilization. Literature (Sheng et al., 2019; Tian et al., 2020; Xu and Chen, 2022)introduced the carbon capture device into the electrical integrated energy system, and proved that the CO2 captured by the carbon capture device could effectively improve the operation efficiency of P2G and enhance the wind power consumption rate (Sun et al., 2021; Rong et al., 2022).coupled carbon capture power plants with a variety of energy forms through P2G to achieve coordinated scheduling of each unit and improve carbon utilization. In the above studies, carbon capture power plants without solution memory are mostly used, in which the absorption and treatment of CO2 are closely linked and coupled, resulting in insufficient level of wind power consumption and carbon utilization in the system.
Based on the above mentioned literature, this paper provides a liquid storage carbon capture system (LSCCS) and develops a low-carbon economic dispatch model for an integrated electric-gas energy system with the LSCCPP. Moreover, the model is solved by transforming the model into a mixed-integer linear programming problem and calling CPLEX. Finally, a modified example system is used to demonstrate the validity and reasonableness of the proposed model.
Considering that traditional coal-fired power plants generate high carbon emissions at the same time, carbon capture equipment is introduced into traditional coal-fired power plants and transformed into carbon capture power plants. The power balance relation of carbon capture power plant is:
Where
Where
Based on the carbon capture system, the liquid storage carbon capture system decouples the absorption and regeneration of the carbon capture system by introducing a set of lean and rich liquid memory between the absorption tower and the analytical tower. The schematic diagram of the liquid storage carbon capture system is shown in Figure 1. Where
Where
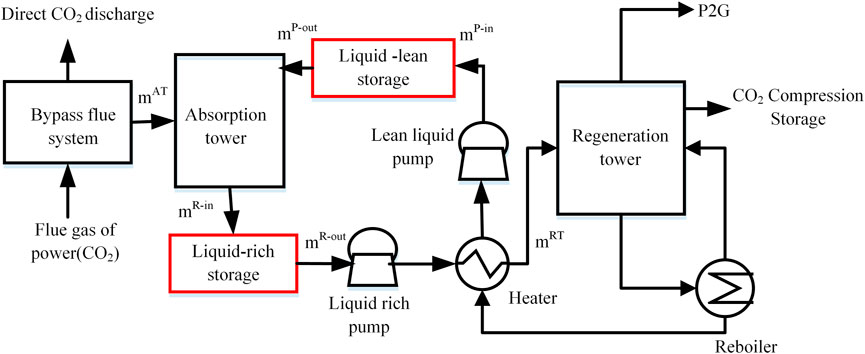
FIGURE 1. Main structure of LSCCS.
CO2 extracted from solution memory exists in the form of compounds in ethanolamine solution, the relationship between CO2 capture
Where
In the Figure 2, the flexibility of absorbing CO2 is limited by conventional carbon capture power plants. At peak load times, thermal power plants require higher net output power and produce more CO2. If they need to be fully absorbed for capture treatment, larger capture rates are required. Energy consumption and load conflict. If a solution storage is added, CO2 can be absorbed during this period, but no capture is required, that is, the capture energy consumption can be reduced during high-power operation, but carbon emissions can still be reduced. When the load is low and the thermal power plant is running at low power, increase the capture energy consumption to deal with excess CO2.
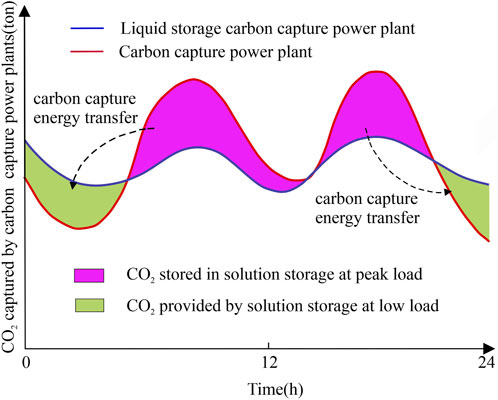
FIGURE 2. Schematic diagram of carbon capture transfer in LSCCS.
The liquid-storage carbon capture system is used to capture the CO2 generated in the power generation process of the unit to supply P2G, P2G uses chemical reactions to synthesize CO2 and H2 to supply CH4 to the natural gas network, forming a LSCCS-P2G joint operation system. The block diagram of LSCCS-P2G combined operation system is shown in Figure 3.
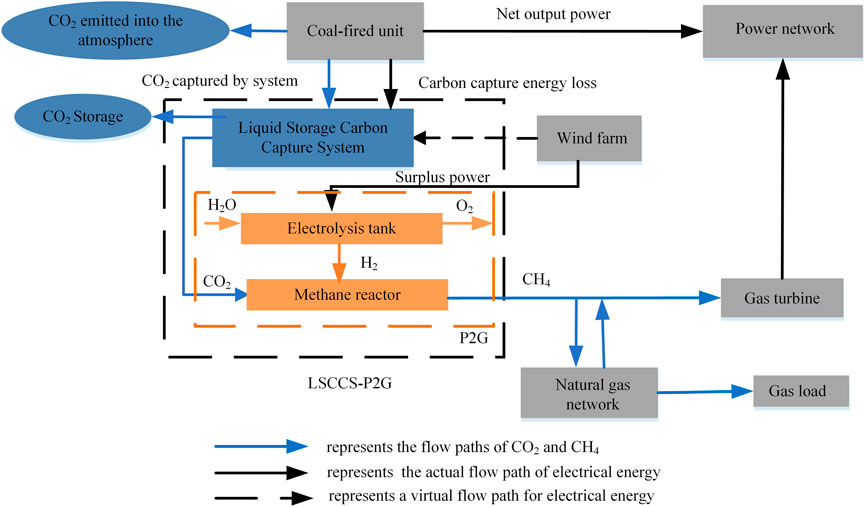
FIGURE 3. Block diagram of LSCCS-P2G combined operation system.
In Figure 3, P2G technology constitutes a bidirectional coupled power—gas integrated energy system in the power system, which is of great significance. The P2G equipment uses the CO2 captured by the LSCCS as the production raw material, which reduces the CO2 raw material cost of P2G, decreases the carbon emissions of coal-fired units and environmental pollution. In addition, when the wind power is abundant, P2G converts the wind power with zero marginal cost into natural gas to supply gas turbines and gas loads, which reduces the impact of renewable energy on the power grid and improves the stability of power system input. LSCCS uses lean and rich liquid storage to store part of CO2 in peak load period and increases CO2 processing capacity in low load period, which flexibly adjusts carbon capture energy consumption and changes unit net output. Under the demand of system peak shaving, the coordinated operation of the two significantly reduces the carbon emissions of the system and improves the flexibility of the system operation.
As an important coupling equipment in IEGS, P2G uses chemical reaction to synthesize natural gas from hydrogen and carbon dioxide. The specific reaction equation is as follows:
In this process, the relationship between the amount of CO2 that P2G can use in period t
Where
In order to achieve low carbon power, the economic operation of electric-gas integrated energy system needs to consider carbon emissions. Compared with the high carbon emissions of coal-fired units, the CO2 emissions of gas turbines are less and negligible. In order to mobilize the enthusiasm of power generation enterprises to reduce emissions, the cost of carbon emissions should be considered into total cost.
The carbon trading system treats carbon emissions as a freely traded good. The regulatory authorities divide up the overall amount of carbon emissions among the many carbon sources in order to limit it. If real carbon emissions from carbon sources exceed the allotted amount, the surplus must be purchased. On the other hand, the surplus can be sold in the market for carbon trading when the actual carbon emissions of carbon sources are lower than the carbon allotment (Wei et al., 2022). This carbon trading mechanism not only penalizes businesses with excessive carbon emissions, but it also inspires power producing businesses to conserve energy and cut emissions.
Under the carbon trading mechanism, economic penalties are imposed on carbon sources exceeding quotas in power plants. The cost of carbon emissions in power plants CT can be expressed as:
Where
Where
In the carbon capture system, the carbon storage cost
Where
Comprehensive carbon cost
In this paper, the minimum operating cost and carbon emission cost of electric-gas integrated energy system are taken as the optimization objectives.
Where
Where T indicates the total number of scheduling cycles, N indicates the total number of conventional thermal power units and carbon capture units;
Where r indicates the discount rate of carbon capture power plant project;
Where
Where
Where
Where
Where
Where
Where
Where
There is the following relationship between CO2 storage of lean and rich liquid memory at t time and CO2 storage at t-1 time.
Where
In order to ensure the long-term stable operation of the carbon capture system, the CO2 capacity of the rich-liquid and poor-liquid memories should be consistent at the beginning and end of each day, namely
Where
Where
Where
Where
Where
Where
Where
The power grid and the natural gas network are connected by P2G and gas turbine in this study, which adopts the enhanced IEEE 30 - bus power grid and the natural gas network with a single gas source point. Figure 4 depicts the combined electric-gas energy system. In this illustration, the thermal power plant G1 is converted into a liquid storage carbon capture power plant with a maximum energy consumption of 200 MW, a solution memory volume of 22,000 * 2 m3, an initial storage capacity of 11,000 m3, and a total cost of 11.7971 million dollars for the carbon capture equipment. The document contains the liquid storage carbon capture system’s parameters (Cui et al., 2021a; Chen et al., 2021). G2, a gas turbine, while G3, G4, and G5 are regular coal-fired units. Table 1 lists the necessary generator set specifications. Node 9 links 300 MW wind farms and 200 MW P2G units. The gas source point quotation is 4$/kcf, and the CO2 raw material cost factor for P2G is 20 $/MW; Maximum output of a gas source point is 15,000 m3/h, with a minimum production of 1,000 m3/h (Cui et al., 2021b); CO2 storage costs 4.89 ($/t), and the penalty cost of wind curtailment is 100/($/MWh). In order to run IEGS as efficiently as possible over a 24-h day, this study uses a 1-h scheduling window. Figure 5 displays the system’s predictions of the electric load, gas load, and wind power. The model is optimized by CPLEX.
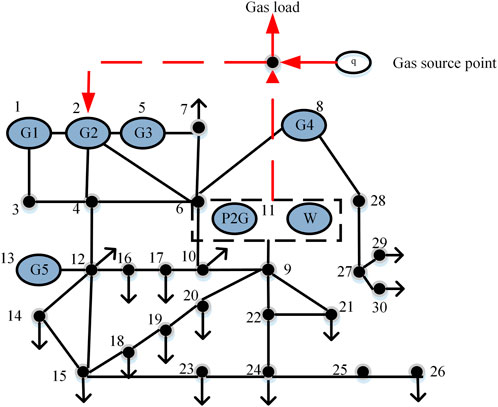
FIGURE 4. Schematic diagram of electric-gas integrated energy system.
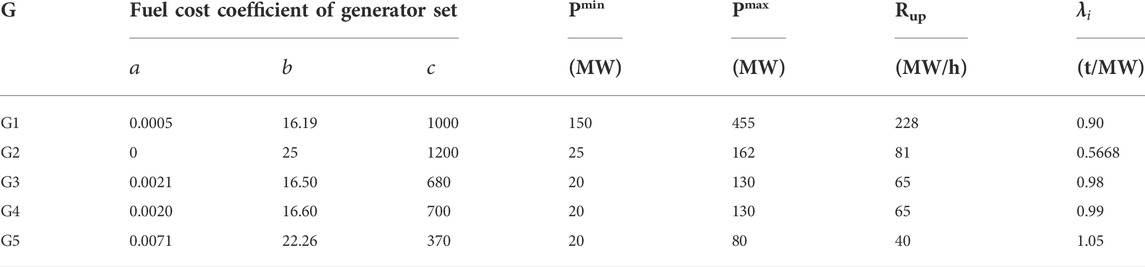
TABLE 1. Parameters of generator sets.
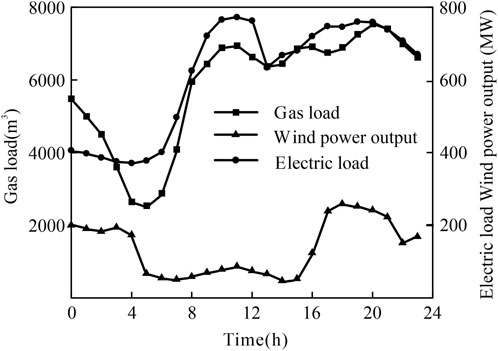
FIGURE 5. Electrical load and wind farm output cur.
In order to verify the effectiveness of the established model, four scenarios are set to calculate and analyze the economic operation cost and carbon emissions of the system.
Scenario 1: IEGS does not contain carbon capture devices, the objective function contains only the operating cost of the system;
Scenario 2: IEGS contains carbon capture devices, the objective function contains only the operating cost of the system;
Scenario 3: IEGS contains liquid storage carbon capture equipment, the objective function contains only the operating cost of the system;
Scenario 4: IEGS contains liquid storage carbon capture equipment and introduces carbon trading mechanism, the objective function contains the operating cost and carbon cost of the system;
In Scenario 1, the changes of system abandonment air volume and total system cost under different P2G capacities are analyzed, as shown in Figure 6.
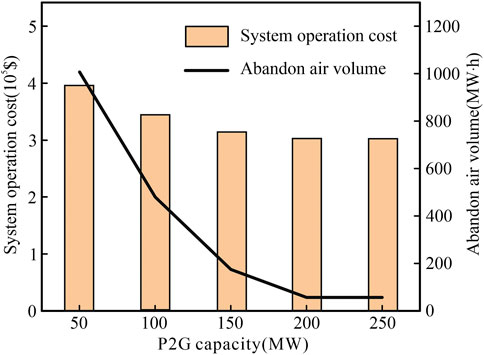
FIGURE 6. Influence of P2G capacity on system operation.
From Figure 6, it is clear that as the P2G capacity of the system is increased, the system’s total operation cost gradually lowers. However, when the P2G capacity in the system reaches a certain value, the system’s total operational cost reduces, because the P2G operating cost gradually rises as P2G capacity increases. Therefore, the P2G capacity setting should not be too high because the system’s wind power consumption and operational economy are limited by the choice of P2G physical capacity. To address this issue, a carbon capture technology is presented in this work. Although the operation of the carbon capture equipment literally consumes the thermal power units’ output, it can indirectly use the system’s wind power to reduce the amount of wind curtailed. The operation cost of P2G is significantly decreased by using the captured CO2 as raw material.
In order to study the effect of CCS and LSCCS combined with P2G on the total cost of the system, wind power consumption and carbon emissions, the maximum capacity of P2G is set to 200 MW, the CO2 raw material cost coefficient of P2G in scenario 1 is 20 $/MW, and the CO2 raw material of P2G in scenario 2,3 and 4 is provided by the carbon capture system. The results of the system optimization are shown in Table 2:
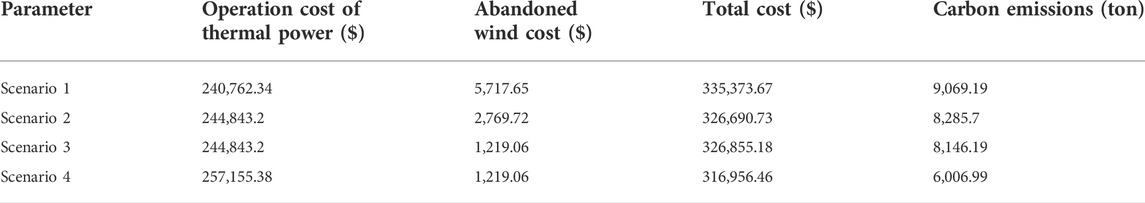
TABLE 2. System costs and carbon emissions in different scenarios.
Table 2 shows that Scenario 2’s thermal power operation costs are 1.695% more than Scenario 1’s, while carbon emissions are reduced by 8.64% and the cost of wind curtailment is decreased by 51.56%. This is due to the fact that, in comparison to conventional thermal power plants, carbon capture power plants must supply additional carbon capture energy consumption in addition to carrying electric load, which raises the operating expenses of thermal power plants. A carbon capture system, on the other hand, collects CO2 to lower system carbon emissions and delivers collected CO2 to P2G. Currently, the carbon capture system and P2G work together to consume wind energy, which lessens the physical impact of P2G capacity on wind energy consumption and lowers the cost of wind curtailment. On the basis of Scenario 2, Scenario 3 adds the memory for the answer. In comparison to Scenario 2, the cost of wind curtailment is lowered by 55.99%, carbon emissions are reduced by 1.7%, and the overall cost of the system is increased by 0.05%. On the basis of Scenario 3, Scenario 4 introduces the carbon trading mechanism. The advantages of the optimization model suggested in this study for low-carbon economy scheduling are demonstrated by the reduction of carbon emissions by 26.26% and the reduction of the system’s overall cost by 3.03% when compared with Scenario 3.
Four scenarios’ actual carbon emissions are shown in Figure 7 for each time period. Figure 7 demonstrates that the hours of low load and high wind power generation are from 3:00 to 6:00, and that scenario 3 has fewer carbon emissions than scenario 2. For this reason, scenario 3 transfers unprocessed CO2 from the peak load period to the low load period for processing using solution memory’s “energy time shift” capabilities. This increases the carbon capture equipment’s capacity during the low load period, raises its energy consumption, and lowers the system’s carbon emissions. In order to increase the net output of the system and fulfill load demand during the peak load period of 10:00–12:00, when wind power output is low, the carbon capture unit must lower the capture energy consumption. Scenes 2 and 3 have higher carbon emissions since the liquid storage carbon capture equipment and carbon capture equipment’s current energy usage is quite low. On the basis of scenario 3, scenario 4 introduces a carbon trading mechanism that takes into account the total cost of carbon in the objective function to further increase the capacity of the carbon capture system. This will decrease the net output of the carbon capture unit, open up more space for clean energy wind power, and further reduce the system’s carbon emissions.
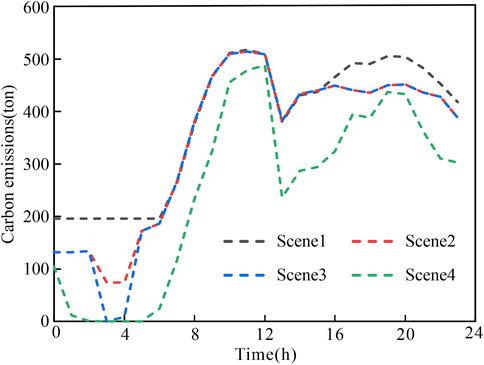
FIGURE 7. System carbon emissions under different scenarios.
The larger the solution storage capacity, the smaller the carbon emissions, but it will bring high investment and carbon capture depreciation costs. If the low carbon and economy are considered at the same time, there is an optimal capacity. In scenario 4, the relationship between different solution storage capacities and total system costs and carbon emissions is shown in Figure 8.

FIGURE 8. System cost and carbon emission under different storage tank capacities.
Figure 8 illustrates how the system’s carbon emissions exhibit a trend toward reduction and eventually tend to level off when the solution storage capacity is increased. The capacity of the solution memory is related to the time shift of the carbon capture device. The carbon capture device’s temporal shift increases with the size of the solution memory. Since the system has enough capacity to produce CO2 transfer, carbon emissions will not decrease when the capacity exceeds 22000 m3. The system’s overall cost initially declines and then rises, reaching a minimum at 14,000 m3. The depreciation expense of the carbon capture equipment can currently be compensated for by the carbon benefit provided by the solution memory capacity. The total cost of the system has increased dramatically as solution memory capacity has increased, showing that this cannot completely offset the expense of carbon capture equipment depreciation.
At present, in China, carbon trading is in the exploratory stage, and the price fluctuates. In order to analyze the impact of carbon trading price changes on the optimal operation of the system, the example sets the carbon trading price from 4–18 $/ton, and the calculation results are shown in Figure 9.
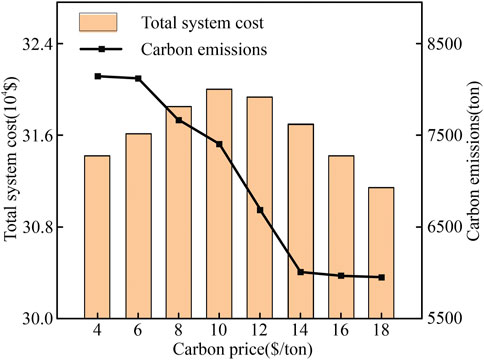
FIGURE 9. System optimization results under different carbon trading prices.
With the increase of carbon trading price, the system carbon emissions gradually decreased, and finally stabilized; the total cost of the system shows a trend of ' increase first and then decrease '. This is because when the carbon trading price is 4–10$/ton, carbon transaction costs account for a small share of total costs. Revenue from reduced carbon emissions cannot offset depreciation costs for carbon capture equipment. Therefore, the total cost of the system shows an increasing trend. When the carbon trading price exceeds 10$/ton, the proportion of carbon capture income in the total cost of the system is increasing, in order to minimize the total cost of the system, increase the output of low carbon units and carbon capture income, so that the system carbon emissions are less than quotas, the system produces carbon trading income, and the total cost is reduced. When the carbon trading price is 10–14$/ton, carbon trading price changes have a great impact on the total cost of the system; When the carbon trading price exceeds 14$/ton, the continuous increase in carbon trading prices will not affect CO2 emissions from the system, subject to maximum capture capacity.
A conventional thermal power plant is converted into a liquid storage carbon capture power plant by adding the necessary equipment for carbon capture. The electric-gas integrated energy system’s dispatching model, which includes a P2G, gas turbine, liquid storage carbon capture power plant, and wind farm, is established. The introduction of the carbon trading mechanism enables the integrated electric-gas energy system to achieve its low-carbon economic dispatch aim. The example study demonstrates how the introduction of liquid storage carbon capture technology into IEGS allows for the system to recycle carbon. When compared to carbon capture technology, liquid storage carbon capture technology uses solution memory to flexibly adjust the processing capacity of CO2 at load peaks and troughs and change the net output of the power plant. This technology is coordinated with P2G to effectively increase the system’s ability to accommodate wind power and lower carbon emissions. The amount of solution that can be stored and the price of carbon trading will have an impact on the system’s carbon emissions. In the right circumstances, increasing the solution storage capacity can lower the system’s overall cost and carbon emissions. The higher the carbon trading price, the greater the proportion of carbon emissions costs in the total cost of the system, and the smaller the carbon emissions. Due to the limitations of maximum carbon capture capacity, carbon emissions will remain constant when carbon trading prices increase to a certain level.
The original contributions presented in the study are included in the article/Supplementary Material, further inquiries can be directed to the corresponding author.
YH adjusted the overall structure of the paper in the revision of the manuscript. YT completed data analysis and wrote the first draft of the paper. KW participated in the analysis of data results and polishing of the paper. XY participated in the conception of the paper, and guided the data analysis.
This work is supported by the Shaanxi Province Science and Technology Project No. 2022JM-208.
The authors declare that the research was conducted in the absence of any commercial or financial relationships that could be construed as a potential conflict of interest.
All claims expressed in this article are solely those of the authors and do not necessarily represent those of their affiliated organizations, or those of the publisher, the editors and the reviewers. Any product that may be evaluated in this article, or claim that may be made by its manufacturer, is not guaranteed or endorsed by the publisher.
Chen, H., Chen, J., Zhang, Z., Wang, C., Wang, J., Han, H., et al. (2021). Low-carbon economic dispatching of power system considering capture energy consumption of carbon capture power plants with flexible operation mode. Electr. Power Autom. Equip. 41 (9), 133–139. doi:10.16081/j.epae.202109040
Cheng, Y., Zhang, N., Kang, C., Kirschen, D., and Zhang, B. (2017). Research framework and prospects of low-carbon multiple energy systems. Proc. CSEE 37 (14), 4060–4069. doi:10.13334/j.0258-8013.pcsee.170338
Clegg, S., and Mancarella, P. (2015). Integrated modeling and assessment of the operational impact of power-to-gas (P2G) on electrical and gas transmission networks. IEEE Trans. Sustain. Energy 6 (4), 1234–1244. doi:10.1109/TSTE.2015.2424885
Cui, Y., Zeng, P., Hui, X., Li, H., and Zhao, J. (2021a). Low-carbon economic dispatch considering the integrated flexible operation mode of carbon capture power plant. Power Syst. Technol. 45 (5), 1877–1885. doi:10.13335/j.1000-3673.pst.2020.0404
Cui, Y., Zeng, P., Wang, Z., Wang, M., Zhang, J., and Zhao, Y. (2021b). Low-carbon economic dispatch of electricity-gas-heat integrated energy system with carbon capture equipment considering price-based demand response. Power Syst. Technol. 45 (2), 447–461. doi:10.13335/j.1000-3673.pst.2020.0100a
Dong, H., Yun, Y., Ma, Z., and Wang, D. (2020). Low-carbon optimal operation of integrated energy system considering multienergy conversion and concentrating solar power plant participation. Power Syst. Technol. 44 (10), 3689–3700. doi:10.13335/j.1000-3673.pst.2020.0449
Hetti, R. K., Karunathilake, H., Chhipi-Shrestha, G., Sadiq, R., and Hewage, K. (2020). Prospects of integrating carbon capturing into community scale energy systems. Renew. Sustain. Energy Rev. 133, 110193. doi:10.1016/j.rser.2020.110193
Jiang, W., Jingjing, W., Qiang, Z., and Yachao, Z. (2022). Two-stage robust cooperative scheduling for electricity-gas integrated energy system considering power to gas for wind power accommodation. Acta Energiae Solaris Sin. 43 (2), 436–443. doi:10.19912/j.0254-0096.tynxb.2020-0340
Leonzio, G. (2017). Design and feasibility analysis of a Power-to-Gas plant in Germany. J. Clean. Prod. 162, 609–623. doi:10.1016/j.jclepro.2017.05.168
Liting, T., Lin, C., and Jianbo, G. (2019). Multi-energy system valuation method based on emergy analysis. Power Syst. Technol. 43 (8), 2925–2934. doi:10.13335/j.1000-3673.pst.2018.2310
Peng, Y., Lou, S., Wu, Y., Wang, Y., and Zhou, K. (2021). Low-carbon economic dispatch of power system with wind power considering solvent-storaged carbon capture power plant. Trans. China Electrotech. Soc. 36 (21), 4508–4516. doi:10.19595/j.cnki.1000-6753.tces.201249
Rong, Z., Yongfeng, R., Qingtian, M., Jinwei, H., Yu, P., and Bin, H. (2022). Electricity-heat-gas cooperative optimal operation strategy of integrated energy system based on cooperative game. Acta Energiae Solaris Sin. 43 (4), 20–29. doi:10.19912/j.0254-0096.tynxb.2022-0112
Sheng, S., Wu, H., and Gu, Q. (2019). “Low-carbon economic operation of the integrated energy system considering carbon capture unit coupling with power to gas,” in International Conference on Power, Intelligent Computing and Systems (ICPICS), Shenyang, China, July 12–14 2019 (IEEE), 402–407. doi:10.19753/j.issn1001-1390.2021.06.012
Su, H., Wei, Z., Ji, C., and Zhao, M. (2021). “Exploration on the development and transformation of power industry under the trend of double carbon,” in Proceeding of the 2021 11th International Conference on Power and Energy Systems (ICPES), Shanghai, China, December 18–20 2019 (IEEE), 685–689. doi:10.1109/ICPES53652.2021.9683899
Sun, H., Liu, Y., Peng, C., and Meng, J. (2021). Optimization scheduling of virtual power plant with carbon capture and waste incineration considering power-to-gas coordination. Power Syst. Technol. 45 (9), 3534–3545. doi:10.13335/j.1000-3673.pst.2020.1720
Tian, F., Jia, Y., Ren, H., Bai, Y., and Huang, T. (2020). Source-load" low-carbon economic dispatch of integrated energy system considering carbon capture system. Power Syst. Technol. 44 (9), 3346–3355. doi:10.13335/j.1000-3673.pst.2020.0728
Wei, Z., Ma, X., Guo, Y., Wei, P., Lu, B., and Zhang, H. (2022). Optimized operation of integrated energy system considering demand response under carbon trading mechanism. Electr. Power Constr. 43 (1), 11000–97229. doi:10.12204/j.issn.1000-7229.2022.01.001
Wei, Z., Zhang, S., Sun, G., Zang, H., Chen, S., and Chen, S. (2017). Power-to-gas considered peak load shifting research for integrated electricity and natural-gas energy systems. Proc. CSEE 37 (16), 4601–4609. doi:10.13334/j.0258-8013.pcsee.161361
Xu, J., and Chen, Z. (2022), Low-carbon economic dispatch of electricity-gas integrated energy system, In Proceeding of the 2022 IEEE Asia-Pacific Conference on Image Processing, Electronics and Computers (IPEC), Dalian, China, April 14–16 2019 (IEEE), 120–124. doi:10.1109/IPEC54454.2022.9777616
Zhang, X., and Zhang, Y. (2020). Environment-friendly and economical scheduling optimization for integrated energy system considering power-to-gas technology and carbon capture power plant. J. Clean. Prod. 276, 123348. doi:10.1016/j.jclepro.2020.123348
Zheng, S., Liu, J., Chen, Y., and Qi, B. (2019). Bilinear robust state estimation based on weighted least absolute Value for integrated electricity-gas system. Power Syst. Technol. 43 (10), 3733–3744. doi:10.13335/j.1000-3673.pst.2018.2410
Zhong, W., Huang, S., Cui, Y., Xu, J., and Zhao, Y. (2020). W-S-C capture coordination in virtual power plant considering source-load uncertainty. Power Syst. Technol. 44 (9), 3424–3432. doi:10.13335/j.1000-3673.pst.2019.1986
Keywords: electricity-gas integrated energy system, low-carbon scheduling, wind power accommodation, carbon capture plant, liquid storage
Citation: Hu Y, Tang Y, Wang K and Yang X (2022) Low carbon and economic dispatching of electric-gas integrated energy system with liquid storage carbon capture equipment. Front. Energy Res. 10:986646. doi: 10.3389/fenrg.2022.986646
Received: 05 July 2022; Accepted: 31 October 2022;
Published: 14 November 2022.
Edited by:
Tao Wang, Zhejiang University, ChinaReviewed by:
Gang Xu, North China Electric Power University, ChinaCopyright © 2022 Hu, Tang, Wang and Yang. This is an open-access article distributed under the terms of the Creative Commons Attribution License (CC BY). The use, distribution or reproduction in other forums is permitted, provided the original author(s) and the copyright owner(s) are credited and that the original publication in this journal is cited, in accordance with accepted academic practice. No use, distribution or reproduction is permitted which does not comply with these terms.
*Correspondence: Xiaoping Yang, eWFuZ3hpYW9wNjY2QDE2My5jb20=
Disclaimer: All claims expressed in this article are solely those of the authors and do not necessarily represent those of their affiliated organizations, or those of the publisher, the editors and the reviewers. Any product that may be evaluated in this article or claim that may be made by its manufacturer is not guaranteed or endorsed by the publisher.
Research integrity at Frontiers
Learn more about the work of our research integrity team to safeguard the quality of each article we publish.