 Lan Ren
 Daogang Peng
 Danhao Wang2
 Huirong Zhao
94% of researchers rate our articles as excellent or good
Learn more about the work of our research integrity team to safeguard the quality of each article we publish.
Find out more
ORIGINAL RESEARCH article
Front. Energy Res., 18 January 2023
Sec. Smart Grids
Volume 10 - 2022 | https://doi.org/10.3389/fenrg.2022.983743
This article is part of the Research TopicAdvanced Operation and Control of Distributed and Grid-Scale Energy Storage in Modern Low-Voltage Power SystemsView all 10 articles
To solve the risks brought by the uncertainty of renewable energy output and load demand to the virtual power plant dispatch, a multi-objective information gap decision theory (IGDT) dispatching model for virtual power plants considering source-load uncertainty under vehicle-to-grid (V2G) is proposed. With the lowest system operating cost and carbon emission as the optimization objectives, the multi-objective robust optimization model for virtual power plants is constructed based on the uncertainties of wind output, photovoltaic output and load demand guided by the time of use price. The weights of uncertainties quantify the effects of uncertainty factors. The adaptive reference vector based constrained multi-objective evolutionary algorithm is used to solve it. The weight coefficients, evasion coefficients of uncertainties and the penetration rate of electric vehicles are analyzed for the optimal dispatching of the virtual power plant. The algorithm results show that the method can effectively achieve load-side peak shaving and valley filling and has superiority in terms of economy, environmental benefits, robustness and stability.
Distributed energy is widely used in building new power systems with its multiple advantages such as green, low-carbon, flexible and renewable (China International Economic Exchange Center and State Power Investment Group Co. Ltd, 2021). And distributed energy has intense volatility and intermittent drawbacks; in the future, large-scale and high-ratio access will bring no small challenge to power system stability and energy security. Therefore, building a new power system with more flexible and resilient operation becomes urgent. The virtual power plant (VPP) participates in the power market operation as a particular power plant by aggregating and controlling wind turbines, photovoltaic, energy storage, electric vehicles and other controllable loads through advanced communication technologies. Through the complementary advantages and optimal allocation within the VPP, the randomness and volatility of renewable energy are smoothed out, and the multi-energy complementarity on the power side and flexible interaction on the load side is realized. Therefore, it is of great practical value to study the optimal dispatching and operation method of VPPs to realize the optimal utilization of distributed energy (Taheri et al., 2020; Yi et al., 2020).
For the problems brought by renewable energy, domestic and foreign research mainly regulates from generation and user sides (Liu et al., 2020). In practice, the limited capacity of the power generation equipment configuration leads to many abandoned wind and photovoltaic (PV) problems. Therefore, starting from the user side and tapping the user potential is an effective way to operate the VPP economically and achieve renewable energy consumption. Wang et al. (2022a) proposed a peak-shaving cooperative dispatching strategy to guide EVs to participate in auxiliary services through price signals and verified the economics of the proposed EV peak-shaving collaborative dispatching strategy for electricity costs. Wang et al. (2022b) proposed a hierarchical optimal dispatching model for EVs in V2G, analyzed the benefits of both EV owners and distribution network participants in the V2G process, and verified the economics and feasibility of the proposed model. However, the objective functions of the studies above mainly focus on the economic benefits, and the effects of multiple factors such as the economy and environmental protection are not considered comprehensively. In the reference (Zhang et al., 2022), to evaluate the feasibility of V2G as flexible storage, an optimization-based system planning framework was proposed to simulate the stochastic characteristics of EV fleets, and the economic and environmental benefits of the model were verified using an improved NSGA-II algorithm. Sc and Zl (2019) proposed a multi-objective approach for network reconfiguration, which considered renewable energy sources and EV access to the distribution system. The Analytic hierarchy process determined the weights of individual objectives, and the model was solved using an improved genetic algorithm. However, although these studies take into account the economic and environmental aspects, they do not consider the uncertainty of renewable energy output faced by the system.
Meanwhile, the uncertainty of a high percentage of renewable energy output is one of the hot spots of current research. Reference (FALSAFI et al., 2014; ALABDULWAHAB et al., 2015; BAI et al., 2016; Lu et al., 2020; Qian et al., 2021) studies the scenario-based stochastic planning method to consider the uncertainty of wind power output or electricity price forecast for wind farms. Stochastic programming requires a large number of data samples of random variables and an accurate probability distribution function to obtain the optimal operation. Fang et al. (Fang et al., 2022) uses stochastic optimization and robust optimization to deal with the uncertainty of the load side and generation side respectively. Wang et al. (Wang et al., 2020) constructed a two-stage distributed robust optimization model of wind and solar power output prediction error fuzzy set. The robust optimization method needs to consider the worst case, and its extremely low occurrence probability makes the scheduling plan of the virtual power plant more conservative, and the economy is poor. Reference (MORALES et al., 2010; CATALÃO et al., 2011; Zhong et al., 2020) studies the system scheduling considering the uncertainty of wind power output based on fuzzy theory. Pan et al. (2018) studied the scheduling problem of an electric thermal multi-energy coupling system connected with a large number of electric vehicles, and analyzed the uncertainty of load demand and wind power output based on fuzzy theory. The optimal solution of fuzzy programming should be obtained based on empirical probability and reasonable fuzzy membership function. Reference (Zhang et al., 2019; Niu et al., 2021; Zeng et al., 2021; Jiang et al., 2022) adopts the interval optimization method to consider the uncertainty of renewable energy and load demand. Interval optimization does not need to assume the probability distribution of uncertain variables, but needs to choose a reasonable confidence interval. Information gap decision theory (IGDT) is a non-probabilistic risk assessment method, which can link the prediction deviation with the optimal objective function to maximize the uncertainty variable disturbance while ensuring the lowest objective value. Reference (CAO et al., 2018; Ye et al., 2021) realized multi-source joint dispatching of power systems based on information gap theory, and carried out microgrid operation planning; Reference (Peng et al., 2020; Niu et al., 2021) studies the impact of renewable energy output based on classification probability opportunity constraint information gap decision theory on distribution network energy storage configuration effect; Reference (Li et al., 2019; Li et al., 20222022), based on information gap theory, studied the stochastic optimal scheduling strategy of integrated energy system considering carbon trading mechanism and carbon capture.
Based on the above references, a multi-objective IGDT dispatching model for VPPs in V2G mode considering source-load uncertainty is constructed with the optimization objectives of minimum operating cost and minimum carbon emission. To fully reflect the scenery-load uncertainty, a risk-averse strategy is introduced to build a robust IGDT model, which is solved using an adaptive reference vector based constrained multi-objective evolutionary algorithm (MOEA). Finally, the effectiveness and superiority of the proposed method in coping with the source load uncertainty are verified by case calculations, and the comprehensive goal of minimizing the system operation cost and carbon emission is achieved.
The VPP model studied in this paper integrates Wind Turbine (WT), Photovoltaic (PV), Gas Turbine (GT), Energy Storage System (ESS), Charging Pile and Electric Vehicle (EV) and other common electrical load. User-side load and distributed power are coordinated to establish a VPP with EVs. The overall framework is shown in Figure 1. The power grid and the gas company are the primary sources of energy supply for the VPP. The new energy generation units are wind turbines and photovoltaic power plants, and the gas turbines consume gas to supply power to the user-side load. The gas turbine and the energy storage system have the fast regulation capability, which is complementary to the non-regulation of renewable energy and can effectively suppress the volatility of scenery power and improve the consumption of new energy generation. The V2G technology dispatches EVs to smooth out the fluctuation of new energy generation and reduce the impact of the randomness of renewable energy on the power system so that the system can operate efficiently, stably and safely. However, the traditional economic dispatch to balance the uncertainty of scenic power output can cause excessive calls of gas turbines, significantly reducing environmental benefits. Therefore, to limit the total carbon emission of VPPs, carbon emission cost is introduced into the operation cost to optimize the ratio of each distributed energy output and make the dispatching result of VPP balance economic and environmental benefits.
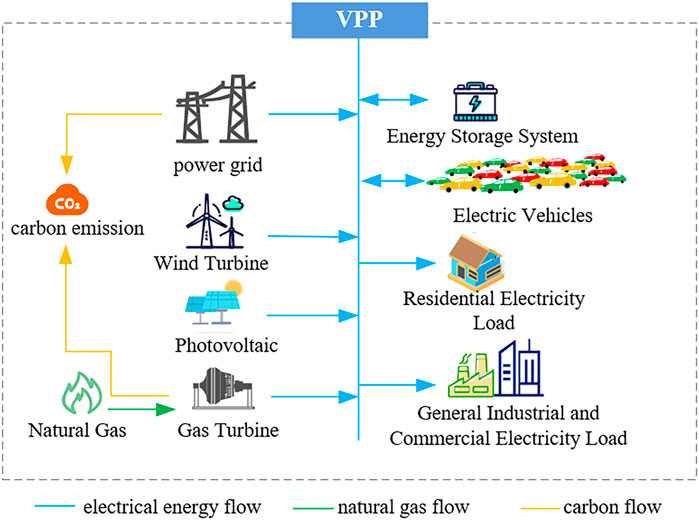
FIGURE 1. Framework of virtual power plant with electric vehicles.
Wind and photovoltaic energy are renewable energy prioritized to be connected to the grid. The output of other controllable power sources in the VPP will be coordinated to complete the planned output to prioritize the utilization of renewable energy.
There is a specific error between the predicted and actual output of wind power and PV. The deviation of the VPP output is adjusted by the optimal control of the gas turbine and the charging and discharging of the energy storage system so that the actual output of the VPP tracks the planned output. When the output deviation exceeds 0, the ESS is charged; if the output deviation still exists after setting the ESS, the GT output is reduced to meet the VPP output plan. When the output deviation is less than 0, the ESS is discharged first, and if the deviation still exists, the GT is compensated for the output on a priority basis; if the output deviation still exists, the power will be purchased from the superior grid to meet the planned output of VPP.
Electric vehicle currently has a bi-directional flow, and the user travel demand must be met before the energy storage capacity of EVs can be fully utilized (Zhu et al., 2021; Shi et al., 2022).
Average mileage per trip indicates the average driving mileage of a single trip, and according to the “China New Energy Vehicle Big Data Research Report (2020)" released by the New Energy Vehicle National Big Data Alliance, the data source of real-time monitoring operation data of new energy electric vehicles in 2019 was used for statistical analysis and fitting. It is found that its average mileage per trip approximately obeyed a normal distribution with the following probability density function:
where
The statistics in Figure 2 show that the average driving range of electric vehicles is mainly 2–15 km.
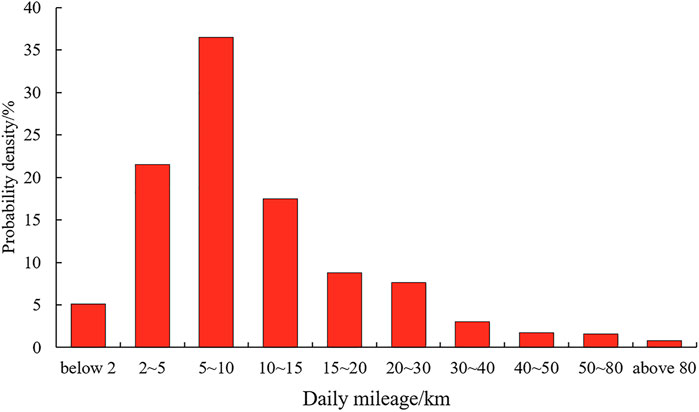
FIGURE 2. Probability density of electric vehicle average mileage.
The electric vehicle’s on-grid and off-grid moments approximately obey log-normal distribution. For travel moments, the following normal distribution:
For the return moment:
The EV charging data in this paper is selected from the typical daily charging data of a charging station in Shanghai in summer, as shown in Figure 3. The figure shows small charging peaks around 10:00 and 19:00, and 13:00–15:00 is the prominent charging peak.
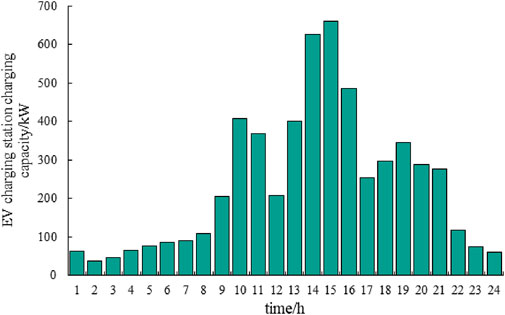
FIGURE 3. Electric vehicle charging station charging volume on a typical summer day.
In the actual calculation process, it is necessary to make the following assumptions for the lithium-ion battery of EVs: the discharge power of the power battery of the electric vehicle is approximately a straight line; The response of EV users to the time of use price follows specific probability characteristics. Based on the above two assumptions, the discharge behaviour of electric vehicles follows a binomial distribution:
Where
In this article, electricity price changes guide users to adjust the energy consumption period through the electricity price change. The time-of-use price is divided according to the energy consumption periods and combined with customer demand response. The price changes are used to motivate customers to shift their loads. During the peak period, the EV users are guided to change the load by raising the price to reduce the peak-valley difference. Meanwhile, specific incentives are provided to users to motivate them to participate in the discharge behaviour when the price is high to compensate for the volatility and randomness of renewable energy.
Objective function 1 is to minimize the operating cost of the VPP system, which is expressed as:
Where
(1) The operation and management cost of WT
Where
(2) The operation and management cost of PV
Where
(3) The cost of GT power generation
Where
(4) The cost of purchased electricity
where
(5) The loss cost of energy storage system
The loss cost of the energy storage system, including the operation and maintenance cost of the energy storage system
Where:
(6) The battery degradation cost
Where:
Objective function 2 is to minimize the carbon dioxide emissions of VPP. WT, PV and ESS produce almost no carbon emissions. The carbon emissions of the VPP constructed in this paper consist of two primary sources, electricity purchased from the superior grid and electricity generated by GT, and its expression is
Where,
(1) Power balance constraint
VPP purchases electricity and natural gas resources from the higher energy network and supplies energy to the multi-energy users through various energy conversion equipment with the following power balance constraints.
Where
(2) Wind and photovoltaic output constraints
Where
(3) Output constraint and climbing constraint of GT units
Where
(4) ESS constraints
Where
(5) EV charging and discharging constraints and capacity constraints
Where,
In the deterministic dispatching model established in Chapter 3, the wind turbine output, PV output and base load are deterministic quantities. At the same time, in the existing system, all three parameters are volatile and uncertain. The IGDT model can construct the most considerable extensive uncertainty fluctuation intervals under the condition that the optimization result is not worse than the preset value, to avoid the influence of uncertainty on the solution result. For this paper, the uncertainty sets of wind turbine output, PV output, and base load are modelled as shown in (27).
Where:
The comprehensive uncertainty radius of the system
Where,
The IGDT theory consists of risk aversion strategy (RAS) and risk seeker strategy (RSS). RAS maximizes the impact of uncertainty on the solution outcome by constructing a robust model (RM), and RSS maximizes the return from uncertainty risk by constructing an opportunity model (OM). The optimization objective of this paper is to avoid the impact of wind-PV-load uncertainty on VPP optimal scheduling results. Therefore, the RAS strategy is chosen to build IGDT robust model.
According to the objective functions
where
The cost of renewable energy is far less than that of purchased electricity, and its carbon dioxide emissions are approximately zero. When the WT and PV output is smaller and the load is larger, the system operation cost is higher, and the carbon emission is larger. Therefore, (29) is simplified to an optimization model to improve the solution efficiency, as shown in (30).
This paper uses an adaptive reference vector based constrained-MOEA (ARVC-MOEA) algorithm to solve the IGDT multi-objective dispatching model. ARVC-MOEA is evolved from multi-objective evolutionary algorithm (MOEA). MOEA is very successful in solving unconstrained multi-objective optimization problems. When dealing with constrained multi-objective optimization problems, suitable constraint processing techniques are needed to handle equation and inequality constraints.
To address the difficulties in dealing with constrained problems in MOEA, an adaptive reference vector based constrained-MOEA is used in this paper. The algorithm classifies the populations in the initial stage: one class does not consider the constraints so that the populations can cross intervals with an extensive range of constraints; the other class considers the constraints so that the populations remain well distributed. In the last stage, the algorithm constructs a local distribution enhanced region through local search. At the early stage of the algorithm, some unconstrained populations can guide the population to cross infeasible intervals and improve convergence speed. In the later stage, the algorithm uses a weakly distributive aggregation function to enhance the search capability by expanding the search range of reference vectors that are not helpful to population evolution.
ARVC-MOEA divides the reference vector into the main and auxiliary reference vectors. The auxiliary reference vector is adaptively adjusted to assist the algorithm in solving different constraints, while the main reference vector is globally unchanged to ensure the rationality and stability of the algorithm. Compared with MOEA, ARVC-MOEA can obtain better search performance and faster convergence speed by hybrid computation of split categories and improve the solution efficiency (Shi and Shi, 2022).
The solution flow of the VPP optimal dispatching model based on the adaptive reference vector based constrained-MOEA is shown in Figure 4.
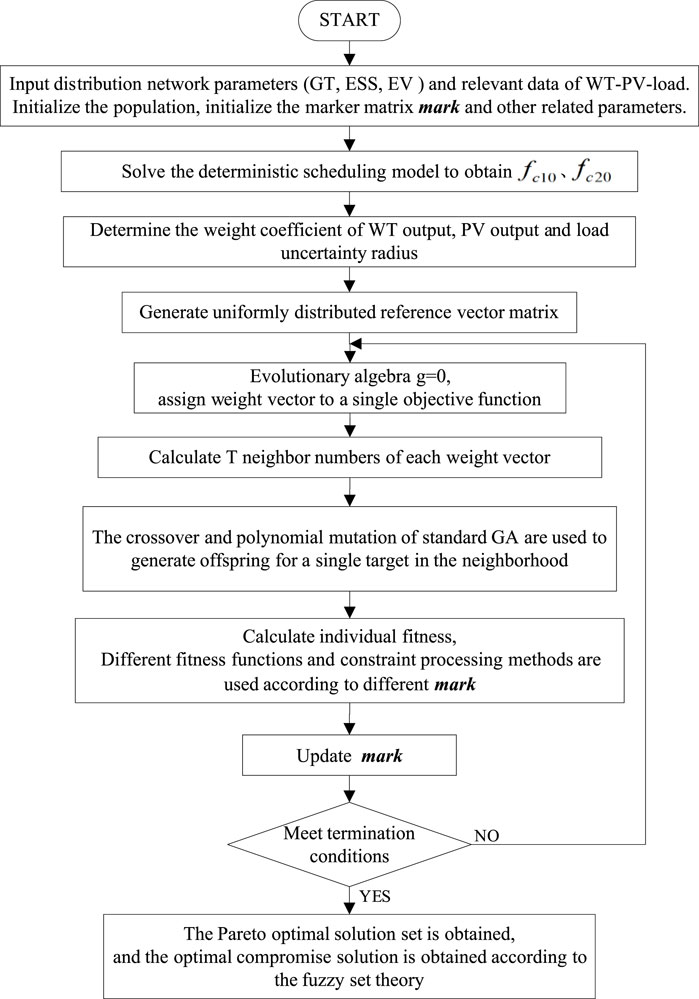
FIGURE 4. Flow of adaptive reference vector based constrained-MOEA for solving.
This paper uses the VPP system shown in Figure 1 for verification analysis. The VPP consists of a 900 kW wind farm, a 500 kW PV plant, two 440 kW gas turbines and a 400 kW energy storage system. The load includes residential, general commercial and industrial loads. The natural gas price is 2.5 ¥/m3, and the low calorific value of natural gas is 9.7 kWh/m3. The detailed parameters of the WT, PV, GT and ESS are shown in Table 1. The electricity price is based on the Shanghai two-part summer time-of-use price, with peak hours from 08:00 to 11:00, 13:00 to 15:00, and 18:00 to 21:00; valley hours from 22:00 to 06:00 the next day, and the other hours are the normal periods. The time-of-use price is shown in Table 2. ARVC-MOEA algorithm parameters are set: the population size is 50, the generation interval of the update mark is 50, and the number of terminating iterations is 1,000 generations.
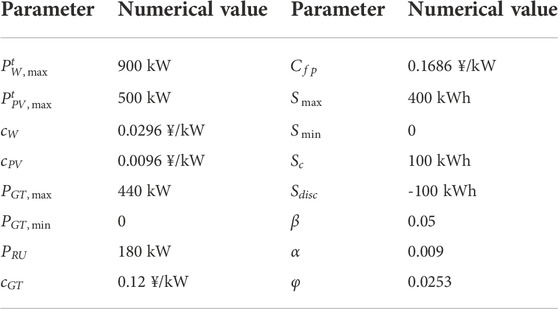
TABLE 1. Relevant parameters.
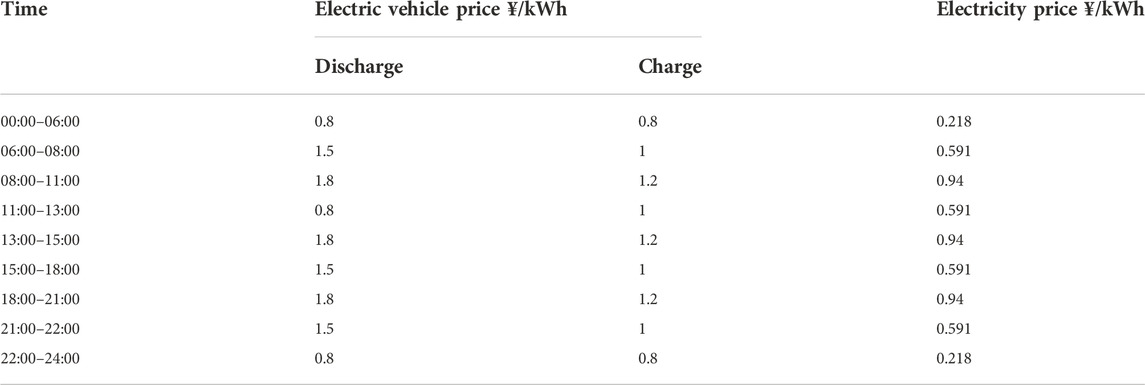
TABLE 2. Electricity for base load and electric vehicle charging and discharging time-of-use prices.
The forecast values of WT and PV output and load are shown in Figure 5.

FIGURE 5. Wind and photovoltaic output curves on a typical day.
The system parameters and the predicted values of wind-PV-load are substituted into the deterministic dispatching model and solved to obtain the overall optimal solutions
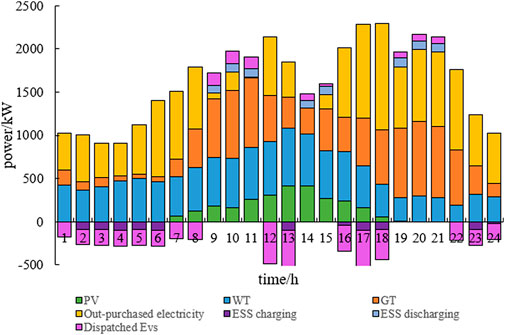
FIGURE 6. Dispatching results based on the IGDT model.
The uncertainty radius, system operation cost and carbon emissions trends of the uncertainty model are shown in Figure 7 by setting the evasion coefficient to vary in 0–0.1. The operating cost and carbon emissions are expressed in per unit value (p.u.). The figure shows that the uncertainty radius keeps increasing with the increase of the evasion coefficient, and the system operation cost and carbon dioxide emission increase. This is because the robust model under the RAS believes that uncertainty makes the target expectation develop in an unfavourable direction. The uncertainty factor is not conducive to the reduction of the objective function. The larger the uncertainty radius, the smaller the risk caused by the uncertainty of WT output, PV output and the load; therefore, the higher the system operation cost and carbon emission. The increase in uncertainty radius represents improving the system’s ability to withstand wind-PV-load uncertainty. The dispatching scheme in this case, can better cope with the long-term uncertainty of wind-PV-load, and VPP can select an appropriate evasion coefficient according to the cost it can bear.

FIGURE 7. Trends in operating cost, carbon emissions and uncertainty radius.
Set the evasion coefficient
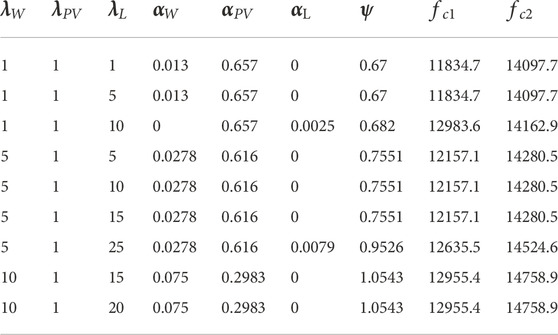
TABLE 3. Uncertainty radius with different types of weight coefficient.
Compared with the deterministic model, the IGDT robust model under RAS is more conservative. Although different weighting coefficients have a large impact on the single uncertainty radius, they have a small impact on but not on the integrated uncertainty radius of the system. Take
GT output and purchased electricity have made major contributions to the operation cost and carbon emissions, and the discussion of GT and purchased electricity before and after dispatching is more important. Figure 8 shows the comparison of GT output and purchased electricity before and after the system considers V2G. The solid line part considers V2G. Before and after EVs dispatching, the output of GT and purchased electricity have changed, and the change of purchased electricity is more obvious. After the EVs participates in the dispatching, the peak load is significantly reduced. Under the comprehensive goal of considering economic and environmental benefits, the system reduces the purchased electricity from the superior power grid. The reduced purchased electricity in the peak time has made a great contribution to reducing the operating cost of the system. Meanwhile, the carbon emission coefficient of power grid is higher than that of GT, the decrease of purchased electricity reduces carbon emissions significantly. Some EVs in peak hours are dispatched to charge at valley time, which increases the load during this period. Because of the cheap electricity price at valley time, the system chooses to purchase more electricity from the superior power grid to reduce the operation cost.
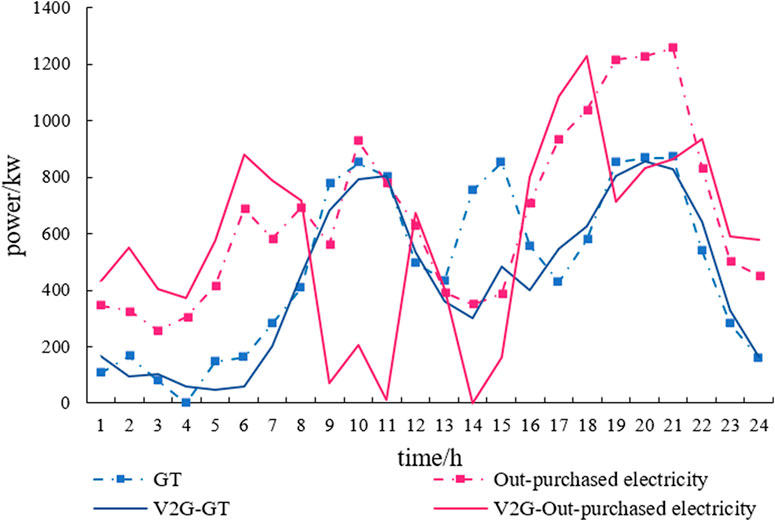
FIGURE 8. Comparison of GT output and purchased electricity before and after the system considers V2G.
Figure 9 shows the comparison of EV charging and discharging as well as load before and after optimization. The bar chart comparison shows that V2G increases the EV significantly in both the normal and valley periods. EV has played a full role in filling the valley, reducing the charging cost of EC owners, and has played a positive role on both the supply and user sides. EV discharges during peak hours of 08:00–11:00, 13:00–15:00 and 18:00–21:00, which play a peak-shaving role on the load curve and at the same time reduce the amount of electricity purchased by VPP from the superior grid during the peak hours. On the premise of meeting the needs of EV owners, V2G gently transfers the load during peak hours to normal and valley hours. The peak EV charging load from 13:00 to 15:00 is assigned to the normal period at noon and afternoon, and that from 18:00 to 22:00 is transferred to 22:00 to the early morning of the next day to achieve the purpose of peak shaving and valley filling. Overall, by comparing the load curves, we can see that the curve after dispatching tends to be smoother. V2G can smooth the load curve and narrow the load peak-valley difference, which effectively increases the operating economy and safety of the system.
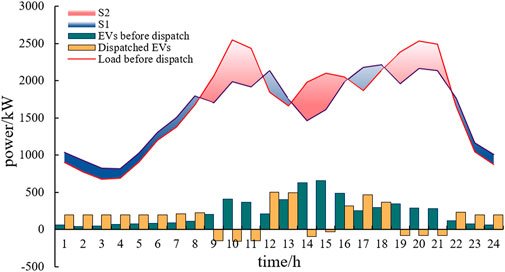
FIGURE 9. Comparison of load curve before and after dispatching.
Before and after optimization, the electricity consumption changed by the load curve follows the “equal area principle” in principle. The increased electricity consumption after optimization (the part of the optimized curve is higher than the pre-optimized curve, S2 in Figure 9) and the cut electricity consumption (the part of the pre-optimized curve is higher than the optimized curve, S1 in Figure 9) should be equal. Since EV owners rarely release excess electricity to the upper grid when charging freely. In V2G mode, VPP will dispatch EVs with discharge potential to discharge according to the owner’s electricity demand and current electricity. Therefore, the actual optimized increased electricity consumption is smaller than the cut electricity consumption.
For EV orderly charging under different responsiveness, the GT power generation cost, purchased electricity cost, system operation cost and the battery degradation cost are shown in Figure 10, and the carbon emissions and peak valley difference ratio are shown in Figure 11. All data are per unit values based on the Res = 50%. Combining the two figures, it can be seen that as the percentage of EV users participating in dispatching increases, the operating cost decreases from ¥13,123.36 to ¥10,652.7, and the carbon emission decreases from 14,447.51kg to 13,423.74 kg. Although the battery degradation cost increases with the increase of responsiveness, the operating cost still decreases due to the reduction of GT output and out-purchased electricity, as well as the dual impact of EVs participating in V2G on the power side and load side. At the same time, a high proportion of EVs with orderly charging participate in economic dispatch can effectively reduce the load peak-to-valley difference. Therefore, adopting time-of-use prices or other incentives to increase the responsiveness of EV orderly charging is conducive to smoothing the load curve, reducing system operating costs, and improving the environmental benefits of VPP.
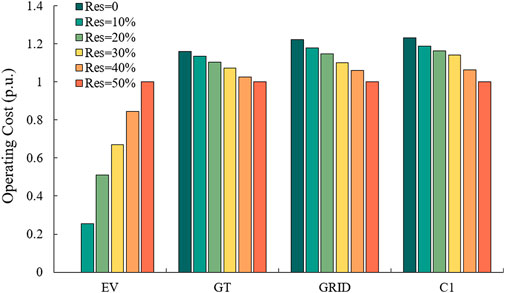
FIGURE 10. Comparison of operating costs for EVs with different responsiveness.
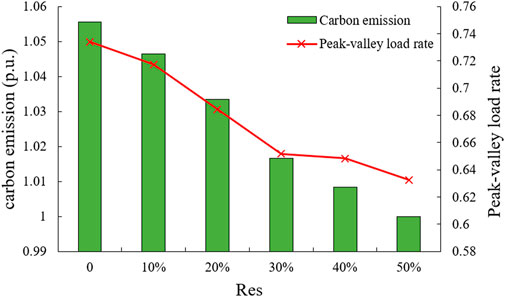
FIGURE 11. Comparison of carbon emissions, peak-to-valley difference rate under different responsiveness of EV.
To verify the superiority of ARVC-MOEA applied in this paper to handle the multi-objective model considering source load uncertainty, NSGA-II and MOCD/E algorithms are used to solve the IGDT-based VPP multi-objective model in V2G mode, respectively. All algorithms with a population size of 50 and a termination iteration number of 1,000 generations are used. The best Pareto Frontier obtained after six runs are shown in Figure 12. The Pareto Frontier for the three algorithms shows that the operating costs and carbon emissions are generally in a mutually constraining relationship. This is because to achieve smaller carbon emissions, more EVs need to be mobilized to participate in V2G regulation, and the corresponding GT output and out-purchased electricity will be smaller during peak hours, and vice versa. Therefore, the applied ARVC-MOEA processing of the multi-objective model considering the source-load uncertainty has a smaller operating cost for a certain carbon emission. From the figure, it can be seen that the Pareto front obtained by ARVC-MOEA is located at the bottom and has the largest span, and is more complete than the other two algorithms in the global non-inferior target domain. ARVC-MOEA introduces primary and secondary reference vectors, and solves different kinds of constraints by adaptively adjusting the secondary reference vectors. ARVC-MOEA effectively improves the ability of solving constraints and the search ability of solutions while ensuring the rationality and stability of the algorithm.
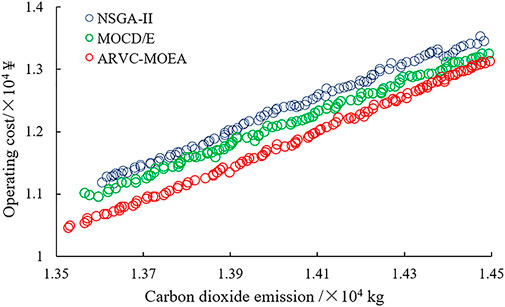
FIGURE 12. Comparison of the best Pareto Frontier for different algorithms.
Based on the operational characteristics of multi-source VPPs and the V2G characteristics of electric vehicles, this paper establishes a multi-objective IGDT optimal dispatching model for VPP in V2G mode, considering source-load uncertainties with the system operating costs and carbon emissions as the optimization objectives. The superior ARVC-MOEA algorithm is used for an efficient solution, and the following conclusions are drawn (Ma et al., 2016):
(1) The multi-objective IGDT optimal dispatching model of VPP, considering source-load uncertainty in V2G mode, can fully ensure the economic and environmental benefits of the system. It can obtain the optimal dispatching scheme of VPP with the integrated optimal system operation cost and carbon emission.
(2) The IGDT-based uncertainty optimization dispatching model quantifies uncertainty from a risk-averse perspective and provides a robust dispatching model for decision-makers. By setting weight coefficients, the influence of wind-PV-load uncertainty on dispatching operation can be quantified, which can provide a reference for the optimal dispatching of multi-source VPPs.
(3) Based on time-of-use price, V2G is used to transfer EVs’ charging and discharging periods. Incorporating the demand side adjustable resources into the power balance can realize the “peak cutting and valley filling” of the load curve, alleviate the energy supply pressure and improve the power supply reliability.
(4) The Pareto optimal Frontier obtained by ARVC-MOEA is better than the NSGA-II algorithm and the MOCDE algorithm in terms of accuracy and completeness.
In this paper, the model used for EV dispatching is relatively simple. The future research will consider the two-stage optimization strategy of orderly charging and discharging of EVs.
The original contributions presented in the study are included in the article/supplementary material, further inquiries can be directed to the corresponding author.
LR, DP, and DW contributed to conception and design of the study. LR organized the database. LR performed the statistical analysis. LR wrote the first draft of the manuscript. LR, JL, HZ, and DW wrote sections of the manuscript. All authors contributed to manuscript revision, read, and approved the submitted version.
This work is supported by the National Natural Science Foundation of China (NSFC) under Project No. 92067105 and Project No.71871160, the Shanghai Science and Technology Commission Program under Project No.20020500500, and the Shanghai Sailing Program under Project No.20YF1414900.
The authors declare that the research was conducted in the absence of any commercial or financial relationships that could be construed as a potential conflict of interest.
All claims expressed in this article are solely those of the authors and do not necessarily represent those of their affiliated organizations, or those of the publisher, the editors and the reviewers. Any product that may be evaluated in this article, or claim that may be made by its manufacturer, is not guaranteed or endorsed by the publisher.
Alabdulwahab, A., Abusorrah, A., Zhang, X., and Mohammad, S. (2015). Coordination of interdependent natural gas and electricity infrastructures for firming the variability of wind energy in stochastic day-ahead scheduling. IEEE Trans. Sustain. Energy 6 (2), 606–615. doi:10.1109/TSTE.2015.2399855
Bai, L., Li, F., Cui, H., Jiang, T., Hong, B., and Jin, X. (2016). Interval optimization based operating strategy for gas-electricity integrated energy systems considering demand response and wind uncertainty. Appl. Energy 167, 270–279. doi:10.1016/j.apenergy.2015.10.119
Cao, X., Wang, J., and Zeng, B. (2018). A chance constrained information-gap decision model for multi-period microgrid planning. IEEE Trans. Power Syst. 33 (3), 2684–2695. doi:10.1109/TPWRS.2017.2747625
Catalão, J., Pousinho, H., and Mendes, V. (2011). Optimal offering strategies for wind power producers considering uncertainty and risk. IEEE Syst. J. 6 (2), 270–277. doi:10.1109/JSYST.2011.2163009
Falsafi, H., Zakariazadeh, A., and Jadid, S. (2014). The role of demand response in single and multi-objective wind-thermal generation scheduling: A stochastic programming. Energy 64, 853–867. doi:10.1016/j.energy.2013.10.034
Fang, F., Yu, S., and Xin, X. (2022). Data-Driven-based stochastic robust optimization for a virtual power plant with multiple uncertainties. IEEE Trans. Power Syst. 37 (1), 456–466. doi:10.1109/TPWRS.2021.3091879
Wei, H., Zhang, Y., Wang, Y., Hua, W., Jing, R., and Zhou, Y. (2022). Planning integrated energy systems coupling V2G as a flexible storage. Energy 239, 122215. doi:10.1016/j.energy.2021.122215
Jiang, T., Li, X., Kou, X., Zhang, R., Tian, G., and Li, F. (2022). Available transfer capability evaluation in electricity-dominated integrated hybrid energy systems with uncertain wind power: An interval optimization solution. Appl. Energy 314, 119001–122619. doi:10.1016/j.apenergy.2022.119001
Li, J., Wang, J., Cao, X., Zhou, X., and Lu, S. (2019). A chance-constrained IGDT model for joint planning of wind farm, energy storage and transmission. Power Syst. Technol. 43 (10), 3715–3724. doi:10.13335/j.1000-3673.pst.2018.1929
Li, P., Yu, X., Zhang, Y., Zhou, Q., Tian, C., and Qiao, H. (2022). Multi-objective stochastic scheduling optimization model for rural virtual power plant considering carbon capture and power-to-gas. Electr. Power Constr. 43 (07), 24–36. doi:10.16182/j.issn1004731x.joss.22-0189
Liu, C., Zhuo, J., Zhao, D., Li, S., Chen, J., Wang, J., et al. (2020). A review on the utilization of energy storage system for the flexible and safe operation of renewable energy microgrids. Proc. CSEE 40 (01), 1–18+369. doi:10.13334/j.0258-8013.pcsee.190212
China International Economic Exchange Center & State Power Investment Group Co.Ltd. (2021). Report on the peak carbon emission and carbon neutrality. Beijing: Social Sciences Academic Press.
Lu, Z., Xu, X., Yan, Z., Wu, J., Sang, D., and Wang, S. (2020). Overview on data-driven optimal scheduling methods of power system in uncertain environment. Automation Electr. Power Syst. 44 (21), 172–183. doi:10.7500/AEPS20200202004
Ma, Z., Zou, S., Ran, L., Shi, X., and Hiskens, A. L. (2016). Efficient decentralized coordination of large-scale plug-in electric vehicle charging. Automatica 69 (C), 35–47. doi:10.1016/j.automatica.2016.01.035
Morales, J., Conejo, A., and Pérez-Ruiz, J. (2010). Short-term trading for a wind power producer. IEEE Trans. Power Syst. 25 (1), 554–564. doi:10.1109/TPWRS.2009.2036810
Niu, D., Ji, Z., Li, W., Xu, X., and Liu, D. (2021). Research and application of a hybrid model for mid-term power demand forecasting based on secondary decomposition and interval optimization. Energy 234, 121145–125442. doi:10.1016/j.energy.2021.121145
Pan, Z., Wang, K., Qu, Kaiping., Yu, T., Wang, D., and Zhang, X. (2018). Coordinated optimal dispatch of electricity-gas-heat multi-energy system considering high penetration of electric vehicles. Automation Electr. Power Syst. 42 (4), 104–112. doi:10.7500/AEPS20170527007
Peng, C., Chen, L., Zhang, J., and Sun, H. (2020). Multi-objective optimal allocation of energy storage in distribution network based onClassified probability chance constraint information gap decision theory. Proc. CSEE 40 (09), 2809–2819. doi:10.13334/j.0258-8013.pcsee.190551
Qian, W., Zhao, C., Wan, C., Huang, Y., Zhu, B., and Chen, W. (2021). Probabilistic forecasting based stochastic optimal dispatch and control method of hybrid energy storage for smoothing wind power fluctuations. Automation Electr. Power Syst. 45 (18), 18–27. doi:10.7500/AEPS20200616007
Sc, A., and Zl, B. (2019). Multi-objective network reconfiguration considering V2G of electric vehicles in distribution system with renewable energy. Energy Procedia 158, 278–283. doi:10.1016/j.egypro.2019.01.089
Shi, F., and Shi, X. (2022). Adaptive reference vector based constrained multi-objective evolutionary algorithm. J. Comput. Appl. 42 (02), 543–549. doi:10.11772/j.issn.1001-9081.2021020337
Shi, W., Qin, W., Wang, L., Yao, H., Jing, X., Zhu, Y., et al. (2022). Regional power grid LSTM dispatching strategy considering electric vehicle demand and time of use price difference. Proc. CSEE 42 (10), 3573–3587. doi:10.13334/j.0258-8013.pcsee.202473
Taheri, S., Salles, M., and Costa, E. (2020). Optimal cost management of distributed generation units and microgrids for virtual power plant scheduling. IEEE Access 8, 208449–208461. doi:10.1109/ACCESS.2020.3039169
Wang, L., Zhu, Z., Jiang, C., and Li, Z. (2020). Bi-level robust optimization for distribution system with multiple microgrids considering uncertainty distribution locational marginal price. IEEE Trans. Smart Grid 12 (2), 1104–1117. doi:10.1109/TSG.2020.3037556
Wang, M., Lu, L., and Xiang, Y. (2022). Coordinated scheduling strategy of electric vehicles for peak shaving considering V2G price incentive. Electr. Power Autom. Equip. 42 (04), 27–33+85. doi:10.16081/j.epae.202201009
Wang, Z., Liu, Y., and Su, Q. (2022). Load frequency control of multi area V2G system based on sliding mode control. Control Eng. China, 1–8. doi:10.14107/j.cnki.kzgc.20210092
Ye, H., Liu, S., Hu, J., Xiong, X., and Tan, Y. (2021). Multi-source joint dispatching strategy for a power system with concentrating solar power plants based on. IGDT 49 (23), 35–43. doi:10.19783/j.cnki.pspc.202114
Yi, Z., Xu, Y., Gu, W., and Wu, W. (2020). A multi-time-scale economic scheduling strategy for virtual power plant based on deferrable loads aggregation and disaggregation. IEEE Trans. Sustain. Energy 11 (3), 1332–1346. doi:10.1109/TSTE.2019.2924936
Zeng, L., Xu, J., Wu, M., Tang, J., Wu, Q., Wang, Q., et al. (2021). Day-ahead interval optimization for CCHP system considering uncertainty of wind power and PV. Int. J. Electr. Power & Energy Syst. 138, 107895–110615. doi:10.1016/j.ijepes.2021.107895
Zhang, C., Chen, H., Shi, K., Liang, Z., Mo, W., and Hua, D. (2019). A multi-time reactive power optimization under interval uncertainty of renewable power generation by an interval sequential quadratic programming method. IEEE Trans. Sustain. Energy 10 (3), 1086–1097. doi:10.1109/TSTE.2018.2860901
Zhong, W., Huang, S., Cui, Y., Xu, J., and Zhao, Y. (2020). Coordinated optimal dispatch of wind power solar thermal carbon capture virtual power plant considering source load uncertainty. Power Syst. Technol. 44 (09), 3424–3432. doi:10.13335/j.1000-3673.pst.2019.1986
Keywords: virtual power plants (VPP), information gap decision making, V2G (vehicle to grid), carbon emission, uncertainty
Citation: Ren L, Peng D, Wang D, Li J and Zhao H (2023) Multi-objective optimal dispatching of virtual power plants considering source-load uncertainty in V2G mode. Front. Energy Res. 10:983743. doi: 10.3389/fenrg.2022.983743
Received: 04 July 2022; Accepted: 14 November 2022;
Published: 18 January 2023.
Edited by:
Chun Sing Lai, Brunel University London, United KingdomReviewed by:
Dexuan Zou, Jiangsu Normal University, ChinaCopyright © 2023 Ren, Peng, Wang, Li and Zhao. This is an open-access article distributed under the terms of the Creative Commons Attribution License (CC BY). The use, distribution or reproduction in other forums is permitted, provided the original author(s) and the copyright owner(s) are credited and that the original publication in this journal is cited, in accordance with accepted academic practice. No use, distribution or reproduction is permitted which does not comply with these terms.
*Correspondence: Daogang Peng, cGVuZ2Rhb2dhbmdAc2hpZXAuZWR1LmNu
Disclaimer: All claims expressed in this article are solely those of the authors and do not necessarily represent those of their affiliated organizations, or those of the publisher, the editors and the reviewers. Any product that may be evaluated in this article or claim that may be made by its manufacturer is not guaranteed or endorsed by the publisher.
Research integrity at Frontiers
Learn more about the work of our research integrity team to safeguard the quality of each article we publish.