 Kun Yao
 Ying Wang2
 Jie Wan
 Henggang Wu
- 1Harbin Institute of Technology, Shenzhen, Shenzhen, China
- 2Harbin Engineering University, Harbin, China
- 3Harbin Institute of Technology, Harbin, China
- 4Zhejiang Energy Technology Research Institute Co, Ltd., Hangzhou, China
Since flexible peak shaving has been implemented in a growing number of high-power turbo-generator sets in the power grid owing to increasing demand, the load control performance of steam turbines directly affects the safety and efficiency of the unit operation. Load-following issues, especially load mutation, weaken the frequency control performance of the unit and cause load fluctuation faults, threatening power grid safety and stability. However, the definition, classification, characterization, generation mechanism, and diagnostic methods for load mutation problems have not been systematically researched. Based on the operational data of various turbo-generator set cases, this study systematically assessed three typical load mutation problems; namely, the common fault of unreasonable parameter settings of the control system as well as new-found faults in the actuator hardware and electrical interference. Subsequently, the fault mechanisms and characterization parameters of the different set capacities were analyzed and extracted. Furthermore, a diagnosis method was designed according to the actual problem, based on which fault type was identified. Case analysis of typical sets demonstrated that this method can quickly test and diagnose faults when in actual real-world scenarios and effectively determine the cause of the fault. This method can also detect the initial fault features, which is convenient for daily maintenance and avoids fault aggravation.
1 Introduction
In the context of “double control” targets in the carbon reduction era, China is constantly pursuing methods for clean and efficient energy generation (Lugovoy et al., 2021). Hence, the proportion of power generated by renewable energy, such as wind and solar energy, is increasing (Hu et al., 2015; Topel and Laumert, 2018). However, renewable energy is characterized by intermittency and strong random fluctuations, which result in security and stability challenges to the power grid. Thermal power plants in China must undergo more peak and frequency regulation work considering their importance in power production (Wang et al., 2014; Li et al., 2021a). As a direct prime mover connected to the generator, a steam turbine is essential to ensure the load regulation capability of the turbo-generator set (Tani, 2017). Beyond turbo-generator sets, steam turbines are also more generally applied in other power generation, such as nuclear, concentrated solar, and combined cycle power plants (Papaelias et al., 2018; Zhong et al., 2021). Failure of the steam turbine regulation system results in a load mutation of the unit, which could affect its regulation performance and cause load oscillation affecting the stability of the power grid (Li et al., 2016a; Wang et al., 2016). Therefore, it is significant to perform the sudden load mutation caused by the steam turbine (Jin et al., 2019; Yao et al., 2022).
Jin et al. (2013) reported that a non-linear speed regulator could cause continuous load oscillation of the unit. Pondini et al. (2017) proposed a dynamic model using a hydraulic mechanical system to analyze the system’s stability and failure mode. Wang et al. (2018) observed that the reduction of the flow characteristic curve can also cause problems with power oscillation; moreover, unreasonable parameter settings simultaneously further increased the control logic. Sheng and Zheng (2019) proposed an online monitoring and optimization method for the flow characteristic curve to address load oscillation problems caused by the nonlinearity of the flow characteristic curve. Xuanyin et al. (2010) used AMESIM to analyze the underlying cause of load oscillations from the servo-valve. Subsequently, they proposed a highly accurate fault diagnosis based on particle swarm optimization and a backpropagation algorithm. Thus, previous studies on load oscillation in steam turbines focused on flow characteristics, including single-valve and multi-valve control modes. In cases in which the overall flow regulation is controlled by multiple governing valves (GVs), unreasonable flow characteristic curve designs or overlapping settings between GVs will eventually cause a nonlinear overall flow characteristics curve and even generate load oscillation (Ma et al., 2013; Tan, 2015). Most studies have demonstrated that flow characteristics are an important cause of load mutation (Sun, 2017). However, in addition to nonlinear characteristic curves, sensor faults, valve unsmooth stagnation, and problems with electrical interference signal measurement or electrical systems can also lead to load mutation. The current research has focused more on load mutation failures of the control systems for steam turbines, such as flow characteristics, rather than load mutations caused by hardware failures or electrical interference. Moreover, no quantitative method yet exists to describe load mutation problems. Thus, the definition, classification, characterization, generation mechanism, and diagnostic methods for this quantitative method require systematic research to address the significant challenges and difficulties in the early warning, diagnosis, and maintenance of actual faults (Li et al., 2020; Li et al., 2021b).
The present study conducted a systematic mechanism analysis and proposed a method for the diagnosis of load mutation for a typical steam turbine based on actual cases. This report is organized as follows. Section 2 introduces the definition and influence of load mutation. Section 3 describes the systematic analysis of typical causes of load mutations, including unreasonable parameter settings of the control system in Section 3.1, actuator failure in Section 3.2, sensor faults in Section 3.3, and electrical interference in Section 3.4. Based on the above analysis, Section 4 proposes a method for fault diagnosis of load mutations based on the historical data and characteristic tests of GVs.
2 Definition and impact of load mutation
Currently, thermal power units mostly participate in primary and secondary frequency control to provide automatic load adjustment based on the coordinated control system. In normal conditions, according to the load command received from the power grid, the power unit will automatically adjust the fuel entering the boiler or the valve lift of the GV for the steam turbine. Hence, the actual load of the unit is equal to the load command of the grid. A fault in the system decreases the performance of the unit load control system, which means that the actual load cannot accurately track the load command, leading to a load mutation. In this study, load mutation is defined as a large deviation between the actual load and the load command during the adjustment process. This deviation may be the sudden increase and decrease of the actual load. Moreover, the root cause of load oscillation is the failure of the unit load control system. Its definition is closely related to the unit capacity and the grid-connected rules. Adjustment accuracy, one of the three important indicators in automatic generation control (AGC) performance, is closely related to the definition of load mutation. Therefore, load mutation is a deviation between the actual load and the AGC command >0.5% Pe (rated load) when the AGC command remains constant. The load control system will continuously adjust the steam flow of the steam turbine to change the actual load with sudden load changes. However, overshooting and reverse adjustment will occur due to the performance degradation of the load control system. This frequent adjustment ultimately results in load oscillation. Therefore, load oscillation is essentially a load mutation phenomenon. The reasons for sudden load changes must be analyzed to study load mutation (or oscillation).
The abnormal load change phenomenon, leading to load mutations or oscillation problems, can affect the primary and secondary frequency control performance. It weakens the flexibility of the unit load regulation and even reduces the unit economy. Several real fault cases have demonstrated various reasons for load mutation. Load mutation will have harmful effects (or even lead to an accident) if the fault cannot be accurately located.
3 Systematic analysis of the mechanisms and characteristics of typical load mutation failure
By collecting the actual operational data of >100 subcritical, supercritical, and ultra-supercritical units with capacities of 150, 200, 300, and 600 MW, this study summarized and classifies the typical load mutation of the turbo-generator set. The mechanisms and characteristics of different fault types were also analyzed based on the typical fault cases and their operational data, laying the foundation for the subsequent establishment of methods for fault diagnosis.
3.1 Unreasonable parameter setting of the load control system
3.1.1 Failure mechanism analysis
The unit load mutation caused by unreasonable parameter settings for the load control system is rooted in a design defect of the steam admission characteristic curve. For example, the flow characteristic curve shown in Figure 1B comprises the steam admission characteristic curves shown in Figure 1A. In Figure 1, the flow demand energy management (FDEM) is a comprehensive steam flow demand for the steam turbine, in which the valve lift ratio represents the level of valve opening and the actual flow is the ratio of actual steam flow to the rated main steam flow. To ensure curve linearity, each steam admission characteristic curve is designed to have a specific overlap setting. An unreasonable overlap setting of the steam admission characteristic curve could cause the nonlinear flow characteristic curve shown in Figure 1C. The slope of the flow characteristic curve is small for some FDEM ranges but will suddenly increase in another range, which is likely to cause sudden load change/oscillation faults in the unit (Chen et al., 2018).
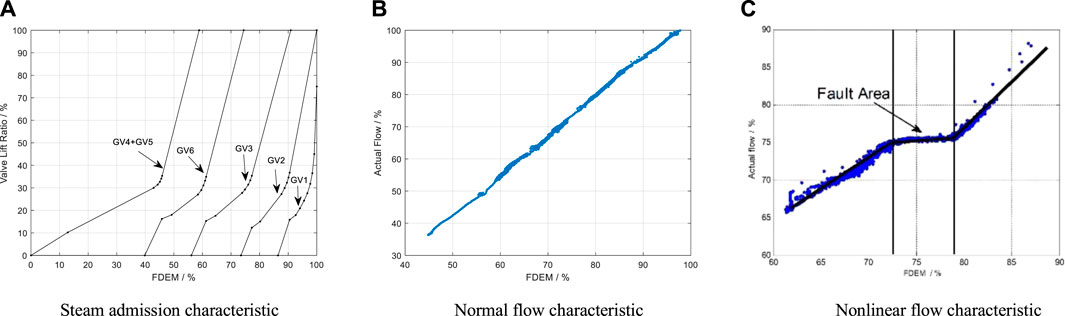
FIGURE 1. Steam admission and flow characteristics of steam turbines. (A) Steam admission characteristics. (B) Normal flow characteristic. (C) Nonlinear flow characteristics.
3.1.2 Fault case
The fault case is a subcritical 330 MW heating unit. It has a load mutation problem while operating in a partial FDEM range under the throttle control mode. Figure 2 shows the change curve of the actual load and FDEM. Unlike the load oscillation phenomenon, the load mutation cannot be directly seen in Figure 2. However, when operating in such fault conditions, the unit cannot successfully run under AGC. As shown in Figure 3, the unit has a nonlinear flow characteristic curve in the FDEM range of 78%–86%. The curve slopes of the three FDEM ranges [70%, 78%], [78%, 86%], and [86%–100%], differ significantly, with an approximately four-fold slope difference between the second and third FDEM ranges in this figure, which means the load variation corresponding to a unit FDEM is four times that of other load ranges.
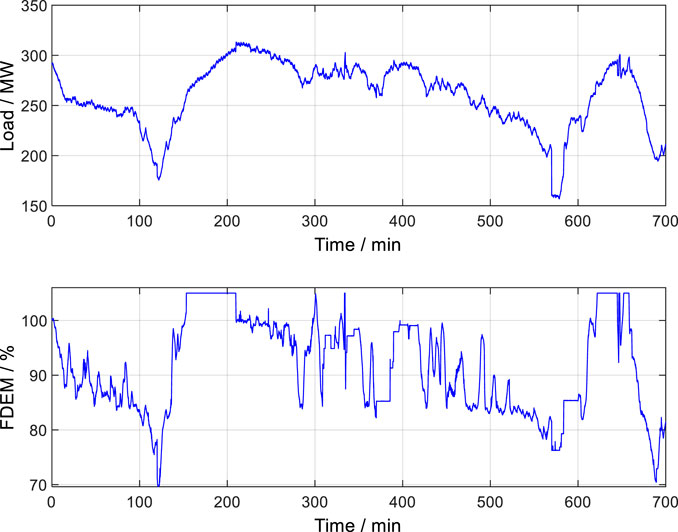
FIGURE 2. Load mutation under throttle control mode.
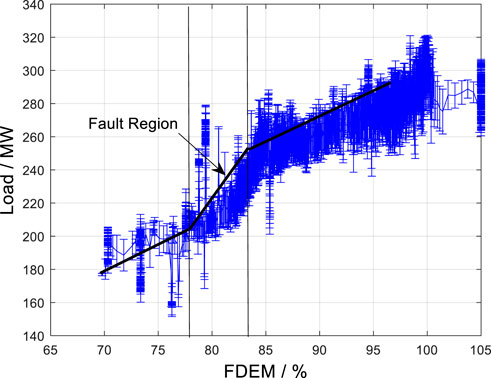
FIGURE 3. Flow characteristic curve.
The fault case and mechanism analysis above demonstrated the following characteristics of the load mutation problem caused by the setting of unreasonable parameters for the load control system:
1) The unit flow characteristic curve has a nonlinear problem.
2) The unit load mutation failure is accompanied by GV action; that is, the rapid opening and closing of the GV determines the sudden load change failure.
3.2 Actuator hardware failure
3.2.1 Mechanism analysis of failures due to loose connections
As a direct actuator in the load control process, changes in the valve lift and disc position of the GV can adjust its flow area, resulting in alterations in the steam admission of the steam turbine, thereby changing the unit load. Wear of the connecting parts of the GV, such as the yoke bushing, can cause the connecting parts of the valve disc to trip and loosen (or even fall off), resulting in a load mutation. Figure 4 shows a schematic diagram for such a fault. The positions of the GV in normal and trouble-free states are shown in Figure 4B. A lack of tight connection between the valve stem and valve disc causes an invalid valve lift when this unit is moving. As shown in Figure 4A, the valve stem rises while the position of the valve disc remains unchanged. Figure 4D shows that the valve disc assembly is subjected to a weight G (downward) and a steam flow force F (upward) during valve adjustment. When the main steam pressure changes to an appropriate value, the steam force F acting on the valve disc will be less than the weight G of the valve disc assembly. The valve disc will then drop to the position instantly, as shown in Figure 4C. This effect is equivalent to the sudden closing of the GV, resulting in a sudden pressure drop, eventually leading to load mutation. This hardware failure is closely related to the valve structure and unit type. Different unit capacities are accompanied by different valve structures (unequal G). Moreover, the unit types, such as subcritical and supercritical, have different steam pressure operating ranges; thus, the steam force F will change similarly. Therefore, further analysis of the hardware failure of units with different capacities is required.
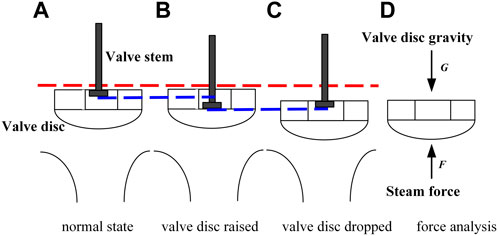
FIGURE 4. Schematic of actuator failure. (A) Normal state (B) valve disc raised (C) valve disc dropped (D) force analysis.
3.2.2 Fault characterization of different capacity units
3.2.2.1 Characterization of a hardware looseness fault in a 200 MW unit
The conventional characterization of a GV hardware failure in a 200 MW unit is load mutation. Figure 5 shows the problem characterization of this hardware failure. In Figure 5A, the load suddenly increases by 8.5 MW, from 129 to 137.5 MW. The GV in Figure 5B shows no instantaneous action during this time. Figure 5C shows that the main steam pressure and the pressure after the GV fluctuate in the corresponding time periods. This occurs because the valve disc is held up by the steam flow force and changes the steam pressure when the unit has a GV hardware failure, causing a sudden load change.

FIGURE 5. Load mutation of a 200-MW unit. (A) Load. (B) GV lift ratio. (C) Steam pressure.
3.2.2.2 Characterization of a hardware looseness fault in a 300 MW unit
A 300 MW unit will experience load mutations in nozzle governing and the throttle control mode. Figure 6 shows the sudden load change phenomenon under the throttle control mode. Figure 6A–C shows the change curves of load, steam parameters, and the four GV openings, respectively. When the unit operates at 179 MW, the load suddenly drops by approximately 18 MW to 161 MW, as shown in Figure 6A. Figure 6B shows that the commands and feedback values of the four GVs remain consistent before the load mutation problem. The load is guaranteed by increasing the valve lift ratio under the influence of the load command when the load mutation problem occurs. Simultaneously, the main steam pressure suddenly increases and pressure after the GS suddenly decreases. This fault also occurs when the unit remains operating in the nozzle governing mode, as shown in Figure 7.
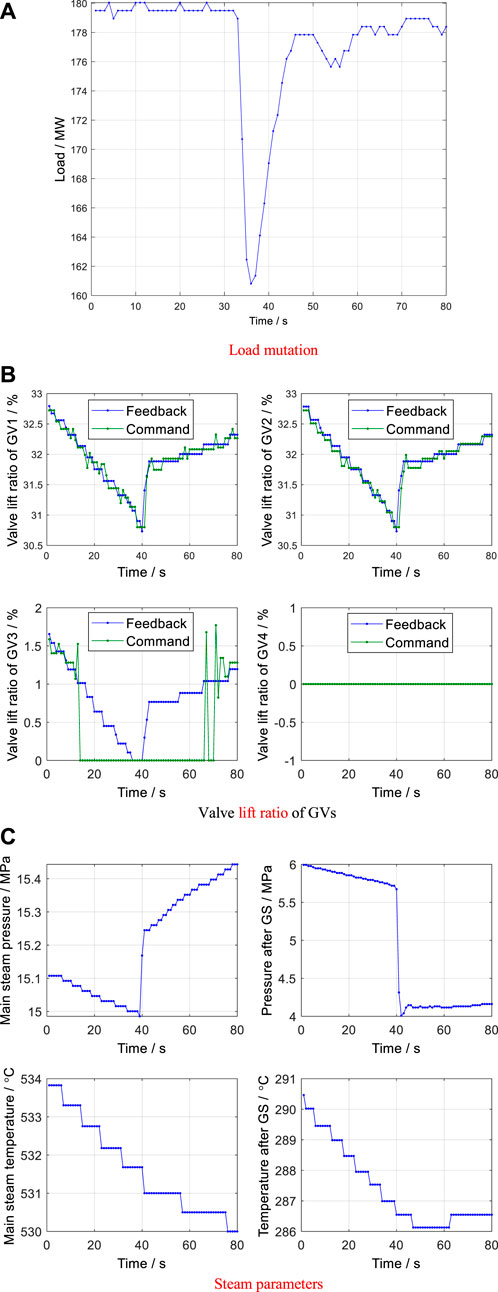
FIGURE 6. Load mutation in throttle control mode. (A) Load mutation. (B)Valve lift ratio of GVs. (C) Steam parameters.

FIGURE 7. Load mutation in a nozzle-governing model.
3.2.2.3 Characterization of a hardware looseness fault in a 600 MW unit
Subcritical and supercritical 600 MW units differ from 200 and 300 MW units in not only the weight and structure of the GV disc but also the operating parameters, with those of supercritical 600 MW units wider than those of 200 and 300 MW units. In practice, the fault characterization of a hardware failure in the GV of a 600 MW unit is more complex and dynamic. Taking a supercritical 660 MW unit as an example, Figure 8A shows the steam admission characteristic curve of the throttle control mode. Figure 8B,C reflects the changes in the flow characteristic curve during different time periods during this steam admission characteristic curve.
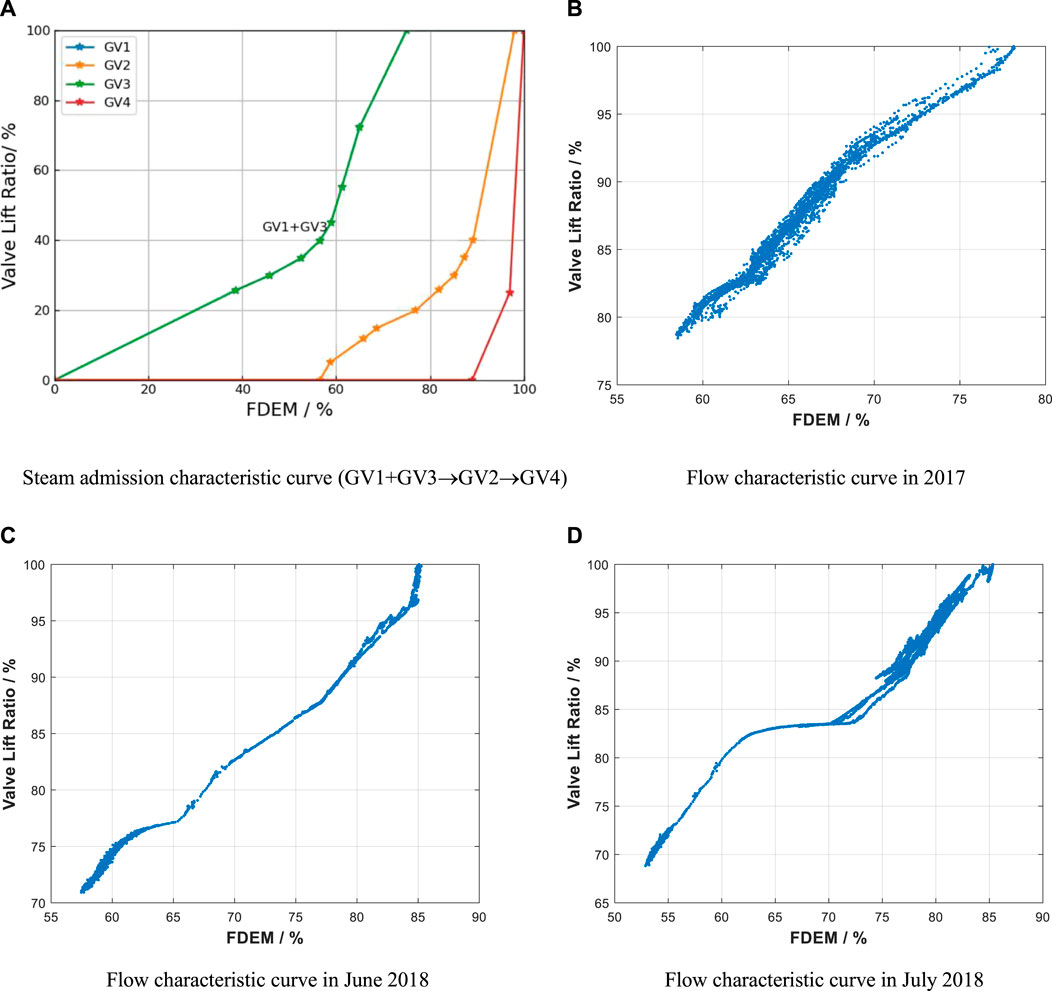
FIGURE 8. Flow characteristic curve during different time periods. (A) Steam admission characteristic curve (GV1+GV3→GV2→GV4). (B) Flow characteristic curve in 2017. (C) Flow characteristic curve in June 2018. (D) Flow characteristic curve in July 2018.
Figure 8B shows the flow characteristic curve for the designed steam admission characteristic curve, with reasonable linearity. Compared to Figure 8C, the FDEM leveled off at 62%–65% in June 2018. However, this flattened curve area increased to 62%–71% after 1 month, increasing 6% of the total interval (Figure 8D). Within the gap length, the valve stem had an invalid valve lift, which prevented changes in valve opening and inlet steam flow; thus, the flow characteristic curve in this area is flat. Over time, the degree of wear deepens, the invalid valve lift increases continuously, and the no-flow interval gradually expands. Consequently, the steam flow force cannot overcome the disc weight and the valve disc shows a falling state. The steam flow into the steam turbine remains steady while the valve disc does not show transient rising or falling during load regulation. Therefore, a hardware looseness fault in a 600 MW unit will not show a load mutation fault. Therefore, whether the hardware looseness fault in a 600 MW unit will cause load mutation failure should fully consider the GV structure.
However, under the influence of hardware failures and unreasonable parameter settings, 600 MW units can also show load mutation faults. The 600 MW case shown in Figure 9A showed a sudden load drop of approximately 13.26 MW at 7405s–7409s. The pressures of the main steam and the steam after GS (Figure 9B) suddenly increased and decreased respectively. However, the FDEM curve and valve opening curves of each GV in Figure 9C show a stable state, indicating that the hardware looseness fault caused the valve disk to drop and change the input steam parameters of the steam turbine. The flow characteristic curve in Figure 9D has a fault region that is nonlinear and discontinuous. More specifically, in the data overlay, the FDEM value obviously maps more value of actual flow belong to different regions at 71.6%–72.6%. The load mutation happened at the nonlinear range, 70%–75% of FDEM, of the curve, where the nonlinearity caused by hardware looseness fault and an unreasonable overlap setting occurred. This is the conclusion of the final overhaul result.
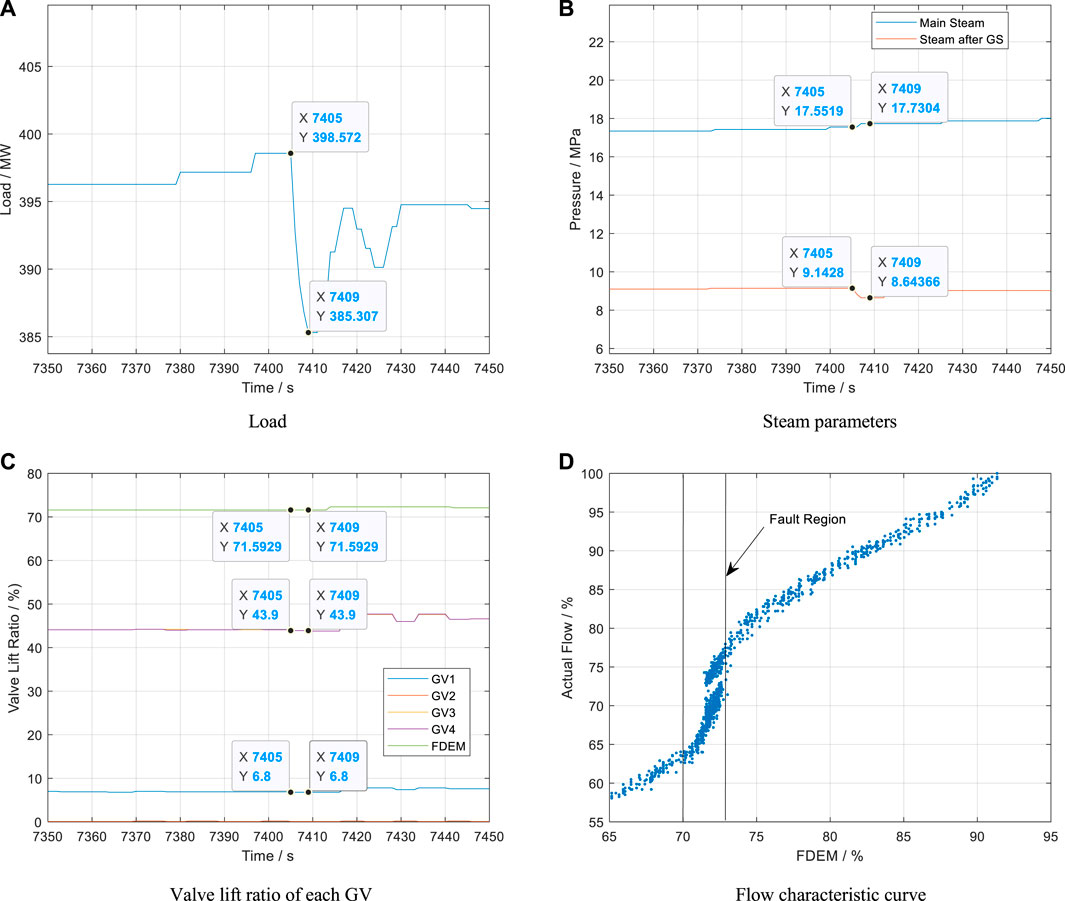
FIGURE 9. Load mutation of a 600 MW unit. (A) Load. (B) Steam parameters. (C) Valve lift ratio of each GV. (D) Flow characteristic curve.
The nonlinear and discontinuity problem can also occur in subcritical 600 MW units. As shown in Figure 10, the data overlay occurs at 89%–89%.
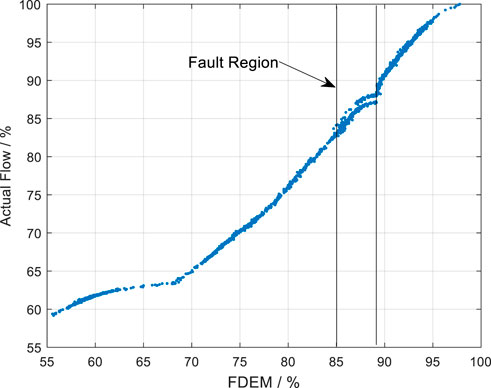
FIGURE 10. Flow characteristic curve.
The results of this typical case and the mechanism analysis above demonstrated the following characteristics of load mutation caused by failure of the actuator hardware:
1) Consistent command and feedback values for each GV.
2) The main steam pressure of the steam turbine and the steam pressure after the GV show conversely varying tendencies when a fault occurs.
3) The failure does not depend on the operating mode of the unit; that is, the failure will occur in both nozzle governing and throttle control modes.
4) This load mutation fault will only occur in a certain load segment of different control modes.
3.2.3 Mechanism analysis of jamming failures
Besides the faults caused by hardware looseness of the GV, the actuator of the load control system also includes a hydraulic servo-motor, which may also experience jamming faults during operation, resulting in an insensitive load change. The load mutation occurs when the jamming disappears instantly. The direct cause of jamming failure is dry friction between moving interfaces. This dry friction results from the uneven circumferential pressure distribution of the GV caused by hydraulic servo-motor hydraulic oil particle pollutants, GV rust, and poor installation processing, which will generate a large lateral force that pushes the GV to the sleeve, causing load mutation. Although many mechanisms can lead to jamming faults, their monitoring methods are relatively mature. Thus, jamming faults can be quickly identified based on a deviation between the valve of opening command and feedback; hence, this study does not describe this problem in detail.
3.3 Sensor faults
Sensor faults include deviation, drift, and precision degradation. Load mutations will also occur at the control signal level in instances with a deviation fault in the sensor-measured unit load. The causes of sensor failure and detection and isolation methods are relatively mature (Li et al., 2016b; Li et al., 2019). A redundant design of multiple measurements is usually adopted to ensure the accuracy of some main parameters in practical application. Abnormal values are filtered out based on multiple measurement points or simple algorithms to filter the measurement signal. The probability of sensor fault for measuring main parameters during the unit’s maintenance cycle is small. Therefore, this study does not include cases of specific sensor faults. Although the probability of sensor fault is small, interference by the outside world will make some of the main measurement parameters required in the steam turbine load control process abnormal. Especially in a working environment with many electrical devices, poor shielding increases the probability of the occurrence of such problems.
3.4 Load mutation caused by electrical interference
3.4.1 Signal measuring system failure caused by electrical interference
3.4.1.1 Failure of the signal measurement system with no effect on load regulation
Figure 11A shows the load curve of a unit. Large sudden load increases and decreases occur at some moments during load regulation, spiking to 30 MW. This study selected two fault points for detailed parameter analysis, as shown in Figures 11B–G. Figure 11B–D shows the fault points of the sudden load increase caused by noise in the signal measurement system. Figure 11E–G show the fault points of the sudden load drop. The sudden load change failures quickly recover to the normal level at the next sampling period. The trend of FDEM and valve lift for each GV in this figure show that they remain stable when such a fault occurs. Although the load control system does not follow the adjustment at this moment, the signal will be sent to the power dispatching system, which will affect the unit AGC assessment index. The probable cause of this fault is poor shielding, such as grounding.
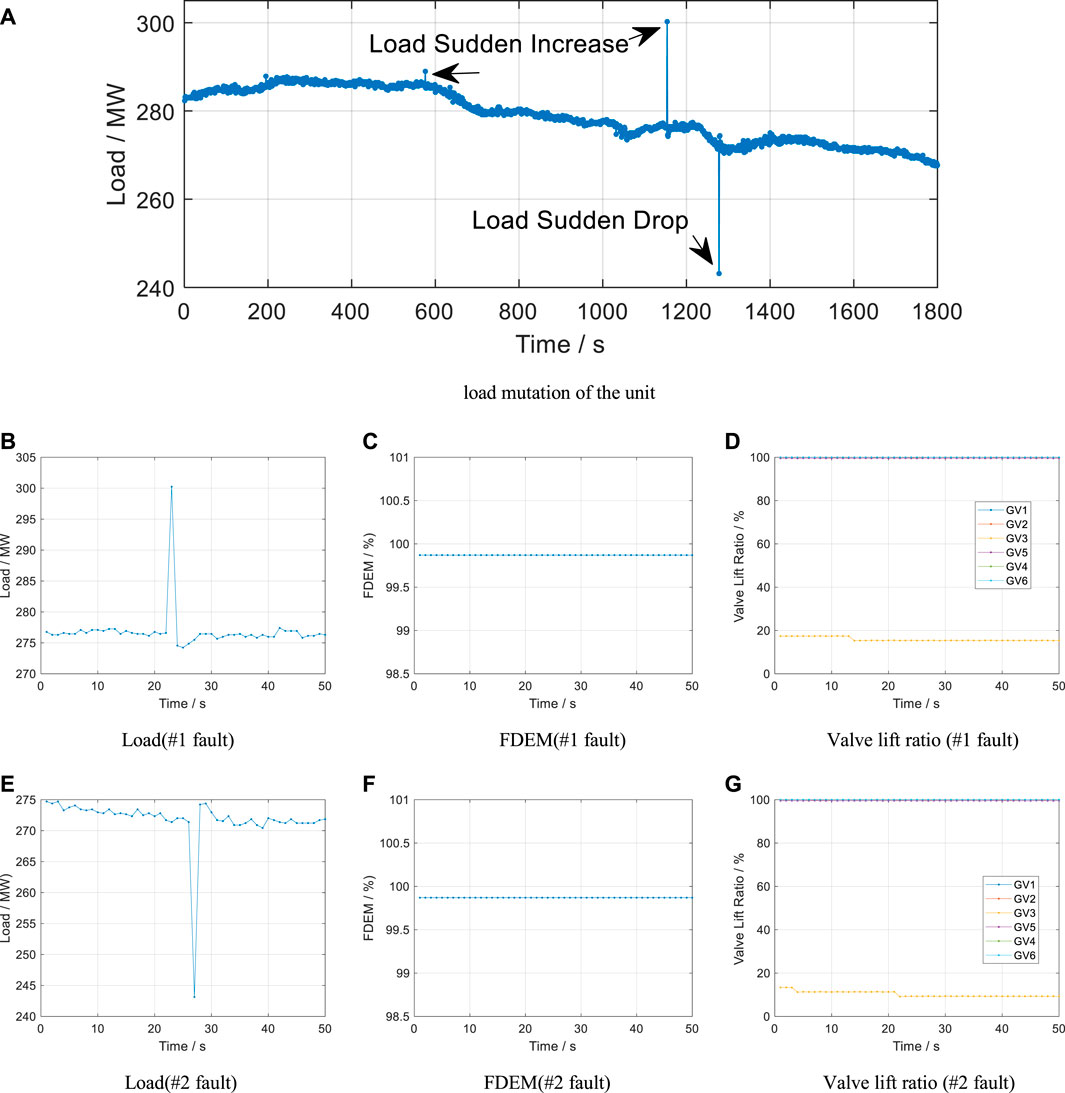
FIGURE 11. Load mutation caused by a sensor fault. (A) Load mutation of the unit. (B) Load (#1 fault). (C) FDEM (#1 fault). (D) Valve lift ratio (#1 fault). (E) Load (#2 fault). (F) FDEM (#2 fault). (G) Valve lift ratio (#2 fault).
3.4.1.2 Failure of signal measurement systems affecting load regulation
In some cases, this interference can also cause load mutation, as shown in Figure 12. To maintain the power output, the valve lift of GV was reduced, followed by FDEM reduction. The GV adjustment lags behind the occurrence of a sudden load increase, indicating that the load mutation was not caused by an actuator hardware failure. However, the active load command and excitation voltage remain constant and maintain a small disturbance, respectively, suggesting that the interference was not caused by the power grid. This kind of interference does not directly act on the sensor but rather on the signal conversion or transmission process of the signal measurement system, which will cause unit adjustment.

FIGURE 12. Load mutation caused by a sensor fault. (A) Load (B) FDEM. (C) Actual load command. (D) Excitation voltage.
The results of the above analysis demonstrated the following characteristics of faults in the signal measurement system caused by electrical interference:
1) The load mutation problem persists when the unit FDEM or valve lift of each GV remains unchanged.
2) The load mutation occurs before GV adjustment.
3) Active load command and generator-side parameters, such as excitation voltage and current, remain unchanged or maintain a small disturbance.
3.4.2 Electrical system failure caused by electrical interference
3.4.2.1 Load mutation type: Pulse
When the measurement system is affected by electrical interference, a load mutation fault of load regulation will also occur. Figure 13A shows multiple instances of a sudden load increase and drop faults, such as at 440, 680, and 710 s, as well as a maximum change value exceeding 23 MW. This study selected 440 s for further analysis, as shown in Figure 12B–D. The valve lift of the GV decreased by reducing the FDEM due to the sudden unit load increase to maintain the unit load. The GV action lagged behind the occurrence of a sudden load increase process; therefore, this was not a load mutation fault caused by the actuator hardware failure. Further analysis of the excitation voltage on the generator side (Figure 12D) showed that the sudden load increase and increase in excitation voltage were synchronized, which is also a typical feature of an electrical fault.
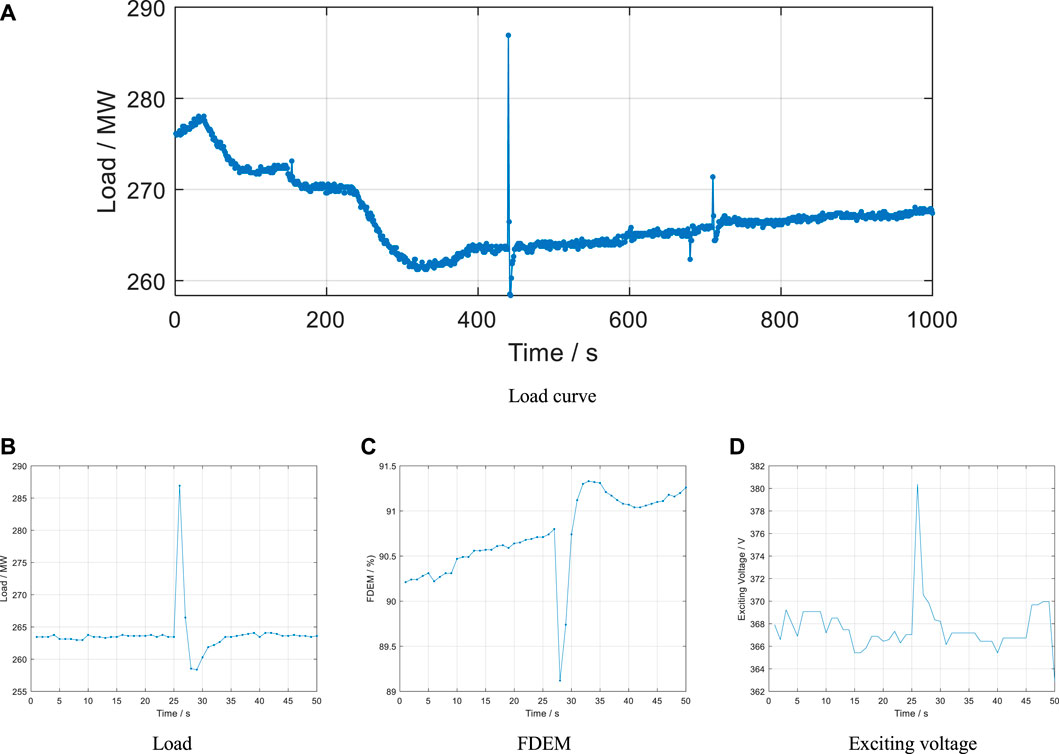
FIGURE 13. Pulse load mutation. (A) Load curve. (B) Load. (C) FDEM. (D) Excitation voltage.
3.4.2.2 Load mutation type: Oscillation
The load mutation caused by electrical interference shows the pulse-type characteristics described in the previous section, with an oscillating load mutation phenomenon. Figure 14A shows the curve of the unit load command, the actual load, and the FDEM and steam pressure after the GV. When the load command remains constant, the actual load oscillates continuously. The fault is detected by increasing the dead zone of load regulation, as shown in Figure 14B. The FDEM remains constant after increasing the dead zone range, indicating that the opening of each GV does not change; however, the actual load still oscillates continuously. Therefore, an unreasonable parameter setting of the control system and actuator hardware failure can be ruled out as causes of the fault. However, there remains a large fluctuation in the excitation voltage of the generator and the maximum fluctuation amplitude exceeds 10 V. The figure shows that when the load has an oscillation problem, the load control system frequently changes the GV opening to maintain an actual load consistent with the set load command, causing the oscillation of the regulation of valve opening and stage pressure.
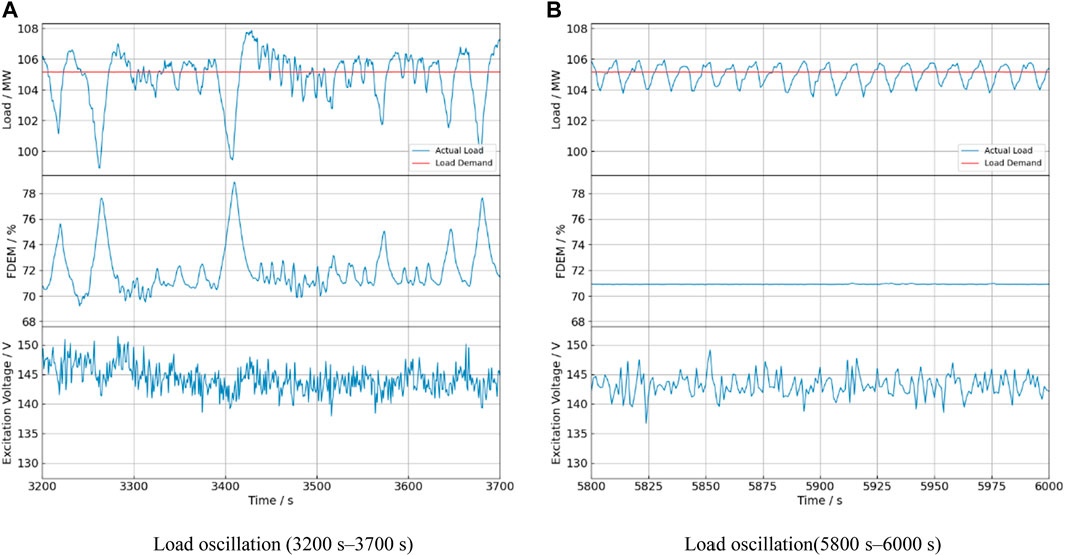
FIGURE 14. Load oscillation. (A) Load oscillation (3200–3700 s). (B) Load oscillation (5800–6000 s).
The results of this analysis demonstrated that electrical system faults caused by electrical interference have the following characteristics:
1) The load mutation occurs before GV action.
2) The active power command and the parameters of a generator, such as excitation voltage, change synchronously with load mutation.
4 Fault diagnosis method based on GV activity tests
The results of the above analysis demonstrated that many reasons can lead to sudden load failure. Quickly locating the cause of this failure can allow rapid maintenance to guarantee safe and stable unit operation. Based on the results of the analysis of these typical causative mechanisms and feature extraction of load mutation failures, this study proposes the following method for diagnosing faults causing load mutation. This method is based on the GV activity test, as shown in Figure 15. The specific implementation method is as follows.
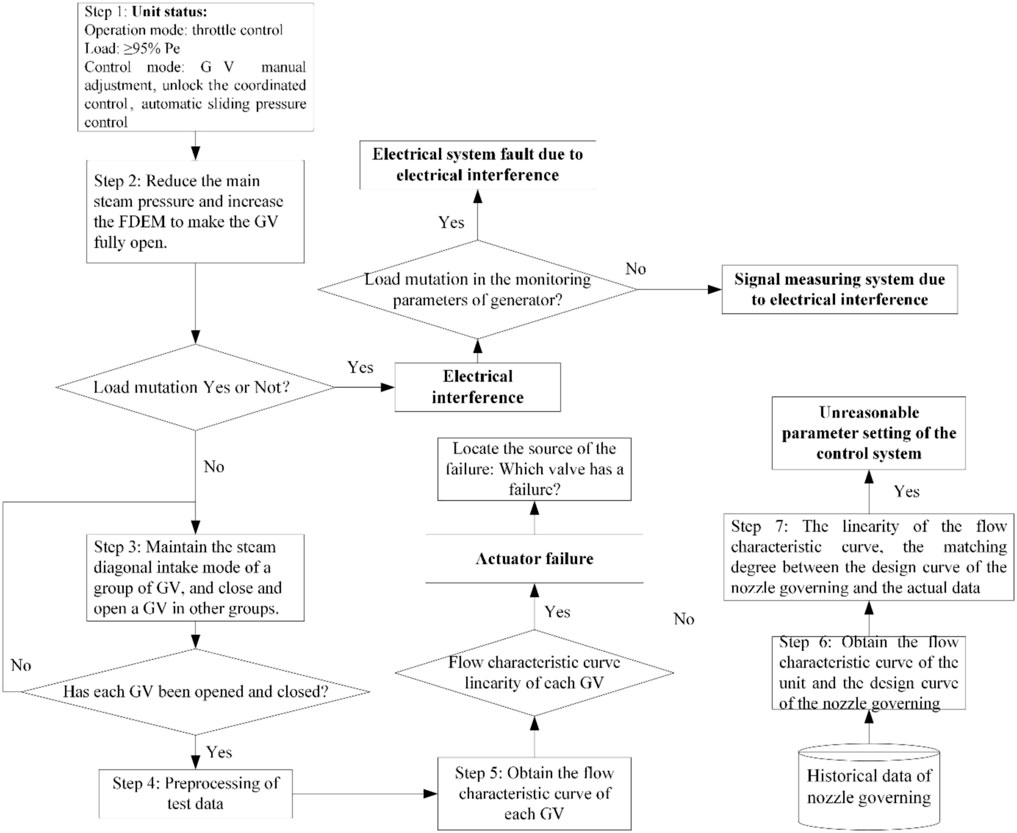
FIGURE 15. Method for load mutation fault diagnosis based on the GV activity test.
Step 1:. Switch the operation mode from throttle control to nozzle governing, according to the operating procedures when the unit is at a low load. Increase the unit load to 95%. Release the unit coordination control and automatic sliding-pressure operation.
Step 2:. Manually reduce the main steam pressure of the unit and simultaneously increase the FDEM based on a constant load. Thus, the four or six GVs are fully opened. Check whether the load mutation still occurs. If yes, conclude that the fault is caused by electrical interference. Further check whether the active power, excitation current, and voltage remain unchanged. If there is a load mutation problem, this electrical system failure is caused by electrical interference. Otherwise, the signal measurement system failure is caused by electrical interference.
Step 3:. Based on the above test results, change the control mode of the GV to manual adjustment if there is no load mutation failure. Hence, the opening of each GV can be adjusted manually. Subsequently, no less than two groups of two and three GVs will be used in the full-opening tests in the diagonal steam inlet mode.
Step 4:. The Frugal formula reflects the relationship between the stage pressure and stage flow under variable working conditions; that is, the actual flow. The actual flow ratio is calculated using the following formula:
where G is the rated flow rate, G′ is the flow rate under variable working conditions, P1 is the rated main steam pressure, P2 is the pressure after GV, P1’ is the main steam pressure under variable working conditions, P2’ is the pressure after GV under variable working conditions, t1 is the rated main steam temperature, and t1’ is the main steam temperature under variable working conditions.
Step 5:. According to the actual flow ratio obtained in Step 4, select the time interval data when only a single GV is active in the test to obtain the flow characteristics for each GV. Then the relationship between the valve lift ratio and the flow ratio of each GV is determined. The fault features are extracted to determine the wear fault and severity of the GV connectors: Check the flow characteristic curve to determine the relationship between the actual flow (%) and the valve lift of each GV. The GV does not have a hardware failure if the flow characteristic curve is continuous. However, the GV has a hardware failure if the characteristic curve slope has a sudden change or a no-flow interval. GVs have no no-flow interval without a pre-opening valve; thus, there should be no no-flow interval during the adjustment process.
Step 6:. If no GV shows a connecting wear fault and the deviation between the valve lift command and feedback of each GV is within the threshold range, then use historical operation data to obtain the flow characteristic calculations of the unit according to the Frugal formula. This integrated curve represents the relationship between the FDEM and steam flow ratio. The ideal slope of the flow characteristic curve is approximately 1 regardless of the FDEM region (Liu et al., 2022). If the curve is non-linear, the load mutation or oscillation problem is caused by unreasonable parameter settings of the control system.Then, collect the data recorded in the distributed control system (DCS) after the test and use it for accurate analysis. The collection time interval is 1 s. The data acquisition parameters include the valve lift for each GV (GV1–GV4), load, FDEM, main steam pressure, main steam temperature, steam pressure after GV, exhaust steam pressure of high-pressure cylinder, exhaust steam temperature of HP cylinder, steam temperature after the governing stage, #1–#3 bearing pad temperatures and vibrations, and oil pressure of the electro-hydraulic system (DEH).To ensure safe unit operation, the risk factors for the various possible operations should be fully considered during the test. Special attention should be given to the fact that the adjustment range of the GV opening in each step should be as small as possible to ensure the stability of the test process. Moreover, the test should be stopped immediately if abnormal vibration, bearing pad temperature, and vibration amplitude occur during a valve opening test. Subsequently, the next test is performed. In the experimental design process, the opposite-valve steam admission method can minimize the effects of the unbalanced steam flow force on the unit shaft system stability, ensuring the security of the test method.
5 Typical fault case analyses
5.1 Case 1: Test and analysis of a unit with four GVs
To prove the effectiveness of this method, this study performed fault diagnosis in an actual case of typical load mutation. Case 1 was a 300 MW unit with four GVs. The unit fault was diagnosed according to the method described above. The detailed test process is shown in Figure 16A. Independent opening and closing tests performed for each GV revealed a load mutation fault when GV1 and GV3 were opened at 30%. The steam pressure after the GS and actual load during the range 1880–1940 s of the test are shown in Figure 16B. At 1900–1910 s, the sudden load drop reaches approximately 25 MW. The calculated flow characteristic curves of each GV are shown in Figures 17, 18. Figure 17 demonstrates that the GV2 fault features are the most obvious, with both 25% and 10% of the no-flow fault regions. The main steam pressure, the pressure after GS, and the load all remained in a steady state during GV2 opening and closing. Figures 18A,B shows that GV3 and GV1 exhibited a 10% no-flow failure region. Since GVs do not have a pre-opening valve, they should not show a no-flow region during load adjustment. According to the method described in Section 3, an actuator hardware fault was identified, which indicated that this is a typical problem caused by hardware wear and tear. Figure 18C shows a normal characteristic curve of GV4 during the opening process.
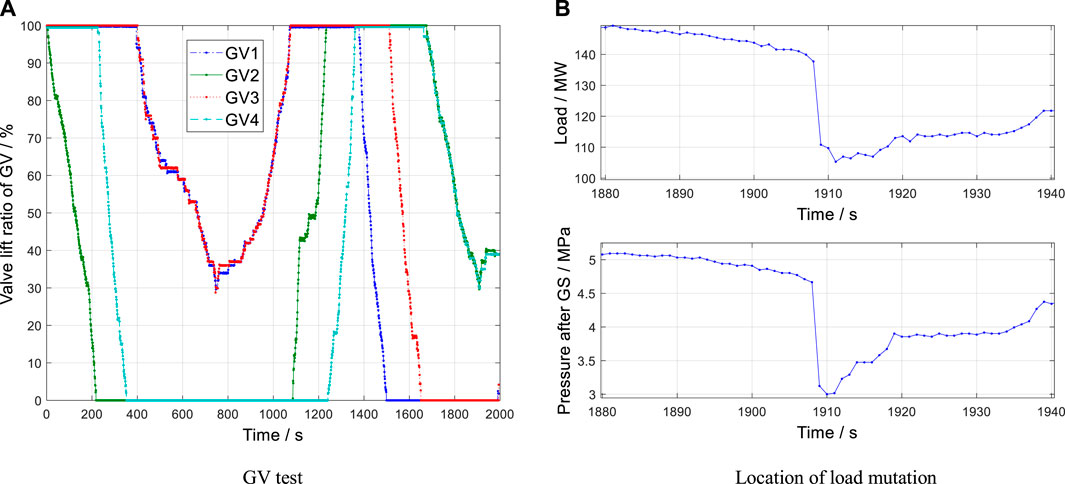
FIGURE 16. GV activity test process. (A) GV test. (B) Location of the load mutation.
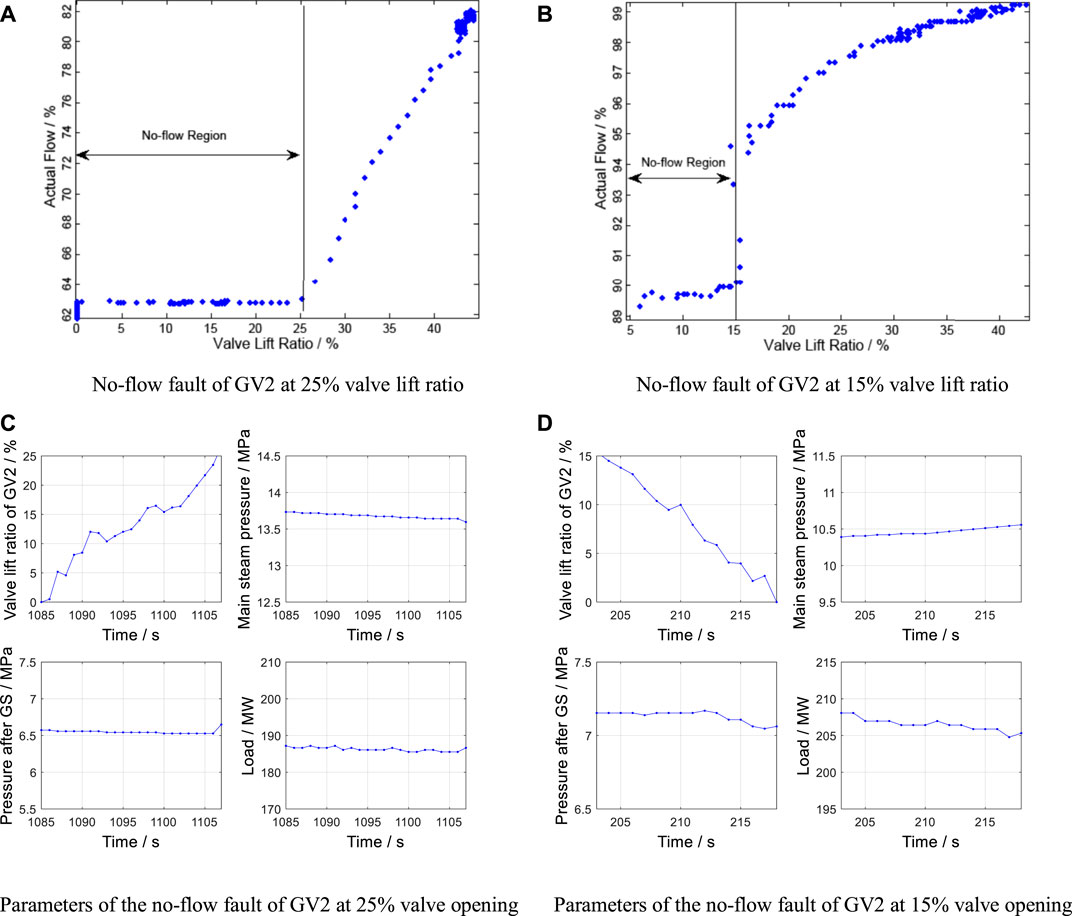
FIGURE 17. Operating parameters of GV2. (A) No-flow fault of GV2 at a 25% valve lift ratio (B) No-flow fault of GV2 at a 15% valve lift ratio. (C) Parameters of the no-flow fault of GV2 at a 25% valve opening (D) Parameters of the no-flow fault of GV2 at a 15% valve opening.
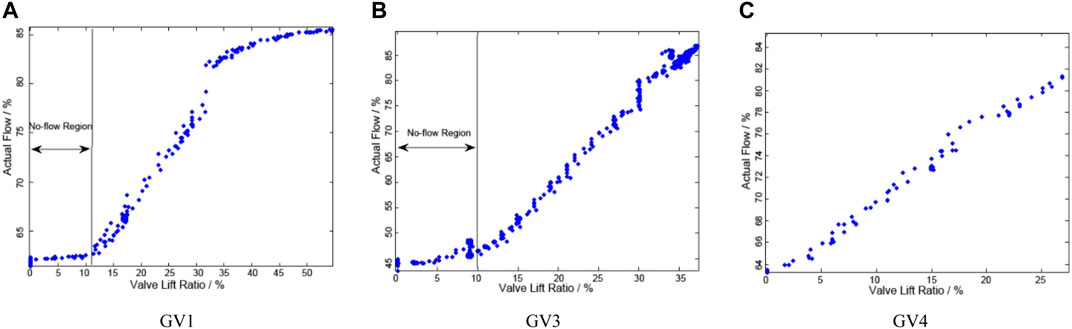
FIGURE 18. Relationships between the actual flow and valve lifts of GV1, GV3, and GV4. (A) GV1. (B) GV3. (C) GV4.
5.2 Case 2: Test and analysis of a unit with six GVs
This case is a 300 MW unit equipped with six GVs. Load mutation was observed during its operation. As shown in Figure 19A, the load mutation reached a maximum of 4.5 MW. The fault diagnosis was carried out according to the above method. The detailed test process is shown in Figure 19B. According to the GV activity test data, the flow characteristic curves of each GV were obtained, as shown in Figures 19C–H. This fault was not an actuator failure because the curve for each GV is reasonable. Figure 19I, the steam admission characteristic curve according to the historical data in the throttle control mode, shows strong nonlinearity. The curve slope of FDEM in the 76%–79% range is about 2.5 times that of other ranges. Thus, this load mutation failure was caused by poor unit flow characteristics. Figure 19J shows the valve lift of each GV corresponding to Figure 19A, in which the valve lift frequently changes due to the unit flow characteristics, which in turn causes unit load oscillation.
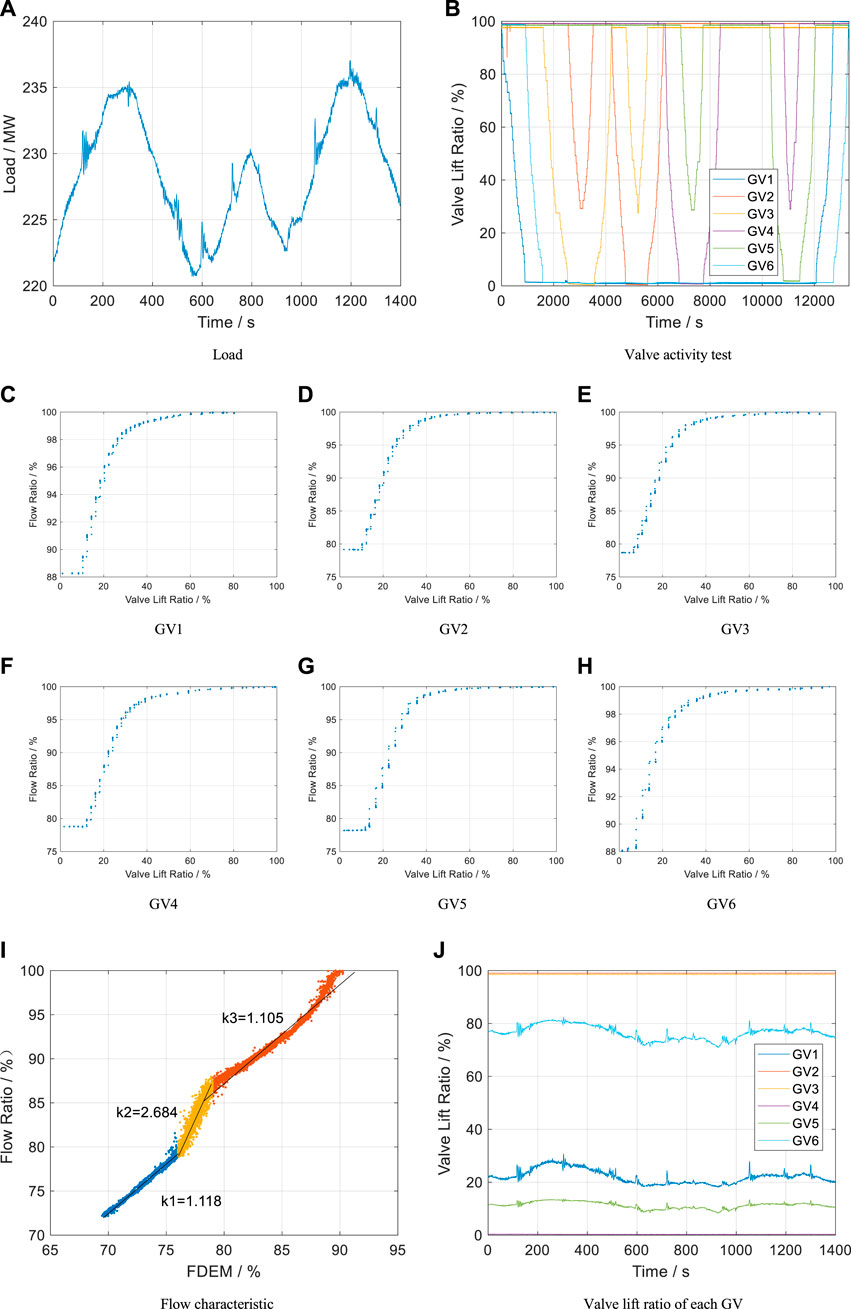
FIGURE 19. 6 GVs activity test. (A) Load. (B) Valve activity test. (C) GV1. (D) GV2. (E) GV3. (F) GV4. (G) GV5. (H) GV6. (I) Flow characteristics. (J) Valve lift ratio for each GV.
6 Conclusion
Based on several actual cases in steam turbines, this study first defined and analyzed the reasons for the load mutations, performed a systematic mechanism analysis of the three typical load mutations, and summarized the representation of faults. The results of the theoretical analysis and experimental studies showed that unreasonable parameter setting of the flow characteristic curve, the electrical interference. and governing valve unsmooth stagnation such as weak connection and wear, could cause load mutations.
1. This study provided a clear definition of load mutation based on the unit capacity and grid-connected rules, especially the adjustment accuracy of the AGC. Subsequently, the important causes categories of load mutation; i.e., unreasonable parameter setting of the load control system, actuator hardware failure, sensor fault, and electrical interference, were discussed in detail.
2. A non-linear flow characteristic curve of the actuator hardware failure can cause load mutation, whose frequency is second only to the control system failure.
3. The signal measurement and electrical systems can also cause load mutation while electrical interference acts on these systems. The load mutation caused by electrical interference causes the load control system to follow the adjustment for the abnormal load signal. Electrical interference could cause two load mutations for electrical systems: pulse and oscillation. These faults are all accompanied by abnormal fluctuations of the generator parameters, such as excitation current or voltage.
4. Using the results of the systematic mechanism analysis of load mutation faults, a fault diagnosis method based on historical data and GV activity tests was developed to locate the fault in the steam turbine according to the differences between various fault features. The effectiveness of this diagnostic method was verified by two actual fault cases. This method quickly and effectively located the fault type in the actual operating environment and has good practical application value.
The results of the systematic analysis of load mutation faults in this study highlight the need for future studies on online monitoring and early warning algorithms for load mutation faults. These algorithms can reduce the losses caused by failure by identifying fault features or early signs of unreasonable parameters of the flow characteristic curve, as well as actuator hardware failure and electrical interference. Moreover, the steam turbine and generator are essential equipment in combined cycle power plants (CCPPs); therefore, the problem of load mutation faults in steam turbines and generators must also exist in CCPP. However, the rapid adjustment characteristics of the gas turbine make the load mutation diagnosis more complicated, especially in signal-shaft CCPP. The present study comprehensively considered the adjustment characteristics of the gas turbine and assessed load mutations of the steam turbine. Additional studies are needed to evaluate the load mutation for CCPP.
Data availability statement
The raw data supporting the conclusion of this article will be made available by the authors without undue reservation.
Author contributions
HW and SF: data collection; KY and YW: manuscript writing and revision; YC and JW: overall reviewing.
Funding
This work was supported by the National Key R&D Program of China (Grant No. 2017YFB0902100), the China Postdoctoral Science Foundation (Grant No. 2021T140154), and the CERNET Innovation Project (No. NGIICS20190801).
Conflict of interest
HW was employed by Zhejiang Energy Technology Research Institute Co, Ltd.
The remaining authors declare that the research was conducted in the absence of any commercial or financial relationships that could be construed as a potential conflict of interest.
Publisher’s Note
All claims expressed in this article are solely those of the authors and do not necessarily represent those of their affiliated organizations or those of the publisher, the editors, and the reviewers. Any product that may be evaluated in this article or claim that may be made by its manufacturer is not guaranteed or endorsed by the publisher.
References
Chen, H., Jiang, B., and Lu, N. (2018). A multi-mode incipient sensor fault detection and diagnosis method for electrical traction systems. Int. J. Control Autom. Syst. 16 (4), 1783–1793. doi:10.1007/s12555-017-0533-0
Hu, Q., Zhang, S., Yu, M., and Xie, Z. (2015). Short-term wind speed or power forecasting with heteroscedastic support vector regression. IEEE Trans. Sustain. Energy 7 (1), 241–249. doi:10.1109/TSTE.2015.2480245
Jin, G., Cai, S., and Deng, S. (2019). The impact research of delay time in steam turbine DEH on power grid. J. Phys. Conf. Ser. 1187 (2), 022031. doi:10.1088/1742-6596/1187/2/022031
Jin, G., Yan, H., Deng, S., Chen, X., and Cai, Z. (2013). Analysis of nonlinear characteristics of turbine governor and its impact on power system oscillation. Energy Power Eng. 5 (04), 746–750. doi:10.4236/epe.2013.54B144
Li, J., Pan, K., and Su, Q. (2019). Sensor fault detection and estimation for switched power electronics systems based on sliding mode observer. Appl. Math. Comput. 353, 282–294. doi:10.1016/j.amc.2019.02.010
Li, J., Xin, Y., Hu, B., Zeng, K., Wu, Z., Fan, S., et al. (2021). Safety and thermal efficiency performance assessment of solar aided coal-fired power plant based on turbine steam double reheat. Energy 226, 120277. doi:10.1016/j.energy.2021.120277
Li, X., Liu, J., Bai, M., Li, J., Li, X., Yan, P., et al. (2021). An LSTM based method for stage performance degradation early warning with consideration of time-series information. Energy 226, 120398. doi:10.1016/j.energy.2021.120398
Li, X., Liu, J., Li, J., Li, X., Yan, P., and Yu, D. (2020). A stacked denoising sparse autoencoder based fault early warning method for feedwater heater performance degradation. Energies 13 (22), 6061. doi:10.3390/en13226061
Li, X., Zou, Y., Wan, J., Cheng, J., Liu, J., Yan, P., et al. (2016). “Study on failure characteristics and solutions for large turbine load oscillation,” in 2016 IEEE advanced information management, communicates, electronic and automation control conference (IMCEC) (IEEE), 1321–1325. doi:10.1109/IMCEC.2016.7867427
Li, Y., Huang, S., Pan, J., Yang, T., and Gao, W. (2016). The impact research of control modes in steam turbine control system (digital electric hydraulic) to the low-frequency oscillation of grid. Adv. Mech. Eng. 8 (1), 168781401562483. doi:10.1177/1687814015624835
Liu, J., Zhang, Y., and Qi, J. (2022). Operation optimization analysis of 600 MW steam turbine under new situation. J. Phys. Conf. Ser. 2296 (1), 012020. doi:10.1088/1742-6596/2296/1/012020
Lugovoy, O., Gao, S., Gao, J., and Jiang, K. (2021). Feasibility study of China's electric power sector transition to zero emissions by 2050. Energy Econ. 96, 105176. doi:10.1016/j.eneco.2021.105176
Ma, L., Xu, J. Q., Dong, X. Y., and Yang, T. (2013). The influence of overlap degree research on nozzle governing characteristic. Energy Power Eng. 5 (04), 642–645. doi:10.4236/epe.2013.54b124
Papaelias, M., García Márquez, F. P., and Ramirez, I. S. (2018). “Concentrated solar power: Present and future,” in Renewable energies (Cham: Springer), 51–61. doi:10.1007/978-3-319-45364-4_4
Pondini, M., Signorini, A., and Colla, V. (2017). Steam turbine control valve and actuation system modeling for dynamics analysis. Energy Procedia 105, 1651–1656. doi:10.1016/j.egypro.2017.03.539
Sheng, K., and Zheng, Z. (2019). “Online monitoring and optimization method for power oscillation control of steam turbine,” in 2019 IEEE 3rd conference on energy internet and energy system integration (EI2) (IEEE), 354–358. doi:10.1109/EI247390.2019.9062163
Sun, Y. Y. (2017). “Study on valve management of nozzle governing steam turbine,” in 2017 29th Chinese control and decision conference (CCDC) (IEEE), 891–894. doi:10.1109/CCDC.2017.7978646
Tan, J. (2015). “Simulation analysis of impacts of flow characteristics on power oscillation,” in Proceedings of the second international conference on mechatronics and automatic control (Cham: Springer), 317–323. doi:10.1007/978-3-319-13707-0_35
Tani, A. (2017). “Steam turbine design for load-following capability and highly efficient partial operation,” in Advances in steam turbines for modern power plants (Sawston, Cambridge: Woodhead Publishing), 153–164. doi:10.1016/B978-0-08-100314-5.00008-7
Topel, M., and Laumert, B. (2018). Improving concentrating solar power plant performance by increasing steam turbine flexibility at start-up. Sol. Energy 165, 10–18. doi:10.1016/j.solener.2018.02.036
Wang, J., Ma, Q., Zhong, J., and Gou, X. (2018). Mechanism research on active power fluctuation caused by steam turbine valve test. Electr. Eng. 100 (3), 2147–2154. doi:10.1007/s00202-018-0693-9
Wang, J., Zhong, J., Zhang, J., and Wang, S. (2016). Analysis and disposal of forced power oscillation in the transfer process of governor valve mode of turbine's operation. Electr. Power Components Syst. 44 (2), 185–192. doi:10.1080/15325008.2015.1102987
Wang, W., Zeng, D., Liu, J., Niu, Y., and Cui, C. (2014). Feasibility analysis of changing turbine load in power plants using continuous condenser pressure adjustment. Energy 64, 533–540. doi:10.1016/j.energy.2013.11.001
Xuanyin, W., Xiaoxiao, L., and Fushang, L. (2010). Analysis on oscillation in electro-hydraulic regulating system of steam turbine and fault diagnosis based on PSOBP. Expert Syst. Appl. 37 (5), 3887–3892. doi:10.1016/j.eswa.2009.11.029
Yao, K., Fan, S., Wang, Y., Wan, J., Yang, D., and Cao, Y. (2022). Anomaly detection of steam turbine with hierarchical pre-warning strategy. (London, United Kingdom: IET generation (Transmission & Distribution)). doi:10.1049/gtd2.12452
Keywords: steam turbine, load mutation, load oscillation, governing valve, electrical interference, actuator hardware failure
Citation: Yao K, Wang Y, Fan S, Wan J, Wu H and Cao Y (2022) Fault mechanisms and diagnosis methods for typical load mutation problems of turbo-generator sets. Front. Energy Res. 10:981598. doi: 10.3389/fenrg.2022.981598
Received: 29 June 2022; Accepted: 01 August 2022;
Published: 06 September 2022.
Edited by:
Junhui Li, Northeast Electric Power University, ChinaReviewed by:
Tian Qiu, North China Electric Power University, ChinaShaowei Qing, Chongqing University, China
Copyright © 2022 Yao, Wang, Fan, Wan, Wu and Cao. This is an open-access article distributed under the terms of the Creative Commons Attribution License (CC BY). The use, distribution or reproduction in other forums is permitted, provided the original author(s) and the copyright owner(s) are credited and that the original publication in this journal is cited, in accordance with accepted academic practice. No use, distribution or reproduction is permitted which does not comply with these terms.
*Correspondence: Jie Wan, d2FuamllQGhpdC5lZHUuY24=