- 1Department of Physical, Ecodynamics Group, Earth and Environmental Sciences, University of Siena, Siena, Italy
- 2INDACO2 srl, Colle di Val d’Elsa, Siena, Italy
- 3Department of Architecture, University of Florence, Florence, Italy
The present work evaluates the environmental performance of three wave energy converters including on-shore oscillating water columns and oscillating floaters embedded in piers, and near-shore seabed-based buoys in the Mediterranean Basin. The life cycle assessment methodology was used to account for their potential environmental impact, in terms of carbon footprint (t CO2eq), considering four main phases, i.e., manufacturing of material components, assembling and installation on site, maintenance in time, and decommission end of life. Results show the greenhouse gas emission from different lifecycle processes, based on the inventory of main energy inputs and materials, highlighting the major impact of the manufacture of the structural components (52 %), especially due to the limited durability of materials. In order to compare the performances of the three different wave energy converters, the carbon intensity of electricity was evaluated considering a range of electricity production per technology based on data available in scientific literature. The results obtained for a single device (203–270 g CO2eq‧kWh−1 for the oscillating water column system; 94–374 g CO2eq‧kWh−1 for oscillating floater and 105–158 g CO2eq‧kWh−1 for the seabed-based buoy) highlight that wave energy converters are promising solutions to harvest wave energy, showing lower carbon intensity of electricity values compared to fossil energy sources; nevertheless, technological improvements are needed to increase efficiency and achieve the performances of other renewable energy sources. Moreover, the combination of wave energy converters with other solutions, such as offshore wind turbines, represents a valuable option in the future to increase productivity and foster energy transition of the Mediterranean regions.
1 Introduction
Blue economy includes all those activities that are marine-based or marine-related (European Commission (EC), 2021); particularly, one of the emerging and innovative sectors is Marine Renewable Energy (MRE). Marine energy, also called ocean energy, is seawater-based renewable energy in which the kinetic and potential energies in tides, waves, and currents are used to drive systems to produce electricity (Mohamed, 2021). Climate change and environmental degradation are an existential threat to Europe and the world; for this reason, MRE could be a key in meeting the European green deal targets supporting economic growth, energy transition, and job opportunities (Pirttimaa and Cruz, 2020).
The European Commission (EC) proposed to raise the European Union’s ambition on reducing greenhouse gas (GHG) emissions to at least 55 % below the levels of 1990 by 2030 and to achieve climate neutrality by 2050 (European Commission (EC), 2022). To this purpose, the transition to a competitive economy with low carbon emissions requires higher rates of renewable energy and ocean energy can play a relevant role (Appiott et al., 2014).
Ocean energy technologies are currently being developed and tested to exploit the vast source of energy that seas and oceans have to offer (European Commission (EC), 2021), theoretically over 30,000 TWh‧year−1 globally (Liu et al., 2017). Although in many cases they are still at the early stage of development and not yet commercially available, wave and tidal energy converters have been widely tested in the last years (Falcão, 2010; Douziech et al., 2016).
Wave power represents a considerable source of renewable energy, nevertheless, most of the Wave Energy Converters (WECs) developed still require further research and demonstration tests (Apolonia and Simas, 2021). As highlighted by Esteban et al. (2017), the technology behind WECs is not mature enough to be developed industrially and the Levelized Cost of Energy (LCOE) remains too high. According to International Renewable Energy Agency (IRENA) (2020), currently, 33 WECs with a combined capacity of 2.3 MW are deployed in 9 projects across 8 countries and 3 continents. France, Gibraltar, Greece, Israel, Italy, Portugal, and Spain are examples of Mediterranean locations in which these projects are activated.
Since the real-life applications of WECs are currently limited (Zhai et al., 2018), their environmental performance and potential impacts are not well known. In this context, the Life Cycle Assessment (LCA) can be a proper methodology to account for the potential environmental impacts characterizing WECs throughout the value chain. From the extraction of raw materials to the production of structural elements, their assembling on site, maintenance in time, end-of-life management, recycling, and final disposal, the LCA examines and quantifies the amount of GHG emissions from the different stages. The results allow for evaluating the environmental performance of different devices, identifying solutions to improve efficiency and address choices. At the same time, it permits the comparison with other technologies with equivalent functions in order to select those with lower environmental impacts (Paredes et al., 2019).
In recent years, LCA was applied to assess the environmental performances of different WEC technologies, each able to harvest wave energy and generate electricity. Generally, WECs are conceptualized to absorb kinetic energy, mainly through moving bodies, potential energy, through overtopping devices or attenuators, or both through point absorbers (International Renewable Energy Agency (IRENA), 2020). These systems are classified according to different criteria such as location, device size, orientation, conversion principle, energy capture, energy use, and installation site (Koca et al., 2013; Khan et al., 2017).
The aim of this study is to evaluate, through an LCA-based analysis, the Carbon Footprint (CF), expressed in ton of carbon dioxide equivalent (t CO2eq) of three WECs and their adaptability to the Mediterranean contest. These include two onshore devices embedded in piers or docks, namely Oscillating Water Column (OWC) and Oscillating Floater, and a near-shore seabed-based buoy.
A literature review of the most relevant LCA studies of onshore and offshore WECs was conducted (Table 1). To allow an easy comparison among WECs, the corresponding Carbon Intensity of Electricity (CIE) was reported as well, namely the CO2eq emissions generated by the life cycle of each WEC with its average annual productivity (MWh). This performance indicator permits to compare the GHG emission mitigation effect of different solutions, as lower CIE values indicate lower impacts per unit of energy produced. Calculating the CIE allows us to highlight the profitability, in the long run, of those projects that enable producing clean energy with lower emissions. CIE is, in fact, an intensive indicator that allows for adding information to the mere environmental cost assessment of any technology. Results of CIE should complement the information that drives the decision on these plant installations, such as the type of construction technique, the operating principle, and the meteorological characteristics of the hypothetical installation site.
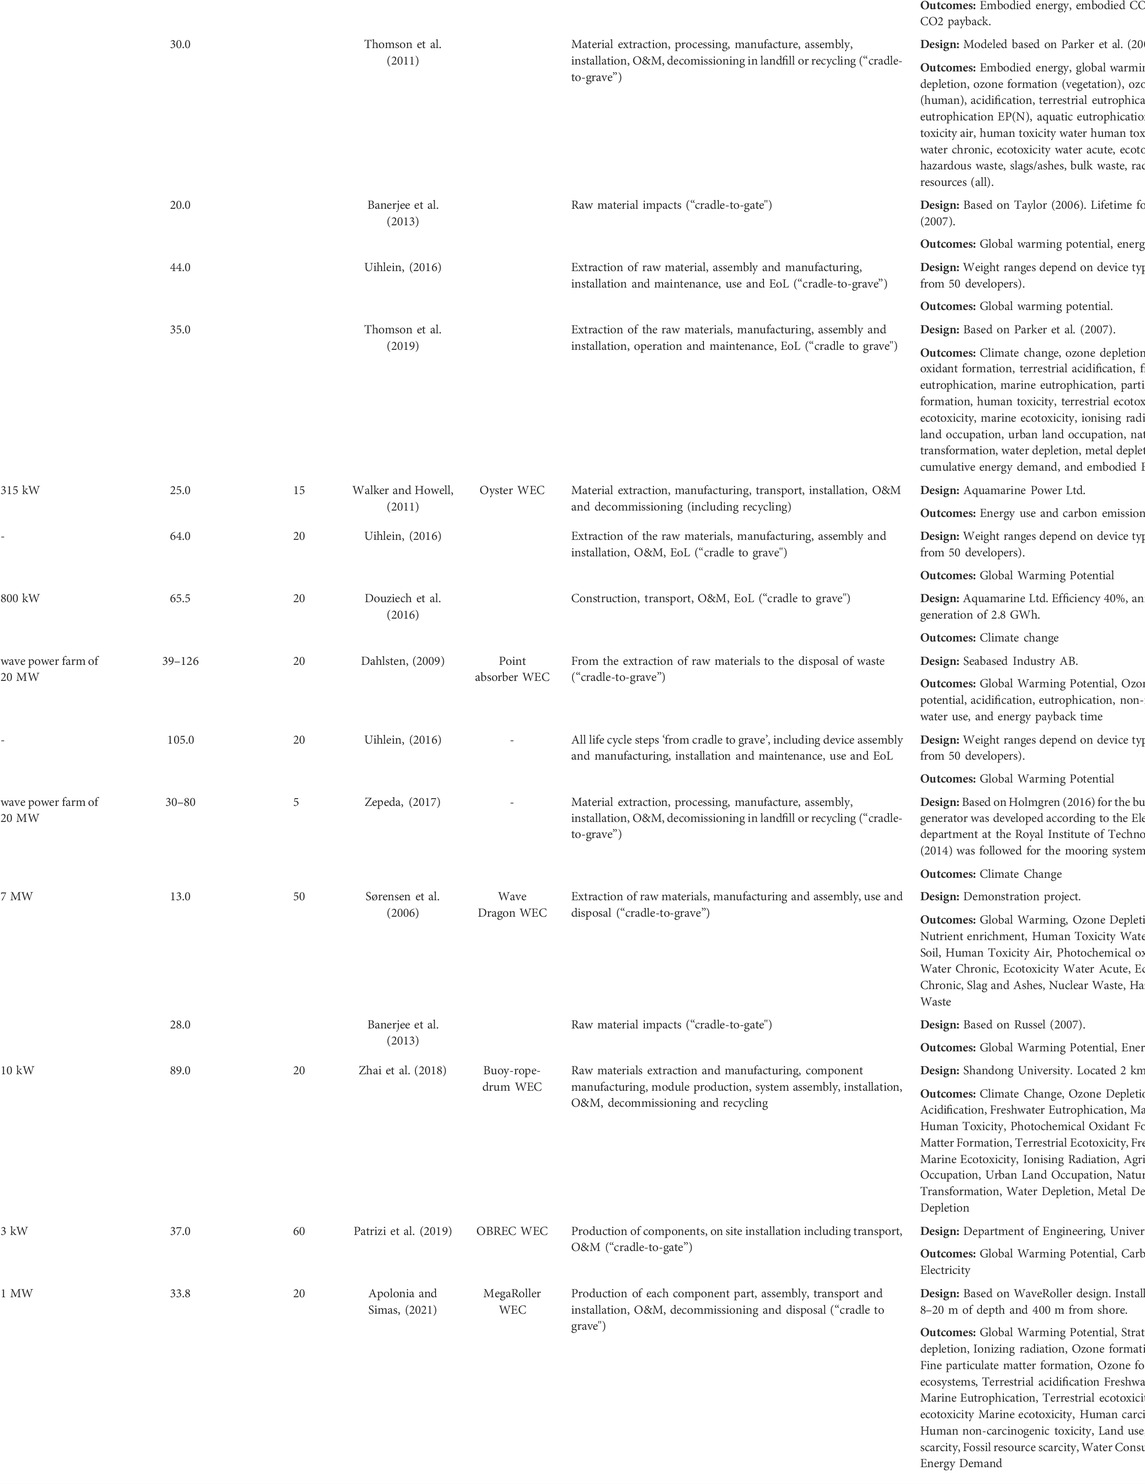
TABLE 1. Literature review of previous LCA studies on WECs and focus on the Carbon Intensity of Electricity (CIE) (g CO2eq·kWh−1) evaluation.
Table 1 also gives information on the technical characteristics, nominal power (in MW), and LCA phases considered (system boundary) to account for the CIE values per each WEC.
Paredes et al. (2019) conducted a systematic review of LCA of ocean energy technologies and highlighted that the manufacture of structural materials (e.g., steel), mooring and foundations, and the shipping operations have the greatest impact on the total CO2 emissions (between 40–95 % of the total emissions).
Uihlein (2016) carried out the LCA of 180 ocean energy technologies, which confirmed that environmental impacts were closely linked to the material inputs for mooring, foundations, and structural components while the impacts from assembly, installation, and use were negligible for all types.
Through the LCA of a near-shore WEC tested in Sweden, namely Seabased, Dahlsten (2009) highlighted that the potential environmental impact of the buoy that mainly stemmed from the manufacturing phase. In particular, the production of steel parts makes a large contribution (around 50 %) to the overall results.
In addition, the LCA of the WEC buoy conducted by Zepeda (2017) observed the highest contribute to the climate change impact category which was due to the mooring system (16 %) and the polyurethane buoy (60 %).
Walker and Howell (2011) evaluated the CO2 emissions of the Oyster WEC in Scotland, analyzing all stages involved in its life cycle from cradle-to-grave, taking raw materials as a starting point, and disposal of waste as an end point (Walker and Howell, 2011). The study has shown that the material manufacture phase represents more than 95 % of the total emission.
Douziech et al. (2016) quantified the potential environmental impacts of three tidal stream devices, one tidal range plant, and the Oyster wave energy system and concluded that the construction and end of life (EoL) burden phases dominated the values of the impact categories assessed, including climate change.
The LCA of the Wavestar technology, studied for the Irish site of Belmullet, confirmed that the phase that covered the extraction of the raw materials up to the manufacturing and assembly of the device was the most intensive one with the greatest impact (Dalton et al., 2014).
Zhai et al. (2018) conducted a LCA for a buoy–rope–drum WEC installed 2 km off the shore at Weihai, Shandong (China), and demonstrated that the most significant environmental impact contributor was the manufacturing stage, due to the consumption of energy and materials.
Patrizi et al. (2019) evaluated the overtopping breakwater WEC, named OBREC, installed in the Naples harbor (Italy), showing that 82 % of the total CO2 emissions was due to the use of materials for the construction components (including structural elements, ramp, foundations, and cables for the connection to the grid).
A preliminary LCA of the Portuguese MegaRoller WEC conducted by Apolonia and Simas (2021) also confirmed the main environmental contribution of material use and the manufacture stage.
Thomson et al. (2019) presented a full LCA of the first-generation Pelamis WEC, designed for the northwest coast of Scotland. The assessment built on previous studies carried out on the same device (Parker et al., 2007; Thomson et al., 2011; Banerjee et al., 2013) showed the greatest impacts of steel manufacture and diesel for sea vessel operations, particularly for maintenance. The study also highlighted the opportunities to reduce environmental impacts considering the reduction of steel quantity in future design developments or increasing the recycled content of this material. Moreover, refining the Pelamis design and selecting an installation site nearer to a port could reduce the impacts of sea vessel operations.
As the aim of our research was not focused on devices designed for targeted locations and produced by specific companies, but dedicated to the identification of a design benchmark for WECs, 3D digital models were created according to Pulselli et al. (2022). Their work created a benchmark for the design of two models of offshore floating wind turbines, and instead of specific devices with many variables, technological standards for the type, size, installed power, and use were elaborated. Based on a systematic comparison with what already exists in the literature, our study tried to apply the same modus operandi for the wave energy sector. Therefore, this work can contribute to overcoming the variability between deployed and planned projects which, in addition to providing energy security to countries located close to the sea, can help to reduce GHG emissions (Sgobbi et al., 2016).
The second part of the study was focused on the assessment of CIE values, measured in g CO2eq‧kWh−1, for each WEC. The range of electricity production values, based on tested devices like those modeled and suited to the Mediterranean context, were assumed to obtain data comparable with the performance of other technologies that produce energy both from renewable and fossil sources.
2 Materials and methods
The WEC systems analyzed convert wave-induced oscillations from mechanical energy to electricity, through the core component named power take-off (PTO) mechanism.
The first device is an onshore air compression system capable of capturing wave energy using an OWC-operating principle (Figure 1A). The basic unit is a reinforced concrete caisson that can be incorporated into a traditional breakwater or, according to Curto et al. (2021), integrated into a floating device. In this article, the first case is considered. This system transforms harbor dams, from passive structures for the protection of the port, into active structures for energy production. Each caisson hosts an absorption chamber in which a sea wave produces a vertical water oscillation (Curto et al., 2021). This movement generates an air pocket that compresses and decompresses cyclically driving an air turbine–generator pair with consequent electricity production. According to Ibarra-Berastegi et al. (2018), the self-rectifying Wells turbine 2.83 m high, weighs around 1,200 kg, and a diameter of 1.25 m was assumed. To ensure the stability of the structure, the dredged material from the excavations (i.e., gravel) for the insertion of the caissons was used for the ballast. The installation procedures can be carried out in safer environmental conditions and with reduced maintenance costs due to the onshore location. The proximity to the power grid and the absence of deep-water moorings are further advantages for its implementation. In order to find an average value of materials and determine an estimate of productivity, one reference for the present study was a 296 kW OWC plant composed of 16 chambers with a length of 100 m, inaugurated in the bay of Mutriku (Spain) in 2011 (Lacasa et al., 2019). Another one was the full-scale plant REWEC 3 (REsonant Wave Energy Converter) developed in Italy by the University of Reggio Calabria and installed in the port of Civitavecchia. It is composed of 136 chambers and has a rated power of 2.5 MW (Cascajo et al., 2019). In addition, WHT (Wave Hydro Turbine) is another example of an onshore solution working inside an OWC. In contrast to the first two cases, WHT is a prototype system installed and tested on the breakwaters of the port of Cartagena (Spain) (BLUE DEAL MED, 2022a).
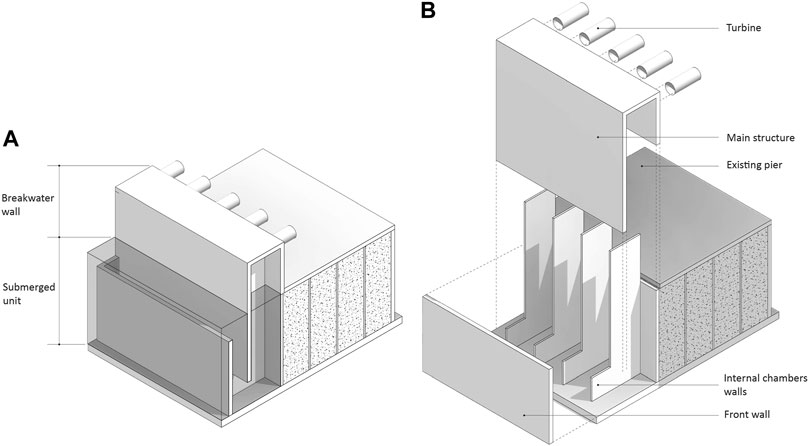
FIGURE 1. The onshore OWC 3D model (A) and its main construction elements (B). Legend and values: breakwater wall height = 6 m; submerged unit height = 10 m.
The second WEC considered in this benchmarking assessment is the onshore oscillating floater (Figure 2A) which converts the rising and falling motions of waves into energy. The floater, designed based on existing real cases, was assumed to be anchored to an existing pier or dock. Its movement actives a hydraulic piston with moving valves and a linear alternating motion conversion system that moves the internal generators to produce energy (BLUE DEAL MED, 2022b). This energy conversion system follows the example of the Seadamp FX ® technology designed by Seareas Company. Electricity produced is further transferred into the grid. This WEC can be potentially installed in series to generate electricity from waves having a height between 0.5 and 3 m. As for the previous case, the installation, operation, and maintenance activities do not require divers, underwater cabling, and mooring. One important reference for the floater’s modeling was the EWP (Eco Wave Power) system installed in Gibraltar with a rated power of 100 kW that was planned to achieve 5 MW of installed power (Cascajo et al., 2019). A second example was the pilot technology called EDS (Energy Double System), a near-shore point absorber WEC composed of a heaving float and a surging paddle developed by the Politecnico of Milan and Tecnomac Company (Marchesi et al., 2020). In addition, Wavestar is another example of a plant composed of 20 buoys (10 m diameter), arranged in two lines, and being able to extract until 6 MW according to the climatic conditions of the North Sea (Curto et al., 2021).
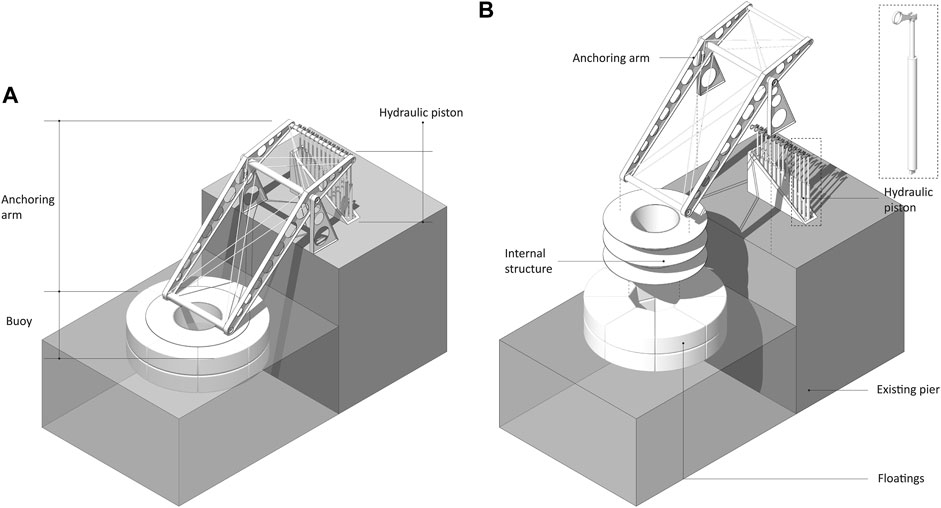
FIGURE 2. The onshore oscillating floater 3D model (A) and its main construction elements. (B) Legend and values: buoy diameter = 5 m; anchoring arm height = 6 m.
The last WEC examined is a near-shore seabed-based buoy (Figure 3A) located 2 km from the coast in shallow waters, as described by Short (2012). The main reference device was the third generation of Seabased’s patented technology developed at Uppsala University (Sweden), with a rated power of 30 kW (Leijon et al., 2008; Hultman et al., 2014). The system is composed of a floating body connected via a steel wire to a linear PTO generator lying on the seabed. This submerged unit anchored with a gravity-based foundation converts the buoy kinetic energy to electricity through an enclosed piston that moves up and down driven by the oscillating motion of waves (Lissandrom, 2010). The composition of the direct driven magnetic part of the generator, the translator, was modeled following the study of Dahlsten (2009). To promote the reduction of material and production costs, the translator was assumed to be designed with a ferrite magnet, replacing the previous neodymium (NdFeB) magnet, which was less impactful and cheaper, even if less stronger (Chatzigiannakou et al., 2014; Hultman et al., 2014). The device works as a point absorber able to exploit energy independently of wave direction due to the small sizes in comparison with the wavelength (Curto et al., 2021). The modular design allows the implementation of wave energy power parks, where several buoys are interconnected in a marine substation that pulls the generated electricity and transmits it to the shore (Hong et al., 2013). For the installation activities, buoys can be assembled on-shore and transported on-site by a specialized vessel equipped with a crane to be arranged in clusters. The work of a diver’s crew permits is to make the proper underwater cable connections and disconnect slings and shackles attached to the foundation (Chatzigiannakou et al., 2017).
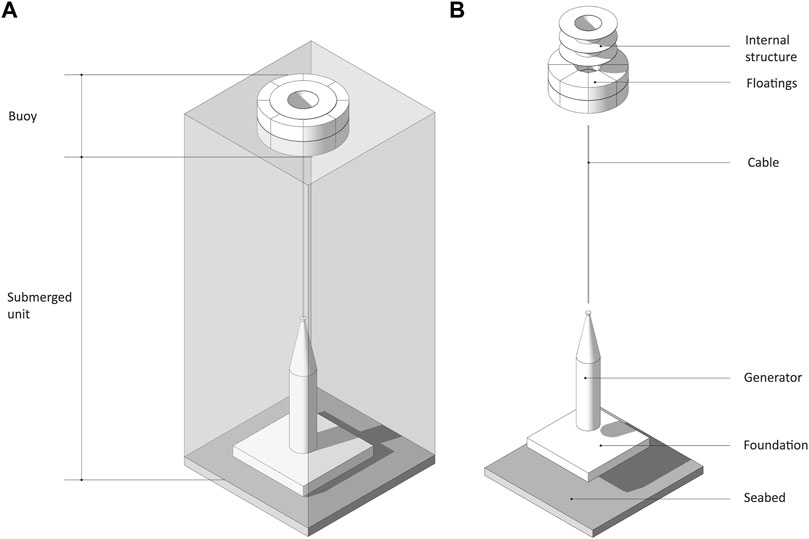
FIGURE 3. The near-shore seabed-based buoy 3D model (A) and its main construction elements. (B) Legend and values: buoy height = 1.5 m; buoy diameter = 5 m; submerged unit (cable and generator) height = 22 m.
In compliance with International Standard Organisation 14040 (ISO, 2006) and 14044 (ISO, 2020), LCA was used to account for the input and output flows and evaluate the potential environmental impacts of the three WECs from their production to the disposal stage. The CF of each device was assessed using the SimaPro 9.1.1 software (PRé Consultants, 2020) to model the inventory and carry out the Life Cycle Impact Assessment. According to Pulselli et al. (2022), the data inventory for each technology was based on the combined use of digital 3D models and literature data. Particularly, 3D models were developed to obtain a more precise quantification of the material volumes involved constituting the different components of each system. The models explored in Figure 1B, Figure 2B, Figure 3B show the characteristics and dimensions of the WECs analyzed including the details of each component, while Table 2, Table 3, and Table 4 describe the related Life Cycle Inventory data.
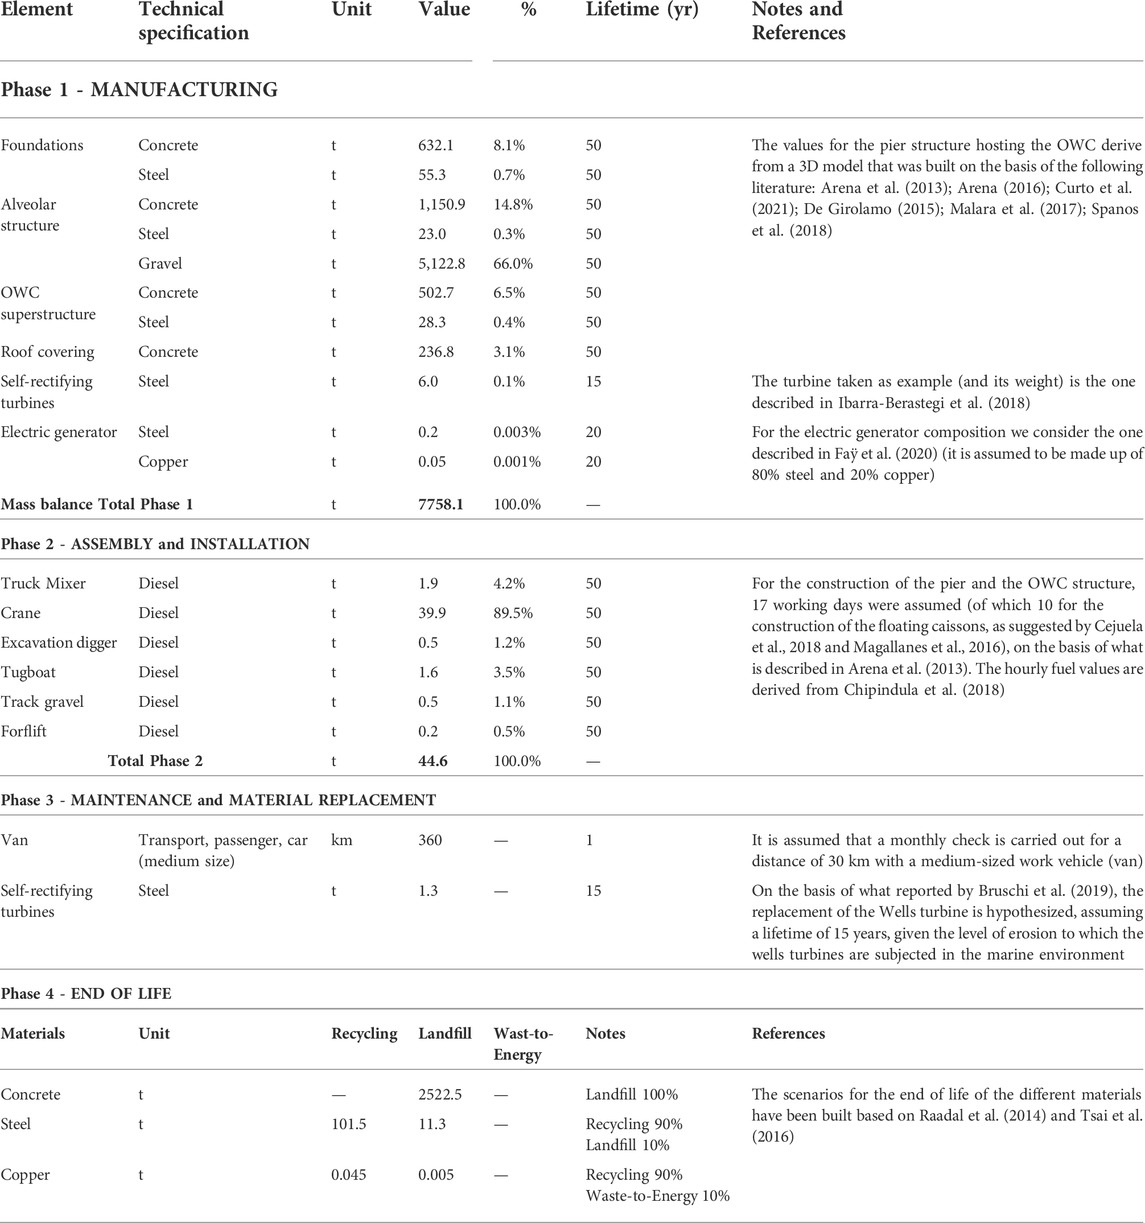
TABLE 2. Life Cycle Inventory data for a 20 m breakwater hosting 5 generic OWC systems. Values in bold represent totals and subtotals.
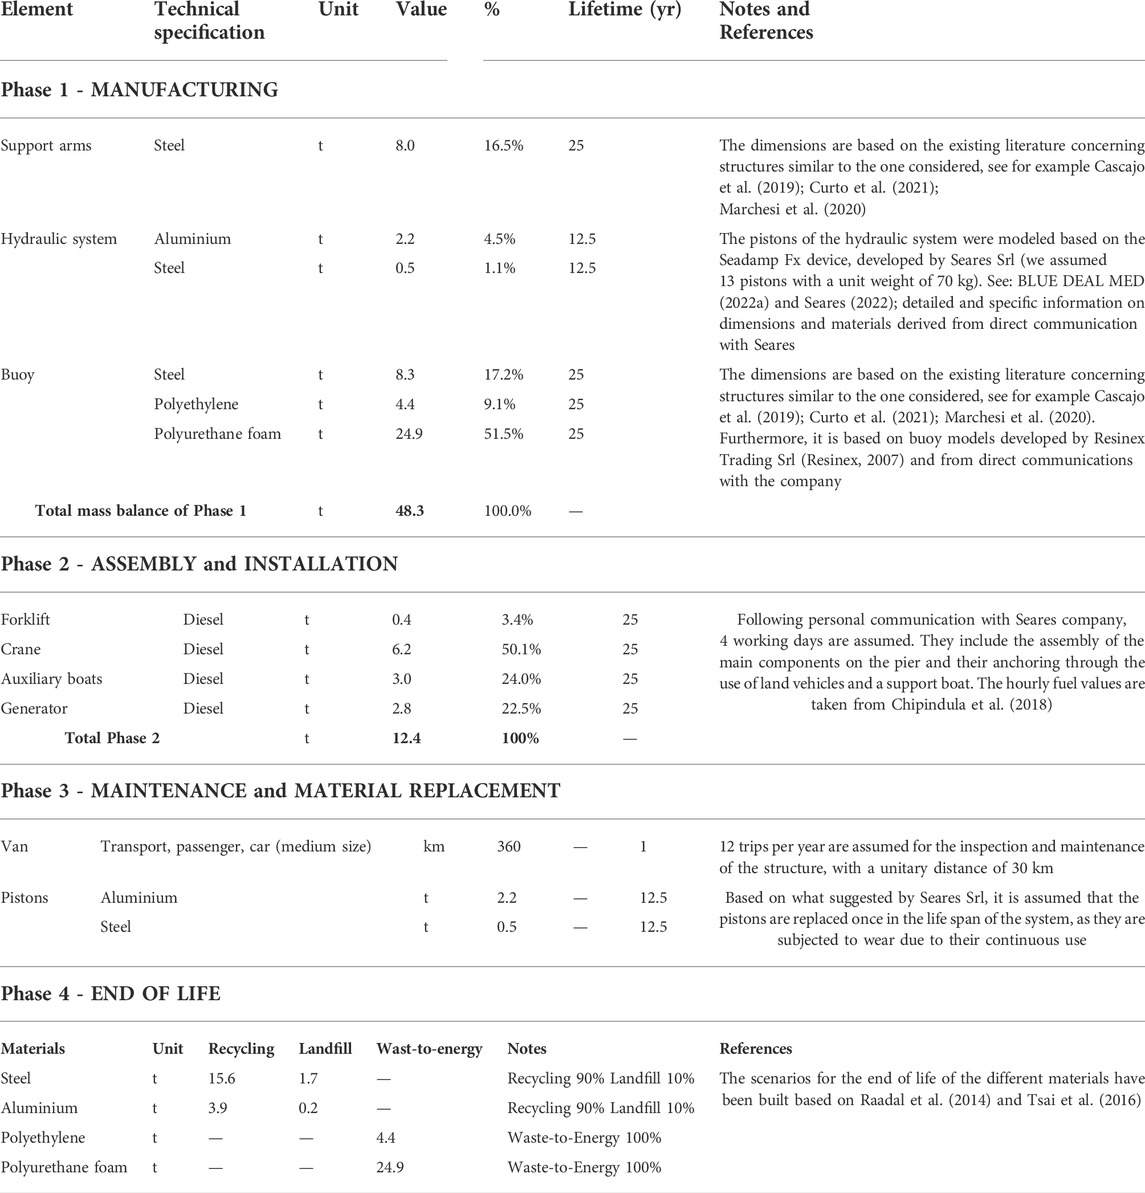
TABLE 3. Life Cycle Inventory data for a 20 m breakwater hosting 3 generic oscillating floater devices. Values in bold represent totals and subtotals.
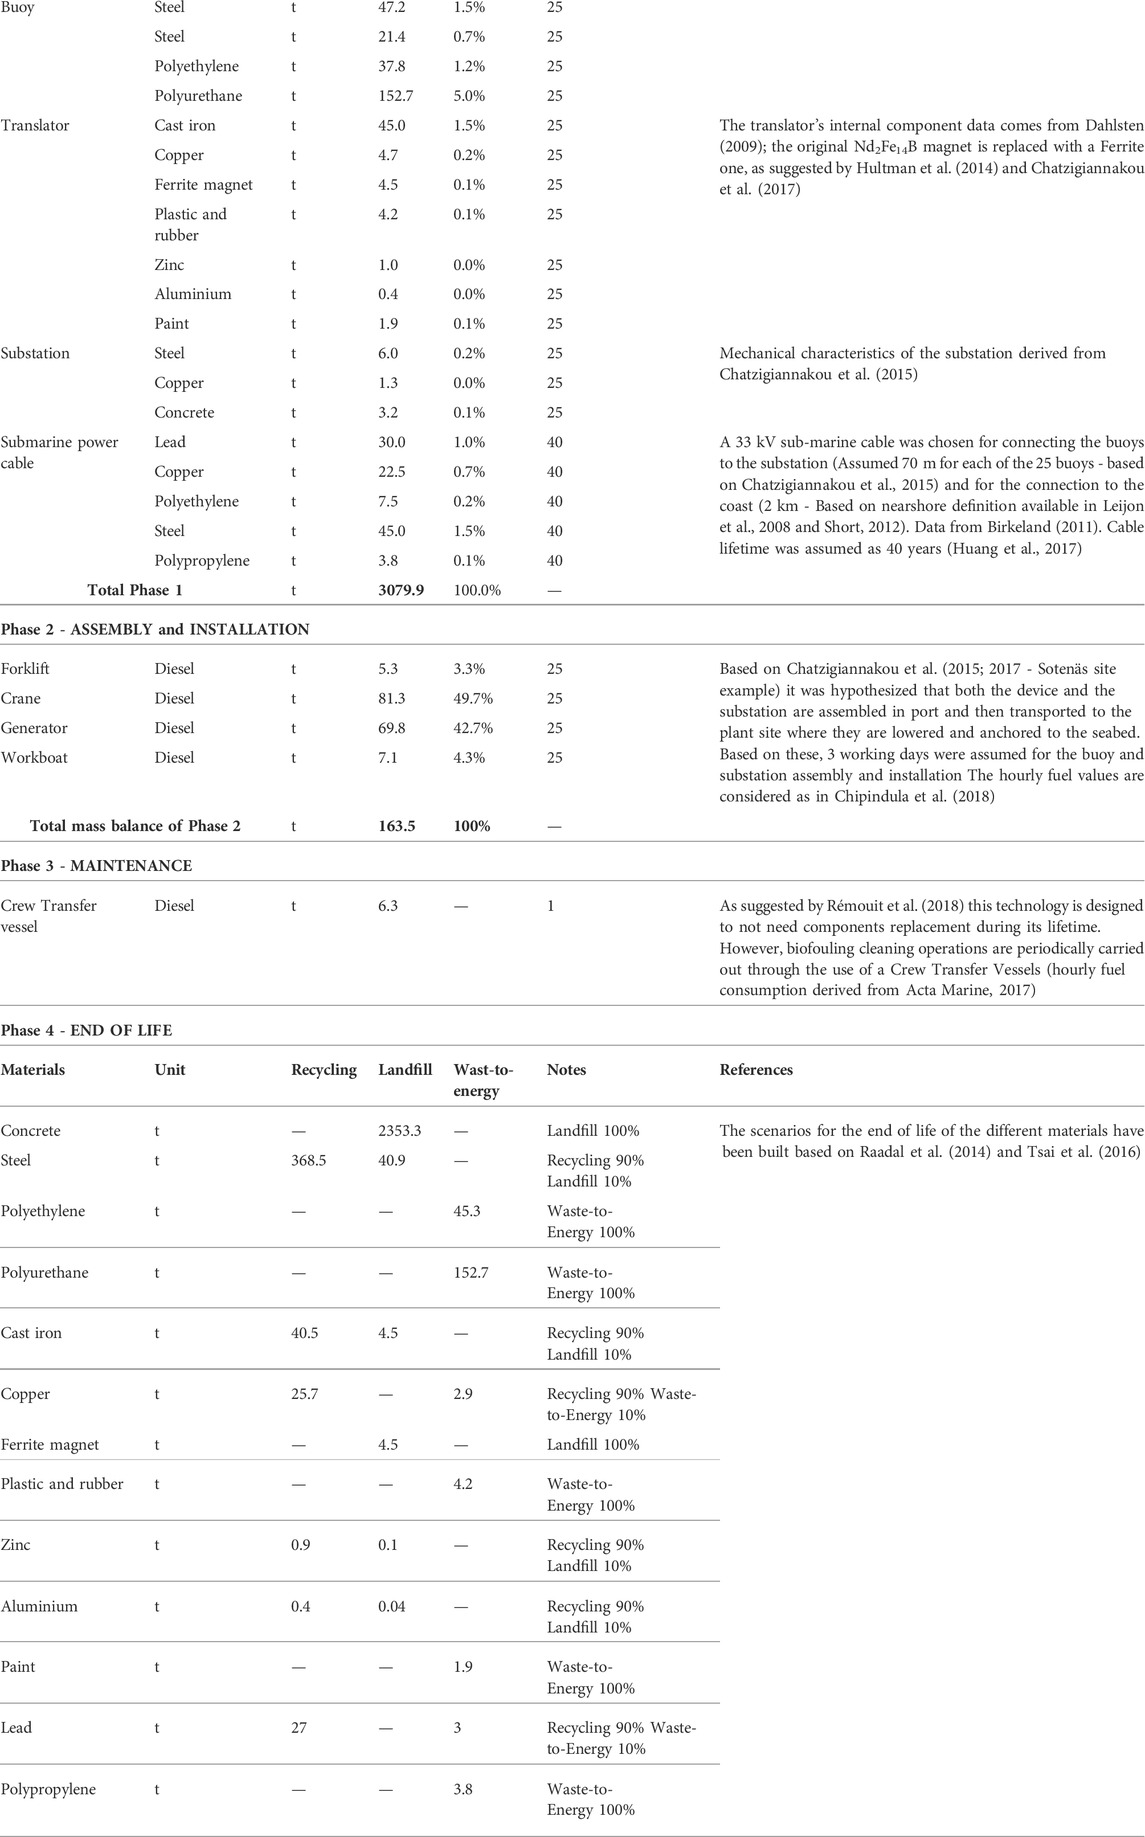
TABLE 4. Life Cycle Inventory data for a wave park hosting 25 generic seabed-based buoys. Values in bold represent totals and subtotals.
For background data, Ecoinvent v3.6 (Ecoinvent, 2022) datasets were used. The Intergovernmental Panel on Climate Change (IPCC) (2013) characterization method was selected to quantify the GHG emissions through a standardization based on Global Warming Potentials (GWPs). These characterization factors were expressed for a period of 100 years (GWP 100), in CO2eq per ton of emission and hereafter expressed as CF values.
As reported in the flow chart in Figure 4, the “cradle-to-grave” LCA considered four main phases common to all WECs: 1) manufacturing; 2) transport, assembly, and installation; 3) maintenance and material replacement; and 4) EoL. The life cycle impacts of the main energy inputs and materials that make up the technological components were considered, starting from the mass of the materials used and therefore neglecting the impact of the specific industrial process of producing the technological component in its final form (Pulselli et al., 2022).

FIGURE 4. Flow chart representing the main life cycle phases involved in the assessment (“cradle-to-grave”).
The functional unit (FU) was 1 year of operation of each device. As a precaution, the service lifetime of the OWC was 50 years even if Patrizi et al. (2019) considered 60 years for the onshore overtopping breakwater WEC. The expected lifetime of 25 years was assumed for both oscillating floater and seabed-based buoy (Rémouit et al., 2018; BLUE DEAL MED, 2022c). For specific elements (e.g., PTO mechanism, electrical connections), the lifetimes were differentiated to consider the maintenance and substitution operations. As an example, according to Bruschi et al. (2019), the average lifespan of an air turbine of an OWC is lower than that of wind turbines (20 years; Chipindula et al., 2018), in this article, it was assumed to be 15 years considering work under non-constant conditions. According to Zhai et al. (2018), the system boundary excluded small mechanical components used for the upstream module and system assembly as well as downstream maintenance, such as bolts, nuts, and studs, which account for a negligible portion of weight and minimal environmental impacts.
Specific data of materials and energy needed to manufacture the structural components (Phase 1) were estimated by calculation procedures to quantify relevant inputs and outputs of the product system starting from scientific literature sources. For example, the external electricity generator system for the OWC was modeled according to Faÿ et al. (2020).
Regarding the assembly and installation stage (Phase 2), the study assumed different time frames for each system. For the OWC system, the whole deployment spot took about 17 working days; for the oscillating floater, 4 working days were needed, while for the seabed-based buoy, about 3 working days per device were required. The study assumed the onshore assembly and installation for the OWC and the floater, while the buoy needed to be transported by boat to the installation site after its assembly on the port. For all technologies assessed, the materials and construction components were transported by lorry for an assumed distance of 200 km to the assembly site. The research of Chatzigiannakou et al. (2017) was taken as reference to quantify the installation time per device and the construction site machineries involved (e.g., cranes, forklifts, generators, ships, etc.). The consumption of diesel was required for assembly on land and the operational activities on site, which was estimated based on Chipindula et al. (2018). For the installation of the marine substation, the study of Chatzigiannakou et al. (2015) was considered.
Since the port systems already have connections to the national grid and in the absence of detailed information regarding the necessary terrestrial electric cables, for all WECs, they were excluded from the analysis. On the other hand, the study estimated the material composition of the submarine cables for the transmission of the electricity produced by the seabed-based buoy. Particularly, the composition of the 33 kV submarine cables was modeled following Birkeland (2011). The present study was limited to evaluate the connection cable between the buoy and the marine substation, having a length equal to 70 m, and an addition submarine cable with a length of 2 km to allow the energy transmission from the marine substation to the coast (Leijon et al., 2008).
For the maintenance and material replacement stage (Phase 3), for the OWC system, the study considered the replacement of the Wells turbine approximately 3 times over the life of the device (15 years, Bruschi et al., 2019). In addition, emissions related to the diesel consumption for periodic monitoring inspections (12 times per year) to check the status of the system were considered. For the floater system, the study assumed that hydraulic pistons would be replaced (12.5 years; Seares, 2022), and diesel consumption for monitoring the trips (12 times per year) was accounted as well. According to Strömstedt et al. (2012), the seabed-based buoy is maintenance-free, meaning that no maintenance should be needed during the whole lifetime (20–25 years) of the system. It may need to be monitored to detect possible damage or malfunctioning and for biofouling prevention and observation (Rémouit et al., 2018). Also, for the marine substation, it was assumed that no maintenance should be needed, except for inspection activities to verify its functionality. For this reason, the diesel consumption for the use of a crew transfer vessel for inspection activities (2 times per year) was accounted for in accordance with Acta Marine (2017) for both cases.
Regarding the decommissioning and EoL (Phase 4), following Raadal et al. (2014) and Tsai et al. (2016), different scenarios were assumed considering recycling and landfill or energy recovery treatments. The destinations of the various materials assumed were: 90 % recycling and 10 % landfill for steel, aluminum, cast iron, and zinc; 90 % recycling and 10 % waste-to-energy for copper and lead; 100 % landfill for cement; and 100 % waste-to-energy for paint and plastic materials (i.e., polyethylene, polyurethane, and polypropylene). The gravel removed during the installation activities for the OWC system was assumed to be reused in place. According to Pulselli et al. (2022), regarding recyclable metal components, the study considered emissions for their transport to a hypothetical waste management centre (200 km by truck for all WECs and 2 km by boat only for the seabed-based buoy case).
The impacts of subsequent management and recycling of metals to produce secondary raw materials were assigned to the future process that would use those materials (Pulselli et al., 2022).
Based on the LCA results, the CIE per kWh generated by each WEC system was calculated. As reference energy productions and consequently energy potential data from Arena (2016) and Ibarra-Berastegi et al. (2018) for the OWC model; BLUE DEAL MED (2022c) and BLUE DEAL MED (2022d) for the oscillating floater and Bozzi et al. (2013) for the near-shore seabed-based buoy were considered.
3 Results and discussion
CF results for each WEC were analyzed and values for individual components are shown in Table 5, Table 6, Table 7. The OWC system has a total CF of 4.2 t CO2eq per unit, which increases to 21.1 t CO2eq if a 20 m breakwater is considered (able to host up to 5 chambers) (Table 5). On the other hand, if it is considered a traditional 20 m breakwater without an OWC system, the associated CF is estimated to be around 17.9 t CO2eq. This lower value is due to the avoided use of concrete for the OWC chamber walls and steel for the Wells turbines. In addition, the higher amount of gravel filling the concrete structure justify the lower emissions, as the corresponding weight in terms of CF is not relevant to the total result. It should highlight that the traditional breakwater remains a passive structure not able to produce energy, but rather dissipates it.
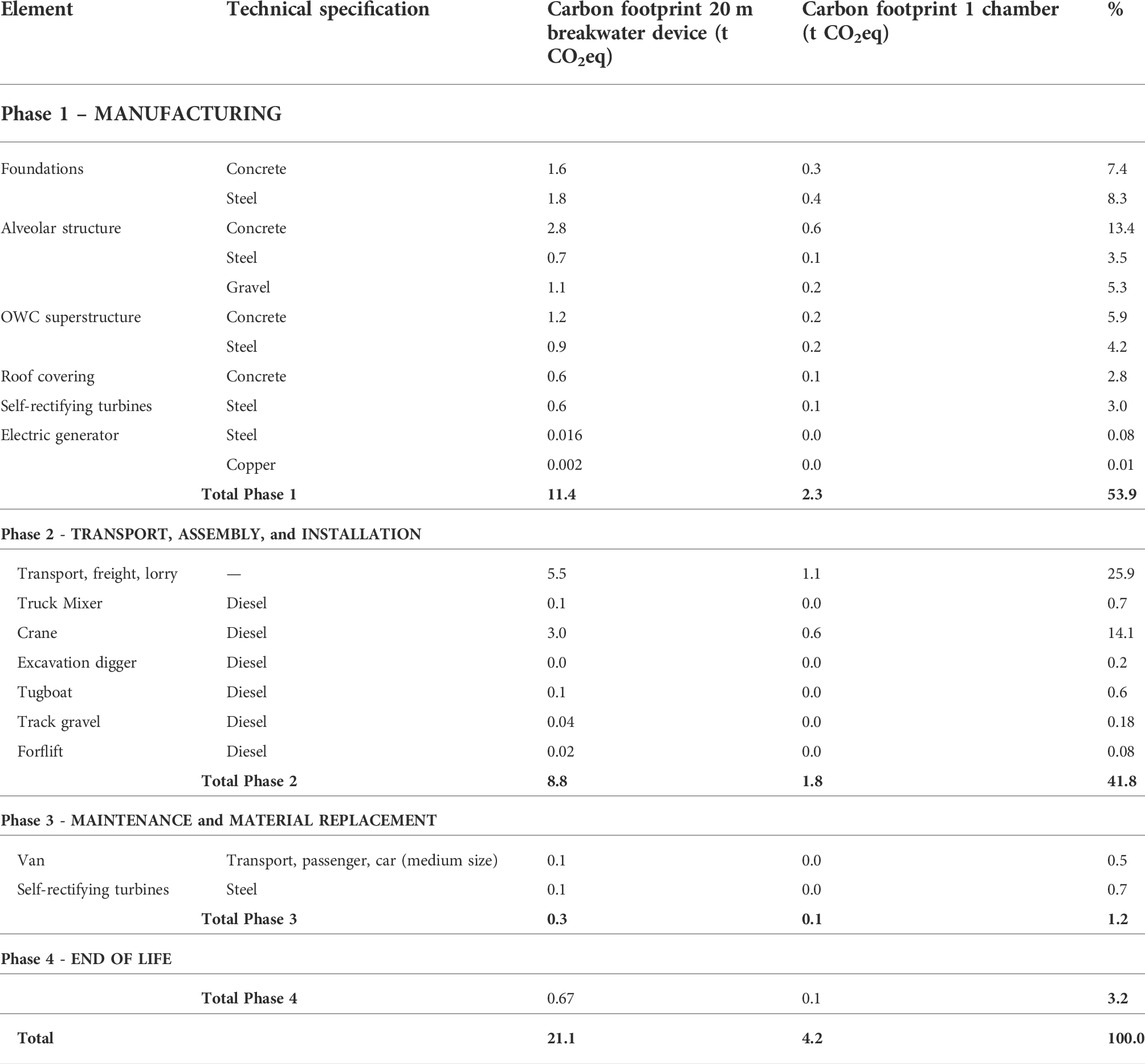
TABLE 5. Total GWP (t CO2eq) impact category results for the OWC system and values for individual components. Values in bold represent totals and subtotals.
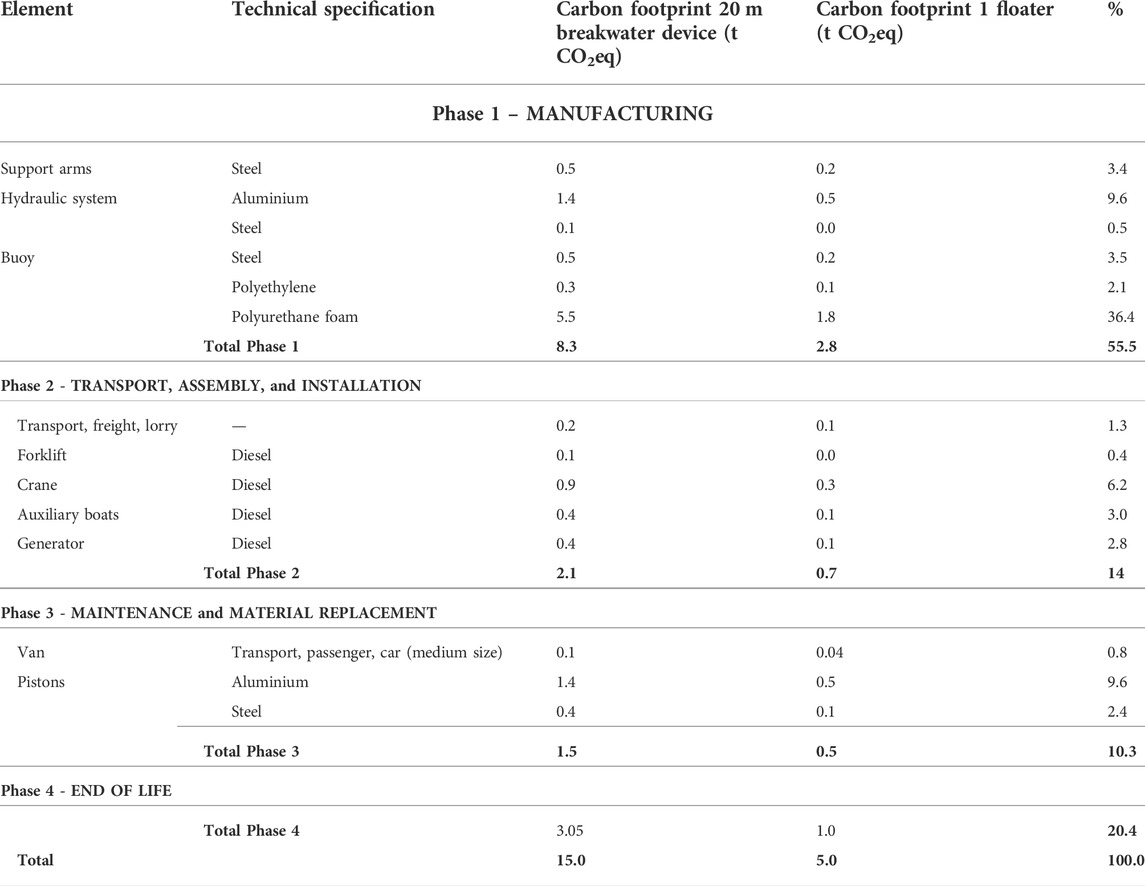
TABLE 6. Total GWP (t CO2eq) impact category results for the oscillating floater and values for individual components. Values in bold represent totals and subtotals.
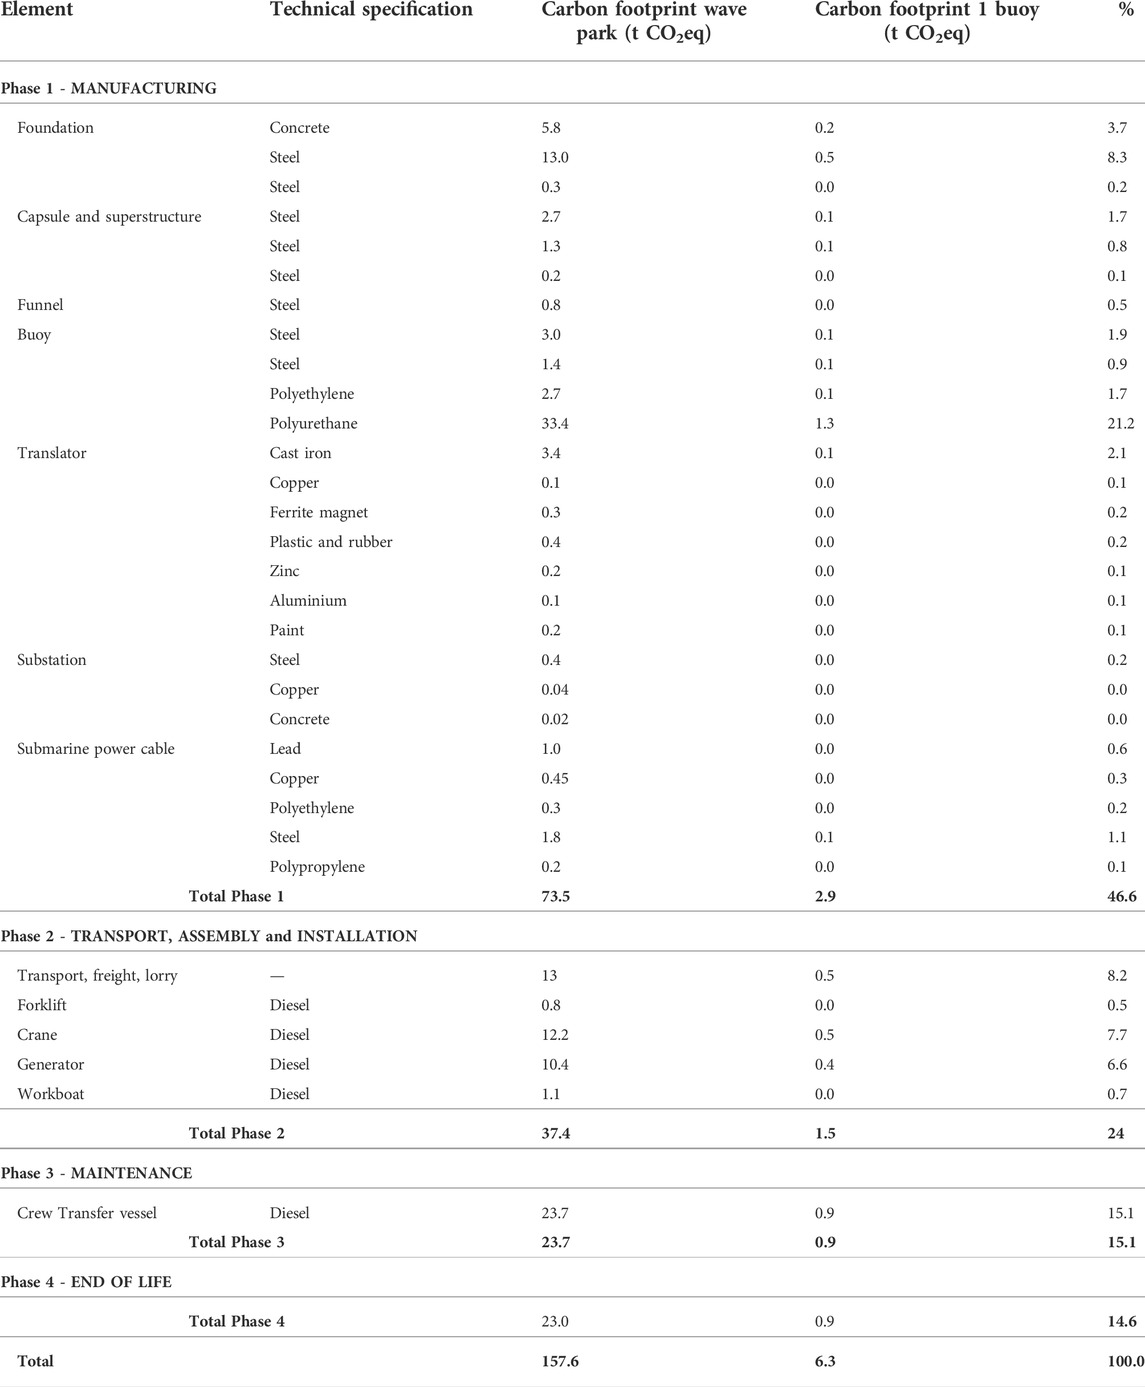
TABLE 7. Total GWP (t CO2eq) impact category results for the seabed-based buoy and values for individual components.
The oscillating floater shows a CF per unit of 5 t CO2eq and, considering a breakwater of the same length as the previous one, the CF is around 15 t CO2eq (3 installable systems) (Table 6). Regarding the seabed-based buoy, the CF per unit is 6.3 t CO2eq and hypothesizing a wave park of 25 devices, the total results is 157.6 t CO2eq (Table 7).
The main GHG emission sources per life cycle phase and process are shown in Figure 5. Overall, the results are in line with previous studies highlighting that the large majority of the environmental impacts associated with this type of devices are due to Phase 1, the manufacturing stage (Sørensen et al., 2006; Dahlsten, 2009; Walker and Howell 2011; Uihlein, 2016; Zhai et al., 2018). Particularly, this phase covered 54 % (2.3 t CO2eq), 56 % (2.8 t CO2eq), and 47 % (2.9 t CO2eq) of the total CF for the OWC, oscillating floater, and seabed-based buoy, respectively. These percentages are in line with the range between 40 and 90 % emerged in previous assessments (Dahlsten, 2009; Thomson et al., 2011; Uihlein, 2016; Zhai et al., 2018). The potential environmental impacts assessed are mainly due to the WEC’s material structural components such as concrete, steel, and polyurethane. Concrete and steel were involved in the structure of the OWC system and represented the 29 and 19 % of the total GHG emissions, respectively (Table 5). Polyurethane played a key role in the manufacturing stage of the oscillating floater and seabed-based buoy, covering the 36 and 21 %, respectively, of the GWPs evaluated (Table 6, Table 7).
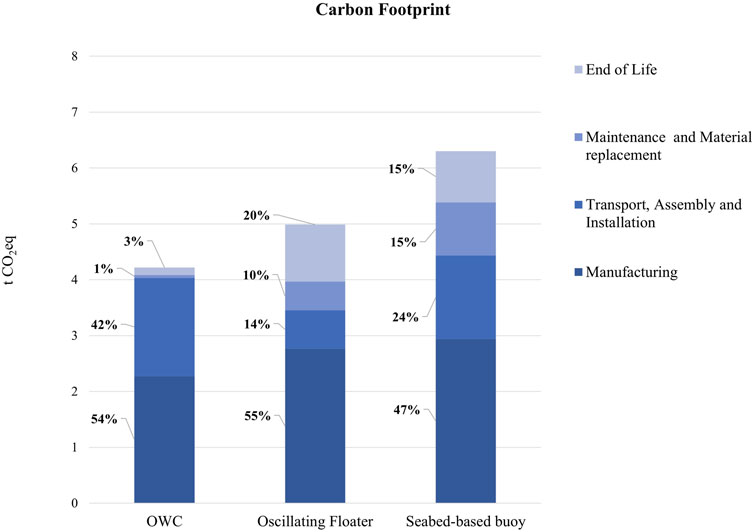
FIGURE 5. Carbon Footprint (t CO2eq) results in the three WECs in relation to the different LCA phases analyzed.
Phase 2 (transport, assembly, and installation) covered 42 % (1.8 t CO2eq) of the total CF of the OWC system, which is mainly due to the transport of material components by lorry (26 %) to the assembly site and the diesel consumption for the crane operation activities (14 %) (Table 5). Regarding the oscillating floater and seabed-based buoy performances, Phase 2 accounted for 14 and 24 %, respectively (Table 6, Table 7). In the former case, the diesel consumption for the crane use (6.2 %) is once again decisive, while in the latter, the percentage weight of emissions is divided between the transport of the material components by lorry (8.2 %) and diesel consumption for the crane (8 %) and the electricity generator (7 %).
Phase 3 (maintenance and material replacement) is negligible for OWC, covering 1.2% of the overall CF results (Table 5), while, for the other two WECs, it is responsible for the 10 and 15% of the emissions for the oscillating floater and seabed-based buoy, respectively (Table 6, Table 7). For the floater, the main input responsibility is the aluminum involved in the replacement of the hydraulic piston (around 9.6%), while for the buoy, the diesel consumption for the crew transfer vessel is the only responsibility.
Phase 4 (EoL) is not significant for the OWC (3%) (Table 5), while for the oscillating floater and seabed-based buoy, it represents 20 % and 15 % of the potential GHG emissions, respectively (Table 6, Table 7), due to the different fates of the materials involved (mainly metals recycling and waste-to-energy of plastics).
The CFs evaluated for each WEC were compared to an estimated range of electricity production (MWh‧yr−1), giving the CIE, expressed in g CO2eq·kWh−1. Considering wave energy potentials for Mediterranean marine areas, extrapolated from the scientific literature available, the CIE values for the OWC system fall in the range of 270–203 g CO2eq·kWh−1 (hypothesizing 15.6–20.8 MWh per device, respectively, according to Arena, 2016 and Ibarra-Berastegi et al., 2018); for the oscillating floater they vary between 374 and 94 g CO2eq·kWh−1 (considering 13.3–53.3 MWh per device, according to BLUE DEAL MED, 2022c and BLUE DEAL MED, 2022d), respectively, and for the buoy, the values fall in the range of 158–105 g CO2eq·kWh−1 (assumed 60–40 MWh per device, respectively, according to Bozzi et al., 2013).
In general, the range of the CIE values calculated for each WEC system shows better performance than any fossil source for electricity production: natural gas (443 g CO2eq·kWh−1), petroleum products (778 g CO2eq·kWh−1), and solid fossil fuels (mainly coal) (1,050 g CO2eq·kWh−1), as reported by Sovacool (2008). The same is true for some alternative energy carriers and sources such as: hydrogen (664 g CO2eq·kWh−1; Sovacool, 2008) and geothermal (380 g CO2eq·kWh−1; Pulselli et al., 2019). It is a different situation if the comparison is made with the CIE values of solar photovoltaic panels (32 g CO2eq·kWh−1), hydroelectric (12 g CO2eq·kWh−1), onshore wind (10 g CO2eq·kWh−1) (Sovacool, 2008), offshore bottom fixed wind (32 g CO2eq·kWh−1), and offshore floating wind (49 g CO2eq·kWh−1) (Pulselli et al., 2022), which due to a higher technology readiness level, turn out to be more performing and advantageous, and thus more widespread.
Comparison with other WEC systems (Figure 6) is limited to the CIE results obtained for buoy technology, as LCA studies on OWC or oscillating floater technologies are not yet available in the literature. For this reason, particularly for the seabed-based buoy case study, the results obtained are close to the average values found in the literature for floating body converters (83 g CO2eq·kWh−1 considering Dahlsten, 2009; 105 g CO2eq·kWh−1 according to Uihlein, 2016; and 90 g CO2eq·kWh−1 calculated by Zhai et al., 2018).
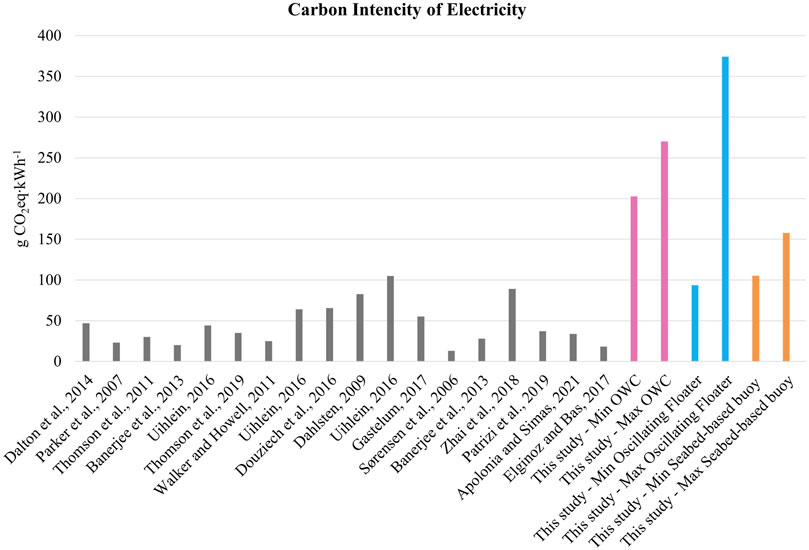
FIGURE 6. CIE values of the WEC systems available in the literature (grey columns) and results obtained from the present study (colored columns).
Based on the results obtained and from the comparison with the aforementioned literature, it is evident that encouraging research and development of such WEC systems, integrating them with already established technologies, and the implementation and deployment of new MRE solutions foster a conscious use of resources. Despite the need for targeted structural improvements, ocean energy technologies could still contribute to making energy systems more sustainable through synergies with other renewable energy sources (International Renewable Energy Agency (IRENA), 2020). To promote a hybrid electricity generation, for example, WECs can be coupled with offshore wind turbines. In this regard, Elginoz and Bas (2017) carried out an LCA of a multi-use offshore platform, designed for Atlantic Ocean Cantabrian conditions, which unites wave and wind energy converters. The research showed the manufacturing processes as the main source of environmental burdens. Nevertheless, the sensitivity and scenario analyses highlighted the significant effect of estimated recycling ratios and location of the energy farm on environmental impacts of the structure in the early design stage. Moreover, a feasibility and LCA study of a WEC platform, called Wave Dragon, combined with wind turbines, conducted by Sørensen et al. (2016), showed a 17 % lower LCOE attributed to the wave–wind combination unit compared to WEC alone.
4 Sensitivity analysis
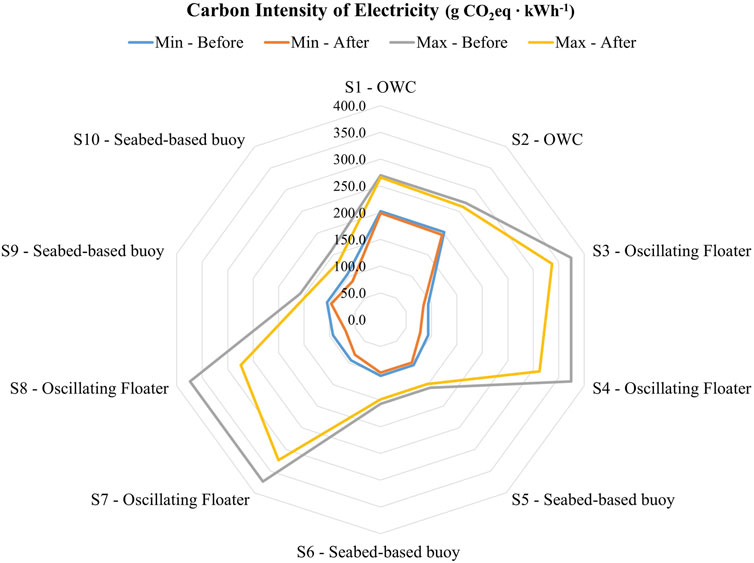
A sensitivity analysis was carried out to assess variations in terms of CF and consequently CIE, postulating changes in the parameters that most influence the results of the study (Figure 7 and Supplementary Table S1 in the supplementary material).
According to Paredes et al. (2019), the manufacture of materials used in the WEC structures showed the greatest impact on total GHG emissions. For this reason, using appropriate emission factors, it was hypothesized that 30 and 50 % of primary steel involved in the manufacturing phase should be recycled (Scenarios S1 and S2, respectively) for the OWC construction. Although in this system, concrete carries the greatest burden in terms of CF, there are currently no fates other than landfilling for this material. In addition, for a device such as the OWC, further studies would be needed to verify the possibility of reducing the amount of concrete involved or its replacement with other materials such as steel or wood to build the caisson structure. Moreover, various recycling methods can be applied to give a second life to polyurethane, avoiding disposing such a valuable polymer (Cannon, 2021). As it has the highest contribution in the manufacturing stage of the other two WEC structures, four scenarios (S3 and S4 for the oscillating floater; S5 and S6 for the seabed-based buoy) with 30 and 50 % of recycled polyurethane were postulated, respectively. To address the lack of background data on SimaPro to model the polyurethane recycling, the high-density polyethylene recycling process was assumed as “proxy”, since the treatment processes can be assumed to be similar, and the raw material is not explicit.
As the development of new plastic materials with better environmental performances compared to the traditional fossil-based counterpart is a priority toward sustainable production processes (Manzardo et al., 2019), it was assumed that the substitution of polyurethane parts with a bio-based solution by following what is reported in Bioplastics (2015). This assumption considered that the parts in question were not in direct contact with the marine environment but constituted the internal structure of the WEC. It therefore considered an additional four scenarios (S7 and S8 for the oscillating floater; S9 and S10 for the seabed-based buoy) in which 50 and 100 % of the polyurethane was substituted with a bio-based polyurethane, respectively.
The sensitivity analysis showed that for the OWC model, scenarios S1 and S2 (with 30 and 50% of recycled steel, respectively) did not significantly decrease the impact (-0.3 % and -0.6 % of total CF). Indeed, the CF values remained almost unchanged in each scenario (around 4 t CO2eq).
The implementation of recycled polyurethane in the oscillating floater structure, instead, is responsible for -6 % and -10 % of the total CF values variation, which decrease to 4.5 and 4 t CO2eq in S3 and S4, respectively. Also, in the seabed-based buoy model, the use of recycled polyurethane improves the overall environmental performance, with lower CF values of 6 t CO2eq in S5 and in S6 (-6%). Regarding the application of bio-based polyurethane for both oscillating floater and seabed-based buoy models, the substitution of 50 % (S7 and S9) and 100 % (S8 and S10) of traditional polyurethane is responsible for -8 % and -16 % of the emission variance. This means that the CF values of the floater decrease to 4.3 and 5.8 t CO2eq, respectively; while the CF results of the buoy come to 3.6 and 5.3 t CO2eq, respectively.
Likewise, the variations in terms of CIE show that the implementation of recycled materials can improve the performance of the systems analyzed. Regarding the OWC system, the values of CIE for S1 and S2 decrease to 199.4–266 g CO2eq·kWh−1 and 196–261 g CO2eq·kWh−1, respectively. The CIE range values associated to the oscillating floater are 84–337 g CO2eq·kWh−1 in S3 and 78–312 g CO2eq·kWh−1 in S4, while for the seabed-based buoy are 99–148.5 g CO2eq·kWh−1 in S5 and 99.2–149 g CO2eq·kWh−1 in S6 (Figure 7 and Supplementary Table S1 in the supplementary material).
Finally, also the hypostatized application of bio-based polyurethane for the oscillating floater and the seabed-based buoy turns out to be an interesting choice that would allow for a range of CIE values of: 81.1–324.3 g CO2eq·kWh−1 in S7; 68.6–274.5 g CO2eq·kWh−1 in S8; 97–145.4 g CO2eq·kWh−1 in S9; and 89–133 g CO2eq·kWh−1 in S10 (Figure 7 and Supplementary Table S1 in the supplementary material).
5 Conclusion
One of the greatest challenges of this century is to find an alternative energy source to fossil fuels (Owusu and Asumadu-Sarkodie, 2016). A major boost to the ecological transition could therefore come from harnessing wave energy by avoiding leaving out the 70 % of the Earth surface (i.e., ocean and seas).
In this field, this study was aimed to define a benchmark of three WECs able to overcome the variability between specific technologies and provide a preliminary assessment of the potential environmental performance, following homogeneous evaluation criteria.
The LCA methodology was used to evaluate their environmental impact and in particular, the CF, considering the main materials and energy flows involved in the different lifecycle phases, i.e., manufacturing: transport, assembly, and installation; maintenance; and EoL. For each WEC, the LCA confirmed that the potential impacts, in terms of CF, stemmed from the manufacturing stage. Consequently, future studies and research studies should enhance the knowledge concerning the materials used in the construction of such technologies. For example, by reducing, where possible, the quantities of components having a high GWP, selecting those with better performances in terms of structural and environmental characteristics, and evaluating the possibility of extending their lifetime.
Although the productivity values were not related to direct monitoring activities of these systems in real sites, but relied on the productivity ranges valid for the Mediterranean according to literature sources, the results of this study showed that WEC technologies have high potential to be implemented with high rates of efficiency improvement. Each WEC exploits the same resource (the wave energy potential), but they are different technologies, characterized by different designs and operating systems. Moreover, their performance depends on where these technologies are installed. It is therefore not possible to recommend one technology with respect to the others. Nevertheless, given the results shown in this study, WECs can be taken seriously into account for energy policies at national and local scales (European Commission (EC), 2014) from administrations and public authorities. These systems are more competitive than those using fossil energy sources, and in some cases, even compared with other technologies able to deploy different renewable energy sources, such as hydrogen and geothermal.
Results refer to 3D model systems (even inspired by existing prototypes) and are based on assumptions (such as material mass, installation–maintenance operations, and expected lifetime of certain structural components); nevertheless, they provide useful information to understand current performances and figure out potential improvements. According to Pirttimaa and Cruz (2020), more research in the field of MRE and a better exchange of information on the potential environmental impacts will be required to understand and mitigate any adverse effects that ocean energy installations may have on marine ecosystems. Coherently, this study showed how LCA can inform the design of innovative WEC technologies dealing with their production yield, but also their lifecycle processes. Based on the information obtained (e.g., constructive technique used, functional principle, and marine energy potentials of the hypothetical implementation site), WEC look like a promising solution to exploit the MRE potential in the Mediterranean and clearly show the opportunity to further investigate and foster their deployment. Moreover, the creation of synergies between WECs and other solutions, such as offshore wind turbines, encourage hybrid electricity generation and sustain the detachment from fossil fuels.
Data availability statement
The original contributions presented in the study are included in the article/Supplementary Material; further inquiries can be directed to the corresponding author.
Author contributions
MB, MM, RMP, EN and NP conceived the manuscript and processed and discussed data. AS elaborated the 3D models and extracted inventory data. RMP and SB supervised the writing of the manuscript. All authors discussed reviewer feedback and contributed to the final manuscript.
Funding
This study was conducted in the framework of the Interreg Med BLUE-DEAL (2019–2022) project, co-financed by the European Regional Development Fund. Website: https://blue-deal.interreg-med.eu.
Conflict of interest
Authors RMP, AS, and EN were employed by 2INDACO2 srl.
The remaining authors declare that the research was conducted in the absence of any commercial or financial relationships that could be construed as a potential conflict of interest.
Publisher’s note
All claims expressed in this article are solely those of the authors and do not necessarily represent those of their affiliated organizations, or those of the publisher, the editors, and the reviewers. Any product that may be evaluated in this article, or claim that may be made by its manufacturer, is not guaranteed or endorsed by the publisher.
Supplementary material
The Supplementary Material for this article can be found online at: https://www.frontiersin.org/articles/10.3389/fenrg.2022.980557/full#supplementary-material
Abbreviations
CF, Carbon Footprint; CIE, Carbon Intensity of Electricity; EC, European Commission; EoL, End of Life; FU, Functional Unit; GHG, Greenhouse gas; GWP, Global Warming Potential; LCA, Life Cycle Assessment; LCOE, Levelized Cost of Energy; MRE, Marine Renewable Energy; OWC, Oscillating Water Column; PTO, Power Take-Off; WEC, Wave Energy Converter.
References
Acta Marine (2017). Offshore response I south boats 12 m catamaran crew transfer vessel. Available at: https://www.actamarine.com/documenten/specs/ctv_s_17-05-2017/vessel_specifications_offshore_response.pdf (Accessed March 15, 2022).
Andersen, K., Chapman, A., Hareide, N. R., Folkestad, A. O., Sparrevik, E., and Langhamer, O. (2009). Environmental monitoring at the maren wave power test site off the island of runde, western Norway: Planning and design. Available at: https://www.researchgate.net/publication/228877739 (Accessed March 15, 2022).
Apolonia, M., and Simas, T. (2021). Life cycle assessment of an oscillating wave surge energy converter. J. Mar. Sci. Eng. 9, 206. doi:10.3390/jmse9020206
Appiott, J., Dhanju, A., and Cicin-Sain, B. (2014). Encouraging renewable energy in the offshore environment. Ocean Coast. Manag. 90, 58–64. doi:10.1016/j.ocecoaman.2013.11.001
Arena, F. (2016). Resonant wave energy converters REWEC3: Primi prototipi nei porti di Civitavecchia e di Salerno. Available at: http://www.eugeniopc.it/investigacion/seminari/EnergiaMareNSW16/PRESENTAZIONI/PresentazioneArena.PDF (Accessed April 15, 2022).
Arena, F., Romolo, A., Malara, G., and Ascanelli, A. (2013). “On design and building of a U-owc wave energy converter in the mediterranean sea: A case study,” in ASME 2013 32nd International Conference on Ocean, Offshore and Arctic Engineering, Nantes, France, June 9-14, 2013. doi:10.1115/OMAE2013-11593
Birkeland, C. (2011). Assessing the life cycle environmental impacts of offshore wind power generation and power transmission in the North Sea (Trondheim (N): Norwegian University of Science and Technology). [dissertation/Master’s thesis].
Banerjee, S., Duckers, L., and Blanchard, R. E. (2013). An overview on green house gas emission characteristics and energy evaluation of ocean energy systems from life cycle assessment and energy accounting studies. J. Appl. Nat. Sci. 5, 535–540. doi:10.31018/jans.v5i2.364
Bioplastics (2015). Just how environmentally friendly are biobased materials actually? Available at: https://www.bioplasticsmagazine.com/en/news/meldungen/20150814-Biobased-production-should-become-more-efficient.php (Accessed June 08, 2022).
Bjørnsen, E. (2014). Chains in mooring systems (Trondheim (N): Norwegian University of Science and Technology). [dissertation/Master’s thesis].
BLUE DEAL MED (2022c). Eco wave power: Generating clean electricity from ocean waves for giglio island. Available at: https://bluedealmed.eu/colab/proposals/eco-wave-power-generating-clean-electricity-from-ocean-waves-for-giglio-island (Accessed April 15, 2022).
BLUE DEAL MED (2022d). EDS: The energy Double system for harnessing wave energy in the nearshore zone. Available at: https://bluedealmed.eu/colab/proposals/eds-the-energy-double-system-for-harnessing-wave-energy-in-the-nearshore-zone-2 (Accessed April 15, 2022).
BLUE DEAL MED (2022a). HYDRA WHT for the giglio island. Available at: https://bluedealmed.eu/colab/proposals/hydra-wht-for-the-giglio-island (Accessed April 15, 2022).
BLUE DEAL MED (2022b). Seadamp FX – the anchorage system that harvests energy from the sea. Available at: https://bluedealmed.eu/colab/proposals/seadamp-fx-the-anchorage-system-that-harvests-energy-from-the-sea-3 (Accessed April 15, 2022).
Bozzi, S., Miquel, A. M., Antonini, A., Passoni, G., and Archetti, R. (2013). Modeling of a point Absorber for energy conversion in Italian seas. Energies 6, 3033–3051. doi:10.3390/en6063033
Bruschi, D. L., Fernandes, J. C. S., Falcão, A. F. O., and Bergmann, C. P. (2019). Analysis of the degradation in the Wells turbine blades of the Pico oscillating-water-column wave energy plant. Renew. Sustain. Energy Rev. 115, 109368. doi:10.1016/j.rser.2019.109368
Cannon (2021). Recycled polyurethane: The second life of the polymer. Available at: https://www.cannonplastec.com/blog/recycled-polyurethane-the-second-life-of-the-polymer/ (Accessed May 6, 2022).
Cascajo, R., García, E., Quiles, E., Correcher, A., and Morant, F. (2019). Integration of marine wave energy converters into seaports: A case study in the port of valencia. Energies 12, 787. doi:10.3390/en12050787
Cejuela, E., Negro, V., del Campo, J. M., Martín-Antón, M., Esteban, M. D., and López-Gutiérrez, J. S. (2018). Recent history, types, and future of modern caisson technology: The way to more sustainable practices. Sustainability 10, 3839. doi:10.3390/su10113839
Chatzigiannakou, M. A., Dolguntseva, I., and Leijon, M. (2015). “Offshore deployment of marine substation in the lysekil research site,” in Proceedings of the Twenty-fifth International Ocean and Polar Engineering Conference Kona, Big Island, Hawaii, USA, June 21-26, 2015, 1098–6189. ISBN 978-1-880653-89-0; ISSN.
Chatzigiannakou, M. A., Dolguntseva, I., and Leijon, M. (2014). Offshore deployment of point absorbing wave energy converters with a direct driven linear generator power take-off at the Lysekil test site. Available at: https://citeseerx.ist.psu.edu/viewdoc/download?doi=10.1.1.656.3662&rep=rep1&type=pdf (Accessed April 16, 2022).
Chatzigiannakou, M. A., Dolguntseva, I., and Leijon, M. (2017). Offshore deployments of wave energy converters by seabased industry AB. J. Mar. Sci. Eng. 5, 15. doi:10.3390/jmse5020015
Chipindula, J., Botlaguduru, V. S. V., Du, H., Kommalapati, R. R., and Huque, Z. (2018). Life cycle environmental impact of onshore and offshore wind farms in Texas. Sustainability 10, 2022. doi:10.3390/su10062022
Curto, D., Franzitta, V., and Guercio, A. (2021). sea wave energy. A review of the current technologies and perspectives. Energies 14, 6604. doi:10.3390/en14206604
Dahlsten, H. (2009). Life cycle assessment of electricity from wave power (Uppsala Sweden: Swedish University of Agricultural Sciences). [dissertation/Master’s thesis] https://stud.epsilon.slu.se/5364/1/dahlsten_h_130321.pdf (Accessed March 15, 2022).
Dalton, G., Madden, D., and Daly, M. C. (2014). “Life cycle assessment of the wavestar,” in 2014 Ninth International Conference on Ecological Vehicles and Renewable Energies (EVER), Monte-Carlo, Monaco, 25-27 March 2014, 1–9. doi:10.1109/EVER.2014.6844034
De Girolamo, P. (2015). Opere verticali o a parete o a muro. Available at: https://web.uniroma1.it/masterprogeo/sites/default/files/allegati_notizie/03_DIGHE%20A%20PARETE%20IN%20CASSONI%20%20CELLULARI.pdf (Accessed April 5, 2022).
Douziech, M., Hellweg, S., and Verones, F. (2016). Are wave and tidal energy plants new green technologies? Environ. Sci. Technol. 50, 7870–7878. doi:10.1021/acs.est.6b00156
Ecoinvent (2022). (For the availability of envorinmetal data worldwide. Available at: https://ecoinvent.org/(Accessed April 15, 2022).
Elginoz, N., and Bas, B. (2017). Life Cycle Assessment of a multi-use offshore platform: Combining wind and wave energy production. Ocean. Eng. 145, 430–443. doi:10.1016/j.oceaneng.2017.09.005
Esteban, M. D., López-Gutiérrez, J.-S., and Negro, V. (2017). Classification of wave energy converters. Recent Adv. Petrochem Sci. 2, 4. doi:10.19080/rapsci.2017.02.555593
European Commission (EC) (2022). 2030 climate target plan. Available at: https://ec.europa.eu/clima/eu-action/european-green-deal/2030-climate-target-plan_en#:∼:text=With%20the%202030%20Climate%20Target,below%201990%20levels%20by%202030 (Accessed March 20, 2022).
European Commission (EC) (2014). Blue Energy. Action needed to deliver on the potential of ocean energy in European seas and oceans by 2020 and beyond. Available at: https://eur-lex.europa.eu/legal-content/EN/TXT/PDF/?uri=CELEX:52014DC0008&from=EN (Accessed March 10, 2022).
European Commission (EC) (2021). The EU blue economy report. 2021. Available at: https://blueindicators.ec.europa.eu/sites/default/files/2021_06_BlueEconomy_Report-2021.pdf (Accessed March 102022.]
Falcão, A. (2010). F.de OWave energy utilization: A review of the technologies. Renew. Sustain. Energy Rev. 14 (3), 899–918. doi:10.1016/j.rser.2009.11.003
Faÿ, F. X., Henriques, J. C., Kelly, J., Mueller, M., Abusara, M., Wanan Sheng, W., et al. (2020). Comparative assessment of control strategies for the biradial turbine in the Mutriku OWC plant. Renew. Energy 146, 2766–2784. doi:10.1016/j.renene.2019.08.074
Holmgren, R. (2016). Modeling and concept design of wave energy device. Stockholm: Royal Institute of Technology.
Hong, Y., Hultman, E., Castellucci, V., Ekergård, B., Sjökvist, L., Soman, D. E., et al. (2013). Status update of the wave energy research at Uppsala University. https://www.researchgate.net/publication/258999251 (Accessed March 10, 2022).
Huang, Y. F., Gan, X. J., and Chiueh, P. T. (2017). Life cycle assessment and net energy analysis of offshore wind power systems. Renew. Energy 102, 98–106. doi:10.1016/j.renene.2016.10.050
Hultman, E., Ekergård, B., Kamf, T., Salar, D., and Leijon, M. (2014). Preparing the Uppsala university wave energy converter generator for large-scale production. https://www.icoe-conference.com/publication/preparing-the-uppsala-university-wave-energy-converter-generator-for-large-scale-production/(Accessed April 5, 2022).
Ibarra-Berastegi, G., Sáenz, J., Ulazi, A., Serras, P., Esnaola, G., and Garcia-Soto, C. (2018). Electricity production, capacity factor, and plant efficiency index at the Mutriku wave farm (2014–2016). Ocean. Eng. 147, 20–29. doi:10.1016/j.oceaneng.2017.10.018
Intergovernmental Panel on Climate Change (IPCC) (2013). Fifth assessment report. The physical science 469 basis. Available at: https://www.ipcc.ch/report/ar5/wg1/(Accessed June 08, 2022).
International Renewable Energy Agency (IRENA) (2020). Innovation outlook: Ocean energy technologies. Available at: https://www.irena.org/-/media/Files/IRENA/Agency/Publication/2020/Dec/IRENA_Innovation_Outlook_Ocean_Energy_2020.pdf (Accessed March 08, 2022).
International Standard Organization (ISO) (2006). Environmental Management and Life Cycle Assessment e principles and Framework, Goal and Scope Definition and Life Cycle Inventory Analysis, Life Cycle Impact Assessment and Life Cycle Interpretation. Geneva: International Organization for Standardization. ISO 14040:2006.
International Standard Organization (ISO) (2020). Environmental Management and Life Cycle Assessment e requirements and Guidelines. Geneva: International Organization for Standardization. ISO 14044:2020.
Khan, N., Kalair, A., Abas, N., and Haider, A. (2017). Review of ocean tidal, wave and thermal energy technologies. Renew. Sustain. Energy Rev. 72, 590–604. doi:10.1016/j.rser.2017.01.079
Koca, K., Kortenhaus, A., Angelelli, E., Zanuttigh, B., Kirca, O., Bas, B., et al. (2013). Wave Energy Convert. Energy Convert. MERMAID Deliv. D3, 3.
Lacasa, M. C., Esteban, M. D., López-Gutiérrez, J. S., Negro, V., and Zang, Z. (2019). Feasibility study of the installation of wave energy converters in existing breakwaters in the north of. Spain. Appl. Sci. 9, 23. doi:10.3390/app9235225
Leijon, M., Boström, C., Danielsson, O., Gustafsson, S., Haikonen, K., Langhamer, O., et al. (2008). Wave energy from the North Sea: Experiences from the lysekil research site. Surv. Geophys. 29, 221–240. doi:10.1007/s10712-008-9047-x
Lissandrom, S. (2010). Energia dal moto ondoso – wave energy (Padova (IT): Università degli Studi di Padova). [dissertation/Bachelor’s thesis].
Liu, Y., Li, Y., He, F., and Wang, H. (2017). Comparison study of tidal stream and wave energy technology development between China and some Western Countries. Renew. Sustain. Energy Rev. 76, 701–716. doi:10.1016/j.rser.2017.03.049
Magallanes, A., Sullivan, B., Moores, A., and Singh, A. (2016). Submerged concrete caisson breakwater construction. Available at: https://www.researchgate.net/publication/317842948 (Accessed April 15, 2022).
Malara, G., Romolo, A., Fiamma, V., and Arena, F. (2017). On the modelling of water column oscillations in U-OWC energy Harvesters. Renew. Energy 101, 964-972. doi:10.1016/j.renene.2016.09.051
Manzardo, A., Marson, A., Roso, M., Boaretti, C., Modesti, M., Scipioni, A., et al. (2019). Life cycle assessment framework to support the design of biobased rigid polyurethane foams. ACS Omega 4 (9), 14114–14123. doi:10.1021/acsomega.9b02025
Marchesi, E., Negri, M., and Malavasi, S. (2020). Development and analysis of a numerical model for a two-oscillating-body wave energy converter in shallow water. Ocean. Eng. 214, 107765. doi:10.1016/j.oceaneng.2020.107765
Mohamed, T. (2021). “Marine energy,” in Distributed renewable energies for off-grid communities. Empowering a sustainable, competitive, and secure twenty-first century (Amsterdam, NL: Elsevier Science Publishing Co Inc), 231–245. doi:10.1016/B978-0-12-821605-7.00012-X
Owusu, P. A., and Asumadu-Sarkodie, S. (2016). A review of renewable energy sources, sustainability issues and climate change mitigation. Cogent Eng. 3, 1167990. doi:10.1080/23311916.2016.1167990
Paredes, M. G., Padilla-Rivera, A., and Güereca, L. P. (2019). Life cycle assessment of ocean energy technologies: A systematic review. J. Mar. Sci. Eng. 7, 322. doi:10.3390/jmse7090322
Parker, R. P. M., Harrison, G. P., and Chick, J. P. (2007). Energy and carbon audit of an offshore wave energy converter. Proc. Institution Mech. Eng. Part A J. Power Energy 221 (8), 1119–1130. doi:10.1243/09576509jpe483
Patrizi, N., Pulselli, R. M., Neri, E., Niccolucci, V., Vicinanza, D., Contestabile, P., et al. (2019). Life cycle environmental impact assessment of an overtopping wave energy converter embedded in breakwater systems. Front. Energy Res. 7, 32. doi:10.3389/fenrg.2019.00032
Pirttimaa, L., and Cruz, E. (2020). Ocean energy and the environment: Research and strategic actions. Review of environmental impacts and consenting processes for ocean energy. European Technology & Innovation Platform for Ocean Energy. Available at: https://www.oceanenergy-europe.eu/wp-content/uploads/2020/12/ETIP-Ocean-Ocean-energy-and-the-environment.pdf (Accessed June 16, 2022).
PRé Consultants (2020). SimaPro 9.1.1. Available at: https://simapro.com/(Accessed June 15, 2022).
Pulselli, R. M., Maccanti, M., Bruno, M., Sabbetta, A., Neri, E., and Patrizi, N. (2022). Benchmarking marine energy technologies through LCA: Offshore floating wind farms in the mediterranean. Front. Energy Res. 10, 902021. In press (this research topic). doi:10.3389/fenrg.2022.902021
Pulselli, R. M., Marchi, M., Neri, E., Marchettini, N., and Bastianoni, S. (2019). Carbon accounting framework for decarbonisation of European city neighbourhoods. J. Clean. Prod. 208, 850–868. doi:10.1016/j.jclepro.2018.10.102
Raadal, H. L., Vold, B. I., Myhr, A., and Nygaard, T. A. (2014). GHG emissions and energy performances of offshore wind power. Renew. Energy 66, 314–324. doi:10.1016/j.renene.2013.11.075
Rémouit, F., Chatzigiannakou, M. A., Bender, A., Temiz, I., Sundberg, J., and Engström, J. (2018). Deployment and maintenance of wave energy converters at the lysekil research site: A comparative study on the use of divers and remotely-operated vehicles. J. Mar. Sci. Eng. 6, 39. doi:10.3390/jmse6020039
Resinex (2007). Support and Mooring Buoys - the widest range of floating equipment. Available at: https://www.resinextrad.com/en/wp-content/uploads/2007/06/Support-and-Mooring-Buoys.pdf (Accessed April 20, 2022). [Personal communication from Business development manager of Resinex].
Russel, I., (2007). Inventory materials of 7 MW wave dragon [personal communication from business development manager of wave dragon firm].
Sgobbi, A., Simões, S. G., Magagna, D., and Nijs, W. (2016). Assessing the impacts of technology improvements on the deployment of marine energy in Europe with an energy system perspective. Renew. Energy. 89, 515–525. doi:10.1016/j.renene.2015.11.076
Short, A. D. (2012). Coastal processes and beaches. Nat. Educ. Knowl. 3 (10), 15. Available at: https://www.nature.com/scitable/knowledge/library/coastal-processes-and-beaches-26276621/(Accessed April 5, 2022).
Sørensen, H. C., Friis-Madsen, E., Russel, I., Parmeggiani, S., and Fernández-Chozas, J. (2016). Feasibility and LCA for a Wave Dragon platform with wind turbines. Available at: https://onepetro.org/ISOPEIOPEC/proceedings-abstract/ISOPE16/All-ISOPE16/ISOPE-I-16-546/17011 (Accessed March 27, 2022).
Sørensen, H. C., Naef, S., Anderberg, S., and Hauschild, M. Z. (2006). “Life cycle assessment of the wave energy converter: Wave Dragon,” in Proceedings of the International Conference on Ocean Energy, Bremerhaven, Germany, 23–24 October, 2016.
Sovacool, B. (2008). Valuing the greenhouse gas emissions from nuclear power: A critical survey. Energy Policy 36, 2950–2963. doi:10.1016/j.enpol.2008.04.017
Spanos, P. D., Strati, F. M., Malara, G., and Arena, F. (2018). An approach for non-linear stochastic analysis of U-shaped OWC wave energy converters. Probabilistic Eng. Mech. 54, 44–52. doi:10.1016/j.probengmech.2017.07.001
Strömstedt, E., Svensson, O., and Leijon, M. (2012). “A set-up of 7 laser triangulation sensors and a draw-wire sensor for measuring relative displacement of a piston rod mechanical lead-through transmission in an offshore wave energy converter on the ocean floor,” in International scholarly research notices London, United Kingdom: Hindawi. doi:10.5402/2012/746865
Taylor, C. (2006). Inventory materials of 750 kW Pelamis [personal communication from chief engineer of Pelamis farm, OPD].
Thomson, R. C., Chick, J. P., and Harrison, G. P. (2019). An LCA of the Pelamis wave energy converter. Int. J. Life Cycle Assess. 24, 51–63. doi:10.1007/s11367-018-1504-2
Thomson, R. C., Harrison, G. P., and Chick, J. P. (2011). “Full life cycle assessment of a wave energy converter,” in Proceedings of the IET Conference on Renewable Power Generation (RPG 2011), Edinburgh, UK, 6–8 September. doi:10.1049/cp.2011.0124
Tsai, L., Kelly, J. C., Simon, B. S., Chalat, R. M., and Keoleian, G. A. (2016). Life cycle assessment of offshore wind farm siting - effects of locational factors, lake depth, and distance from shore. J. Industrial Ecol. 20, 1370–1383. doi:10.1111/jiec.12400
Uihlein, A. (2016). Life cycle assessment of ocean energy technologies. Int. J. Life Cycle Assess. 21, 1425–1437. doi:10.1007/s11367-016-1120-y
Walker, S., and Howell, R. (2011). Life cycle comparison of a wave and tidal energy device (Sheffield (UK): University of Sheffield). [dissertation/Ph. D’s thesis].
Zepeda, L. G. (2017). Life cycle assessment of a wave energy converter. (Stockholm (S): KTH Royal Institute of Technology). [dissertation/Bachelor’s thesis]
Keywords: ocean energy, energy transition, life cycle assessment, carbon footprint, carbon intensity of electricity
Citation: Bruno M, Maccanti M, Pulselli RM, Sabbetta A, Neri E, Patrizi N and Bastianoni S (2022) Benchmarking marine renewable energy technologies through LCA: Wave energy converters in the Mediterranean. Front. Energy Res. 10:980557. doi: 10.3389/fenrg.2022.980557
Received: 28 June 2022; Accepted: 04 August 2022;
Published: 29 September 2022.
Edited by:
Muhammad Shafique, Brunel University London, United KingdomReviewed by:
Sheng Xu, Jiangsu University of Science and Technology, ChinaMohd Rosdzimin Abdul Rahman, National Defence University of Malaysia, Malaysia
Mark Mba Wright, Iowa State University, United States
Copyright © 2022 Bruno, Maccanti, Pulselli, Sabbetta, Neri, Patrizi and Bastianoni. This is an open-access article distributed under the terms of the Creative Commons Attribution License (CC BY). The use, distribution or reproduction in other forums is permitted, provided the original author(s) and the copyright owner(s) are credited and that the original publication in this journal is cited, in accordance with accepted academic practice. No use, distribution or reproduction is permitted which does not comply with these terms.
*Correspondence: Riccardo Maria Pulselli, cmljY2FyZG9tYXJpYS5wdWxzZWxsaUB1bmlmaS5pdA==
 Morena Bruno
 Matteo Maccanti
 Riccardo Maria Pulselli
 Alessio Sabbetta
 Elena Neri
 Nicoletta Patrizi
 Simone Bastianoni