 Yongming Li
 Ang Luo
 Xi Chen2
 Cheng Chang
94% of researchers rate our articles as excellent or good
Learn more about the work of our research integrity team to safeguard the quality of each article we publish.
Find out more
ORIGINAL RESEARCH article
Front. Energy Res., 19 September 2022
Sec. Advanced Clean Fuel Technologies
Volume 10 - 2022 | https://doi.org/10.3389/fenrg.2022.979526
This article is part of the Research TopicThe Challenge and Opportunity of CCUS in the Development of Unconventional ResourceView all 15 articles
Distributions of pore pressure and water saturation in matrix around fractures after hydraulic fracturing and shut-in period will impact the shale gas well production significantly. However, the influences of hydraulic fracturing and shut-in period on pore pressure and water saturation are not considered in the classical reservoir simulations. In this work, the embedded discrete fracture model (EDFM), which is convenient to be coupled with an existing reservoir simulator with high computational efficiency, was employed to simulate the hydraulic fracture propagation coupled with matrix flow. Then, we developed a model for simulating the integration process of hydraulic fracturing, shut-in period, and well production based on the dual media theory. Distributions of pore pressure and water saturation varying in different periods and the production decline of shale gas well were obtained through the integrated simulation model. The calculation result was validated by the field bottom hole pressure data of a shale gas well in Sichuan Province, China. Simulation results show that the variation of bottom hole pressure is not smooth during the fracture propagation process because the initiations of different fractures are not simultaneous. The fracturing fluid flow-back rate of shale gas well is much lower than that of conventional reservoirs. There is still a large amount of fracturing fluid retained in micro-fracture systems and matrix of shale after production. It is also found that the permeability of the micro-fracture system determines the drop rate of bottom hole pressure and the size of stimulated reservoir volume (SRV) determines the decrease amplitude of bottom hole pressure.
At present, shale gas has become an important part of unconventional oil and gas resources (Yue et al., 2020; Zhou et al., 2021; Zhao et al., 2022). Hydraulic fracturing is a key technology in shale gas development (Zhang et al., 2022a; Zhang et al., 2022b). And the fracturing fluid leak-off during hydraulic fracturing impacts the distributions of pore pressure and water saturation of matrix around hydraulic fractures significantly. However, the three stages in the life of shale gas well development are not fully considered in current reservoir simulations. Taking into consideration the effects of invaded fracturing fluid, it is important for simulation and prediction of shale gas well production to obtain the distributions of pore pressure and water saturation in the reservoir after fracturing and shut-in period. To achieve that, a model which can simulate the integration process of hydraulic fracturing, shut-in period, and well production is essential.
In the hydraulic fracturing studies, Carter leak-off equation (Zhao et al., 2020) and Darcy’s law (Salimzadeh et al., 2017; Wang et al., 2017; Wang et al., 2020a) are often employed to describe the fracturing fluid invasion during hydraulic fracturing. Usually only the leak-off volume of fracturing fluid can be recorded in current fracture propagation models; the fluid flow in reservoir is not considered. And the distributions of pore pressure and water saturation varying in hydraulic fracturing periods also cannot be described. Therefore, coupling the fracture propagation with the fluid flow in the reservoir becomes an important issue. The embedded discrete fracture model (EDFM) (Li and Lee, 2008), which is widely used to describe hydraulic fractures in reservoir simulation, becomes a possible solution.
In recent years, the EDFM is very popular due to its high compatibility with existing reservoir simulators (Yu et al., 2018; Dong et al., 2019; Zhang et al., 2020; Zhu et al., 2020). This method can smoothly embed fractures in the reservoir without impacting the existing grid. And the EDFM is both suitable for Cartesian grids (Cavalcante-Filho et al., 2015; Cavalcante-Filho and Sepehrnoori, 2017; Du et al., 2017) and unstructured grids (Xu et al., 2019). In addition, the EDFM overcomes shortcomings of complex grid division and low computational efficiency brought by discrete-fracture models (DFMs) (Xu et al., 2017). And the EDFM has been applied in various situations of reservoir simulation, such as the simulation of CO2 Huff-n-Puff process (Sun et al., 2019) and the history matching (Dachanuwattana et al., 2018). In this study, the EDFM coupled fluid flow in reservoir with fracture propagation. And this method is also used to simulate shut-in period and production of shale gas well.
Current researches show that capillary pressure guides fracturing fluid invade into the matrix during shut-in period, which changes the distributions of pore pressure and water saturation in the matrix (Ghanbari and Dehghanpour, 2016; Shen et al., 2016; Liu et al., 2017; Liang et al., 2021; Liu et al., 2021) and may enhance the viscosity of shale (Peng et al., 2020a). The pressure gradient caused by hydraulic fracturing also guides the fluid flow between fractures and matrix during shut-in period (Zhao et al., 2019; Wang et al., 2020b). The influences of capillary pressure and pressure gradient caused by hydraulic fracturing on pore pressure and water saturation in the matrix become more and more significant when the shut-in continues. And this process can impact the initial productivity of shale gas well and the flow-back rate of fracturing fluid (Fakcharoenphol et al., 2016). In order to analysis the influence of shut-in time on the production and fracturing fluid flow-back rate of shale gas well, it is essential to compare the simulation results of different shut-in times.
In this paper, we developed a model for simulating the integration process of hydraulic fracturing, shut-in period, and well production based on the EDFM and the dual media model. The EDFM was employed to develop the hydraulic fracture propagation model coupled with matrix flow. And the distributions of pore pressure and water saturation varying in different periods and the production decline of shale gas well were obtained through the above integrated simulation model. Then, how the shut-in time impacts the production of shale gas well was discussed. Finally, the influences of the size of SRV and the permeability of micro-fracture system on bottom hole pressure during shut-in period were analyzed.
Distributions of pore pressure and water saturation and the parameters of fractures after hydraulic fracturing directly impact the shut-in and production process of shale gas well. The fracture morphology and propagation patterns of hydraulic fracture are the main focus in current fracture propagation models (Zhao et al., 2015; Peng et al., 2019; Peng et al., 2020b). Therefore, distribution changes of pore pressure and water saturation in reservoir during hydraulic fracturing were not fully considered in current fracture propagation models. Unfortunately, it is difficult to smoothly couple fluid flow in the reservoir with the existing fracture propagation models. In this paper, the embedded discrete fracture model (EDFM), which has good compatibility with reservoir simulators and outstanding computational efficiency (Wang et al., 2021), is the method to solve this problem. The EDFM is a fracture description method widely used in reservoir simulator. In the two-dimensional (2D) reservoir model, a fracture described by the EDFM will be divided into multiple fracture segments by reservoir grid, as shown in Figure 1.
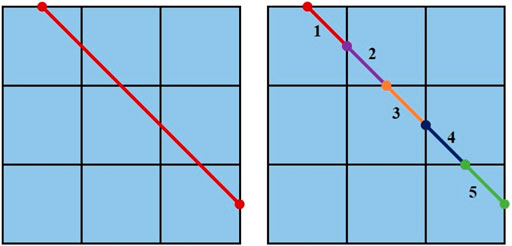
FIGURE 1. Explanation of fracture segments division in the EDFM.
In the 2D reservoir model, the fluid flow between fracture segments is one-dimensional. There is flow exchange between each fracture segment and the micro-fracture cell which is intersected by a fracture segment. Therefore, the fluid flow in the fracture can be described by
where
When a fracture segment intersects the micro-fracture grid, the flow exchange between the fracture segment and the micro-fracture cell occurs under the pressure gradient.
where
Subsequently, the well-fracture flow was described by the EDFM and the Peaceman method (Moinfar et al., 2013). This method ignores the effect of wellbore friction:
where
where
The fracture propagation is judged by comparing the stress intensity factor

FIGURE 2. Schematic diagram of fracture propagation in the EDFM.
The stress intensity factor of the hydraulic fracture
where
Fracture toughness
Fluid flow in reservoir occurs in hydraulic fracturing, shut-in period and production of shale gas well. In order to take the fluid flow in the reservoir during fracturing and shut-in period into consideration, we developed a gas-water two-phase seepage model for shale reservoirs which considers shale gas desorption, Knudsen diffusion, slippage effect, stress sensitivity, and capillary pressure effect in dual media.
The description of the flow in hydraulic fractures is the same as Eq. 1 in the fracture propagation model. However, during the processes of shut-in period and well production have different boundary conditions in comparison to the hydraulic fracturing stage. However, the boundary conditions of shut-in period and well production are different form that of hydraulic fracturing stage.
During the shut-in period, the sum of the flow rate of each fracture is zero, which could be expressed as
The boundary condition in the production process is expressed as
The gas-water two-phase flow equation in micro-fracture system is
where
The gas-water two-phase flow equation in matrix is
where
where
where
For shale gas reservoirs with low and ultralow permeability, the following apparent permeability model proposed by Beskok and Karniadakis (1999) was employed to consider the gas slippage and diffusion effect:
where
The hydraulic fracture permeability and micro-fracture permeability will decrease respectively with the decrease of fracture pressure and micro-fracture pressure, which is the stress sensitive effect. And exponential stress sensitivity formula is introduced into the model:
where
We set up a reservoir model with dimensions of 350 m × 180 m, as shown in Figure 3A. A 180 m length hydraulic fracturing stage was selected and six initial fractures of 3 m length were placed in the reservoir intersecting with the horizontal well. The Cartesian grids with grid size of 1 m × 1 m were used to divide the reservoir and fracture. And the initial fracture segments are three so that the fluid flow can be described by the EDFM. Table 1 lists the basic parameters of reservoir and fractures for a shale gas well in Sichuan Province, China. Fracture height is assumed to fully penetrate reservoir thickness. Gas desorption is considered using Langmuir isotherm, which is widely used in shale gas reservoir simulators. Figure 3B shows relative permeability curves for the matrix, micro-fracture, and hydraulic fracture, respectively. Figures 3C,D show capillary pressure curves of matrix and micro-fracture system.
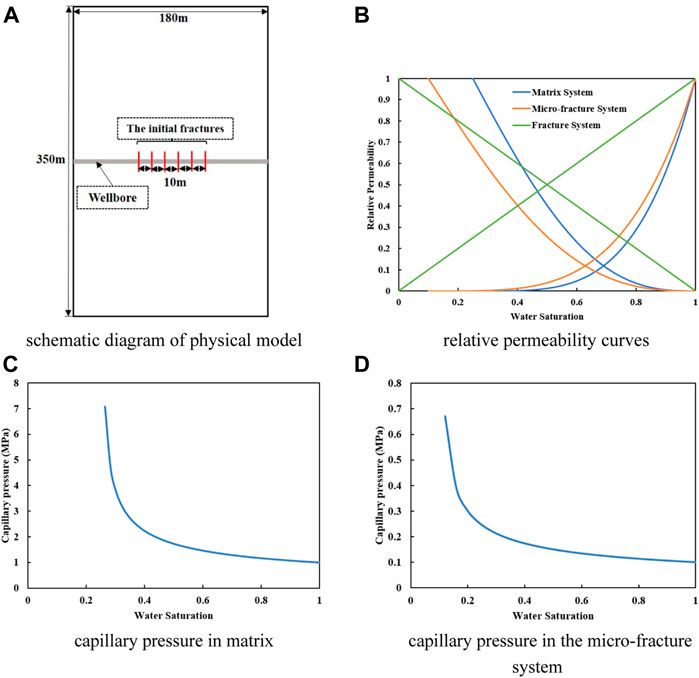
FIGURE 3. Parameters of the simulations. (A) Schematic diagram of physical model. (B) Relative permeability curves. (C) Capillary pressure in matrix. (D) Capillary pressure in the micro-fracture system.
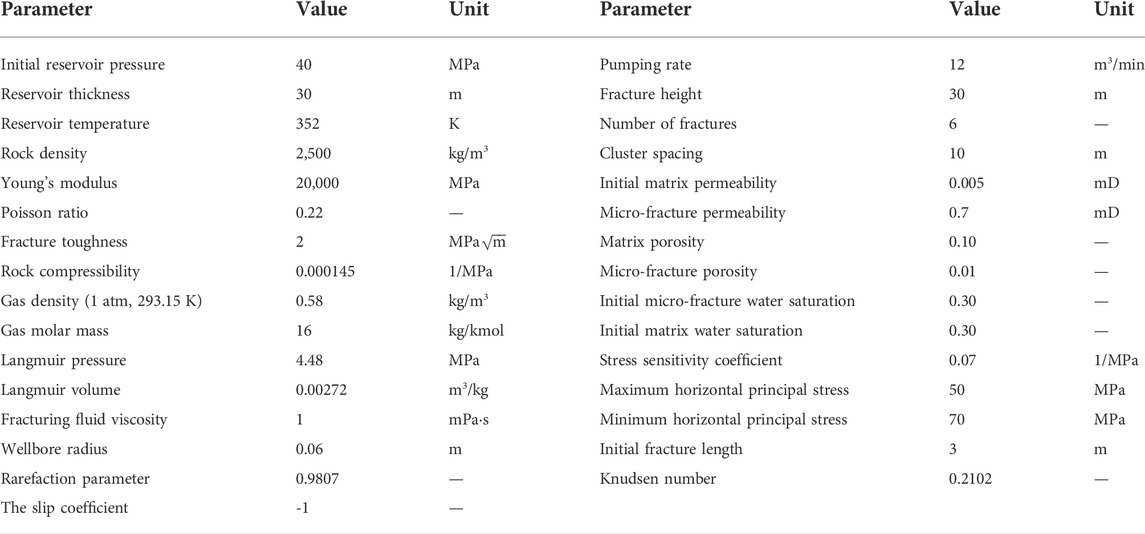
TABLE 1. Basic parameters used for the simulations.
Bottom hole pressure of shale gas well during hydraulic fracturing and shut-in period was obtained by the integrated model based on the parameters in Table 1. And the simulation results were compared with the bottom hole pressure during actual fracturing stimulation in Figure 4. It is evident that the simulated results are in good agreement with the actual data. Bottom hole pressure has a gradual upward trend during hydraulic fracturing. But the variation range of the actual data is larger, which is mainly caused by the instability of pumping rate. Therefore, the integrated model in this paper has a high accuracy.
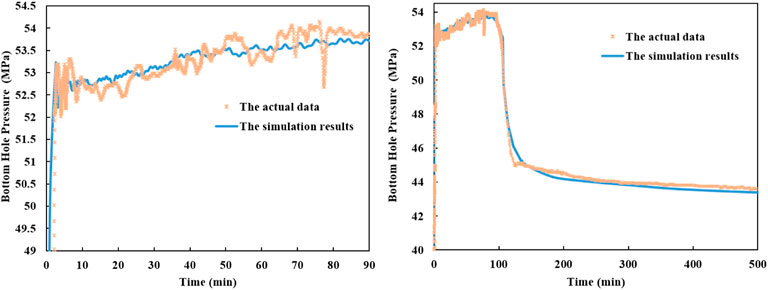
FIGURE 4. Comparison between the actual data and the simulation results in bottom hole pressure.
The distributions of pore pressure and water saturation in reservoir during the hydraulic fracturing period were obtained based on the parameters in Table 1. The water saturation of the matrix changes little during hydraulic fracturing process due to low permeability. Therefore, the distribution of water saturation in matrix was not shown in the figures. Figure 5 shows the pore pressure distributions in micro-fracture system and matrix at different times, respectively. These simulation results show that the inner pressure of micro-fracture system and matrix around hydraulic fractures increases gradually with time during hydraulic fracturing stage. The pressure diffusion range in the micro-fracture system and matrix also expand with time gradually. The pore pressure of micro-fracture system and matrix between the first and sixth hydraulic fractures is much higher than that outside the above area. Because the flow of fracturing fluid in the reservoir between hydraulic fractures is hindered. The pore pressure in matrix increases slower than that in micro-fracture system, because there is a large seepage resistance between the matrix and the micro-fracture system.
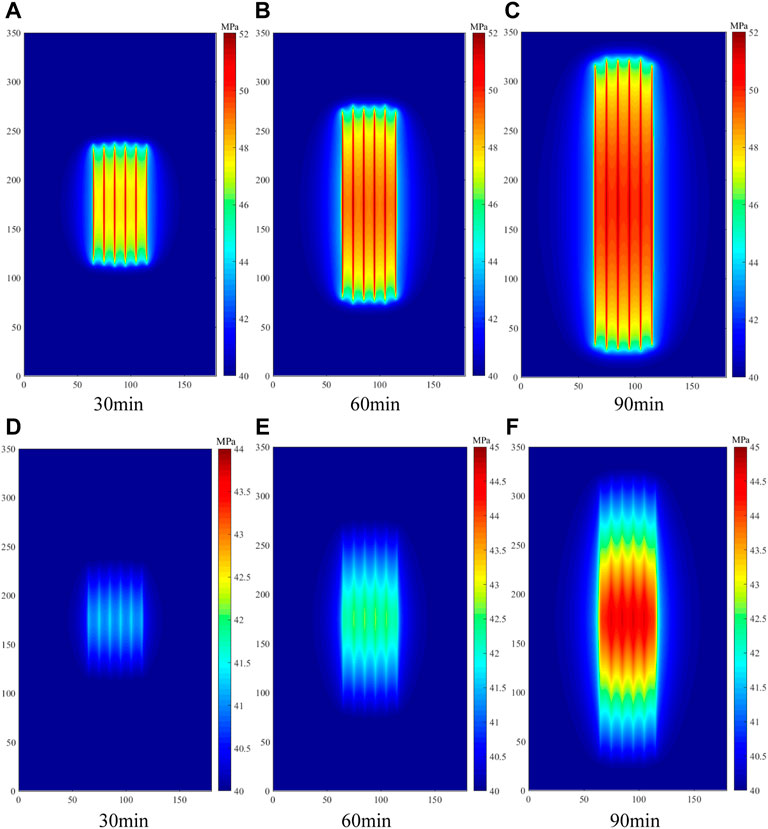
FIGURE 5. Distribution of pressure in the micro-fracture system and matrix during fracture propagation. (In (A–C), the range of pressure in the micro-fracture system is from 40 to 52 MPa. In (D), the range of pressure in matrix is from 40 to 44 MPa. In (E,F), the range of pressure in the matrix is from 40 to 45 MPa).
Figures 6A–C show the variation of water saturation distribution in micro-fracture system during hydraulic fracturing. The variation of water saturation distribution in matrix is small during hydraulic fracturing due to the low permeability and shot stimulation time, so it is not shown. It is evident from these figures that water saturation of micro-fracture system around hydraulic fractures is positively correlated with time. And the influenced range of water saturation in micro-fracture system increases gradually with time. Moreover, the invasive range of fracturing fluid in micro-fracture system is significantly smaller than the spreading range of high pressure in micro-fracture system at the same time. The reason: relative permeability of water is much smaller than that of gas at the initial water saturation of micro-fracture system. Besides, gas has strong compressibility and expands more easily. The invasive range of fracturing fluid in micro-fracture system around different hydraulic fractures is shown in Figure 6D. It is found that the invasive ranges of the first and sixth hydraulic fractures far from other fractures are larger than those between first and sixth hydraulic fractures. This is a symptom of the inhibition of fluid flow in the reservoir area between hydraulic fractures.
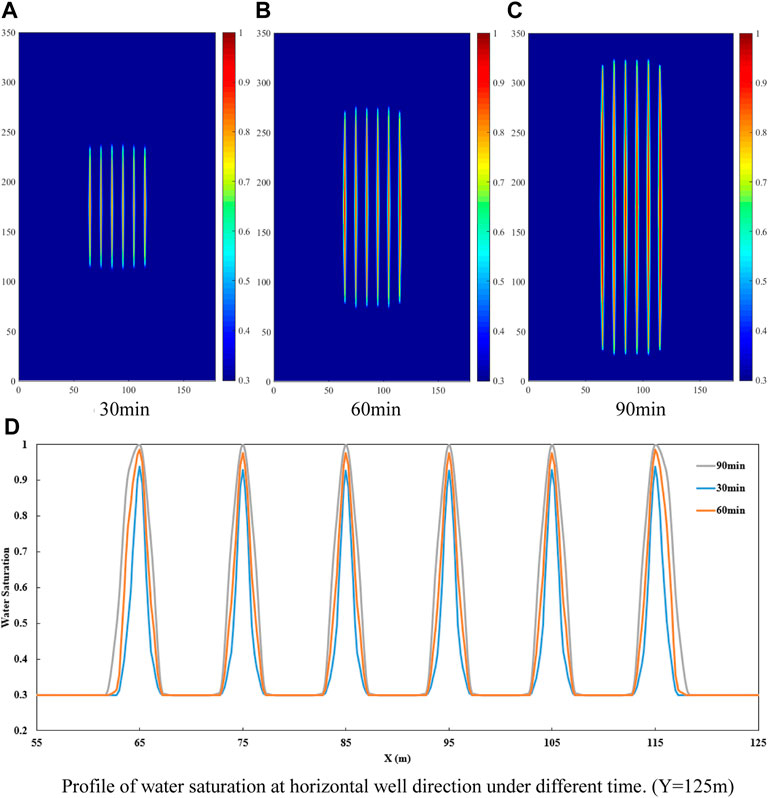
FIGURE 6. Distribution of water saturation in micro-fracture during fracture propagation. (In (A–C), the range of water saturation is from 0.3 to 1.0. (D) is profile of water saturation which is drawn from the data in the figure of water saturation distributon in micro-fracture during fracture propagation (such as (A–C) and so on)).
Bottom hole pressure curves in Figure 7 show that hydraulic fracturing is a step-by-step process, which consists of fracture initiating, fluid filling, and fracture re-initiating. First, bottom hole pressure increases gradually with the pumping of fracturing fluid. When
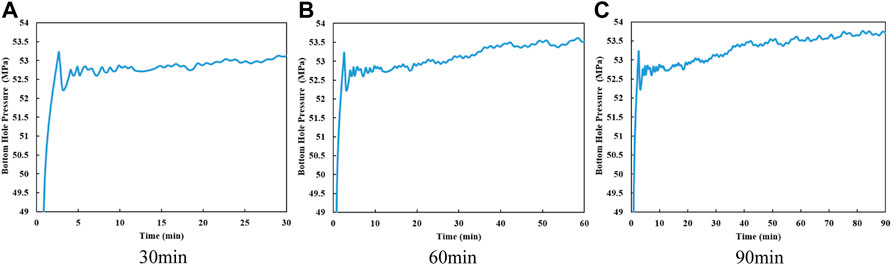
FIGURE 7. Curves of bottom hole pressure after 30 min, 60 min, and 90 min of hydraulic fracturing. (wellbore resistance is neglected, and the bottom hole pressure is the same in the fracturing section).
In the shut-in period, the pumping rate drops to zero. Figure 8 shows the distributions of pressure in micro-fracture system and matrix during the shut-in period, respectively. As shown in these figures, the high pressure of micro-fracture system and matrix brought by hydraulic fracturing gradually spreads to the deeper formation with the increase of shut-in time. Pressure spreads in the micro-fracture system slightly faster than the matrix due to the low permeability of matrix.
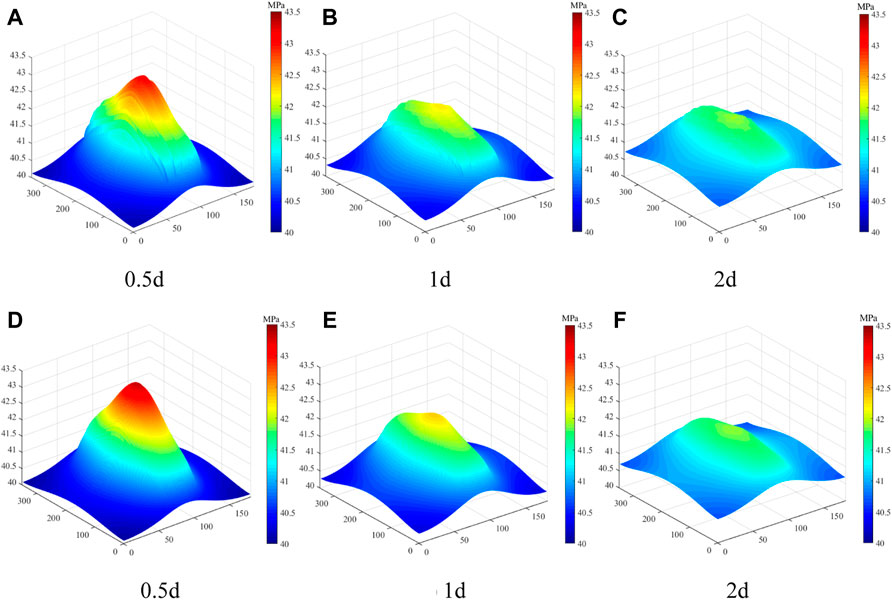
FIGURE 8. Distribution of pressure in micro-fracture system and matrix during shut-in period. (The range of pressure is from 40 to 43.5 MPa. The distribution of pressure in micro-fracture system is shown in (A–C). The distribution of pressure in matrix is shown in (D–F).
Figure 9 shows that the fracturing fluid, which invaded into micro-fracture, continues to flow into the deeper formation under the pressure gradient and capillary pressure. The invasive range of fracturing fluid increases with shut-in time. Fig.(d) shows the profile of water saturation in micro-fracture system during shut-in period. Micro-fracture water saturations around the first fracture and sixth fracture decrease fast. And the invasive ranges of fracturing fluid around the first fracture and sixth fracture are the largest. Moreover, locations of the maximum water saturation in micro-fracture system around the first fracture and sixth fracture are not the same as the locations of these fractures under the action of pressure gradient.
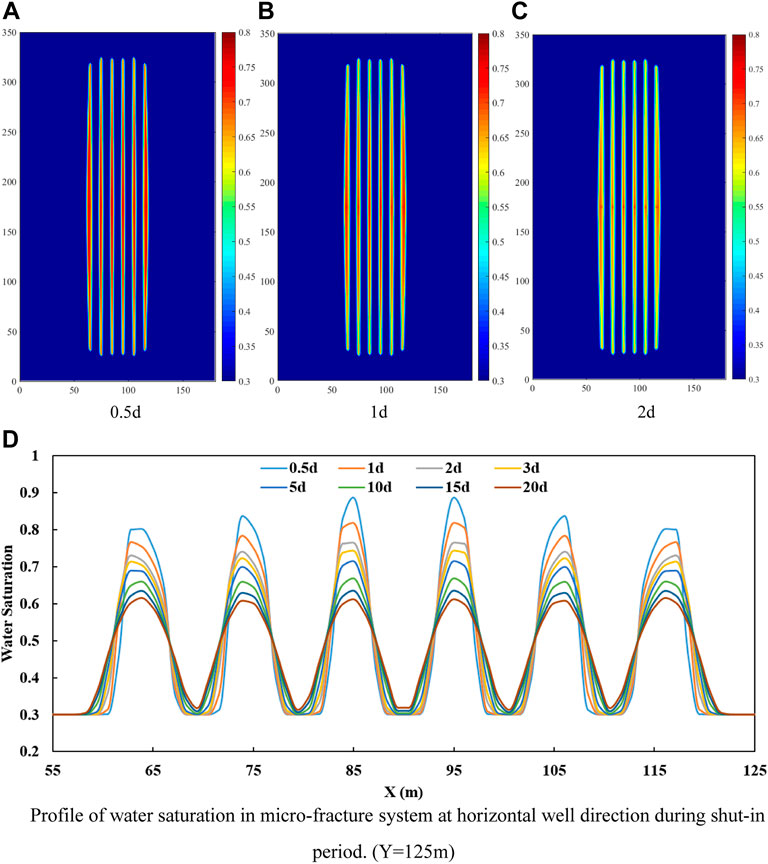
FIGURE 9. Distribution of water saturation in micro-fracture system during shut-in period. (In (A–C), the range of water saturation is from 0.3 to 0.8. (D) is profile of water saturation which is drawn from the data in the figure of water saturation distribution in micro-fracture system during shut-in period (such as (A–C) and so on).
Figure 10 shows that capillary pressure and pressure gradient change the distribution of water saturation in the matrix during shut-in period. The matrix pressure around the middle hydraulic fractures is slightly higher than the micro-fracture pressure around the middle hydraulic fractures at the same shut-in time (Figure 8). But the strong capillary pressure in the matrix (Figure 3C) also guides fracturing fluid flow gradually into matrix from micro-fracture system. Figure 10 also shows that water saturation of matrix and the invasive range of fracturing fluid in matrix are positively correlated with the shut-in time.
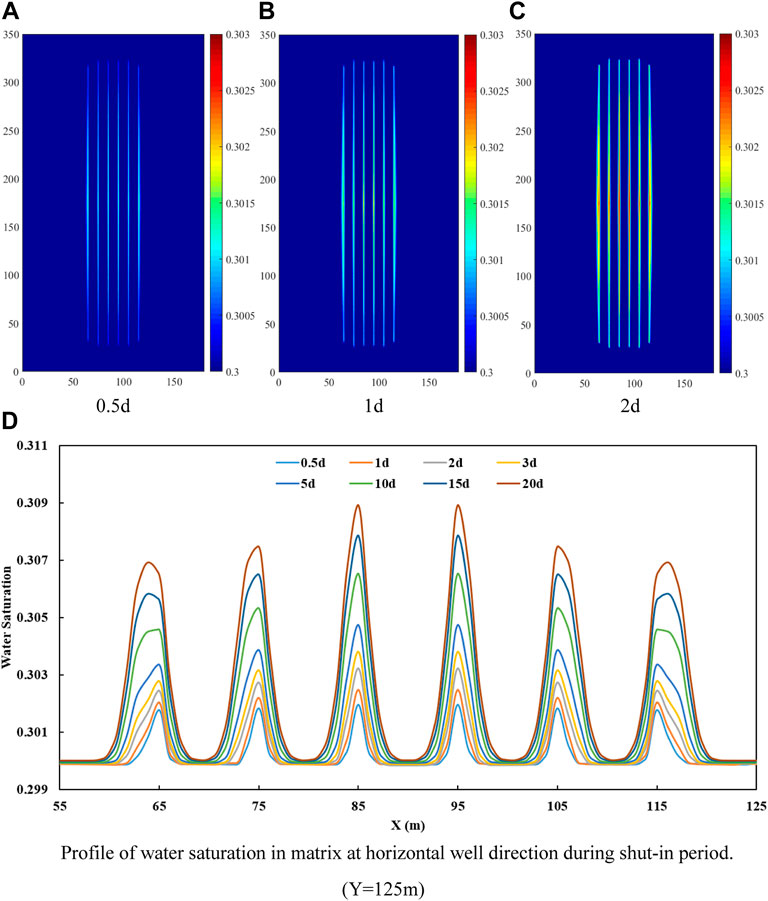
FIGURE 10. Distribution of water saturation in matrix during shut-in period. (In (A–C), the range of water saturation is from 0.3 to 0.303. (D) is profile of water saturation which is drawn from the data in the figure of water saturation distribution in matrix during shut-in period (such as (A–C) and so on)).
Figure 11 shows the bottom hole pressure from fracturing to shut-in period. Bottom hole pressure is high during the hydraulic fracturing. When shut-in period begins, the pumping rate of fracturing fluid drops to zero and bottom hole pressure declines rapidly. Moreover, bottom hole pressure becomes steady gradually with the increase of shut-in time.
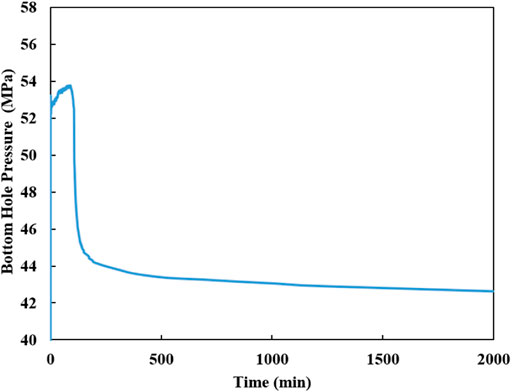
FIGURE 11. Bottom hole pressure curve from hydraulic fracturing to shut-in period.
The production of shale gas well begins after shut-in period. In this paper, bottom hole pressure is constant during production (
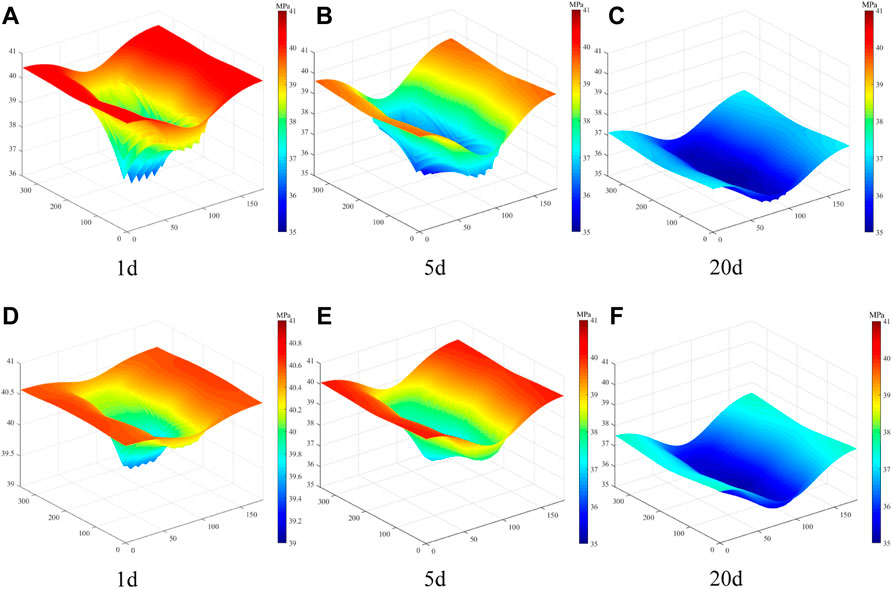
FIGURE 12. Distribution of pressure in micro-fracture system and matrix during production period. (In (A–C), the range pressure in micro-fracture system is from 35 to 41 MPa. In (D), the range of pressure in matrix is 39–41 MPa. In (E,F), the range of pressure in matrix is from 35 to 41 MPa)
It is evident from Figure 13A that the shale gas well has a high initial gas production rate in the early stage of production (Luo et al., 2021) because water saturation of hydraulic fractures decreases gradually during shut-in period. Gas production of the initial stage mainly comes from hydraulic fractures and daily gas production also decreases slightly as the pressure in the fractures drops. Then gas in micro-fracture system flows into hydraulic fractures, which increases the gas saturation of hydraulic fractures and daily gas production. At the end of this event, daily gas production decreases gradually after reaching the peak. Figure 13B shows that the cumulative water production is 265.17 m3 after producing 20 days. It is less than 30% of the total injection volume of fracturing fluid (the total injection volume of fracturing fluid is 1080 m3). There is still a large amount of fracturing fluid retained in micro-fracture system and matrix after 20 days production.
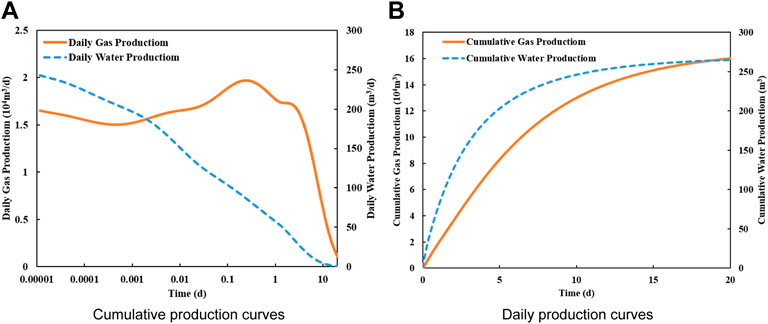
FIGURE 13. Curves of daily production and cumulative production of shale gas well. (A) is daily production curves. (B) is cumulative production curves.
The shale gas well productivities under different shut-in times were simulated by integrated model to analyze the relationship between shut-in time and production of shale gas well.
Figures 14A,B show daily gas production and daily water production under different shut-in times. Figure 14A shows that the daily gas production at the early period of production increases with the increase of shut-in time. The increase rate of daily gas production decreases gradually with the increase of shut-in time. The daily water production at the early period of production is negatively correlated with shut-in time, as shown in Figure 14B. It is evident that the invasive fracturing fluid gradually flows into the deeper formation with the increase of shut-in time. Water saturations of hydraulic fractures and micro-fracture system around hydraulic fractures decrease, which causes a high production capacity at the early period. The optimal shut-in time was suggested as 10 days combining Figures 14A–C.
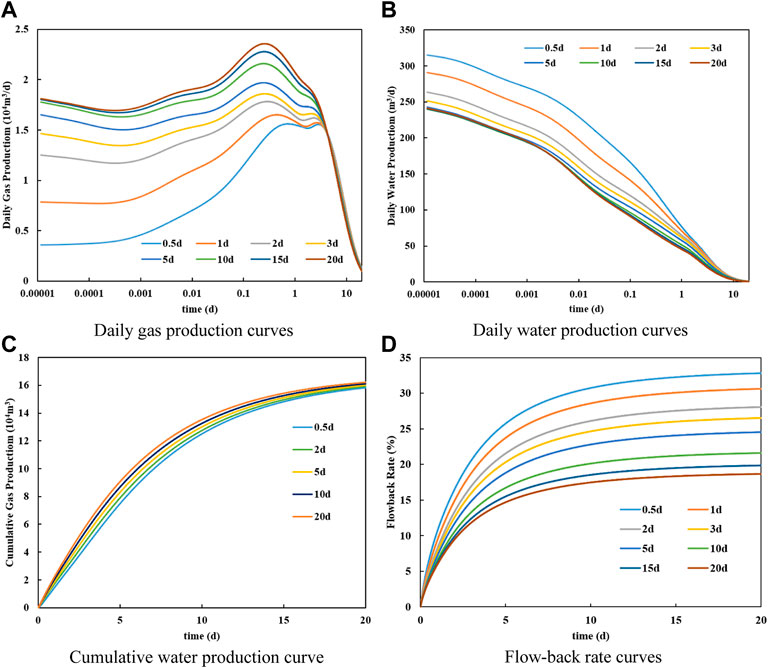
FIGURE 14. Production curves of shale gas well under different shut-in times. (A) Daily gas production curves. (B) Daily water production curves. (C) Cumulative water production curve. (D) Flow-back rate curves.
Figure 14D shows that the flow-back rate was negatively correlated with the shut-in time. The volume of invasive fracturing fluid in the matrix gradually increases with the increase of shut-in time. And the invasion range of fracturing fluid in micro-fracture system and matrix gradually expands with the increase of shut-in time. It is difficult to bring the invasive fracturing fluid in micro-fracture system and matrix out of the formation.
A high permeability area is often formed around hydraulic fractures after hydraulic fracturing in the shale reservoir. And the volume of this area is Stimulated Reservoir Volume (SRV), which is the key index of hydraulic fracturing evaluation. In this paper, the micro-fracture system was used to describe the area of SRV in the reservoir. The range of SRV and the permeability of micro-fracture system influence the pressure transmission in the reservoir, which impacts the bottom hole pressure during shut-in period. Bottom hole pressures of different cases in Table 2 were simulated by the integrated model.
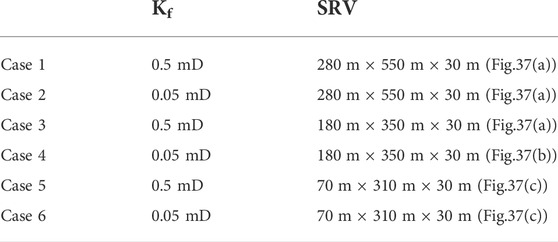
TABLE 2. Parameters used for the simulations.
Figures 15D,E show that the range of SRV and the permeability of micro-fracture system are negatively correlated with the bottom hole pressure during the shut-in period. It is difficult for high pressure in micro-fracture system caused by hydraulic fracturing to spread to deeper formation when the range of SRV is small. Bottom hole pressures of cases 5 and 6 are still higher than that of other cases after a long time shut-in. When the micro-fracture permeability becomes higher (cases 1, 3, and 5), high pressure in micro-fracture system caused by hydraulic fracturing can spread to deeper formation conveniently. Bottom hole pressures of cases 1, 3, and 5 are lower than that of cases 2, 4, and 6 after a long time shut-in. The permeability of micro-fracture system determines the drop rate of bottom hole pressure and the size of SRV determines the amplitude of decreased pressure.
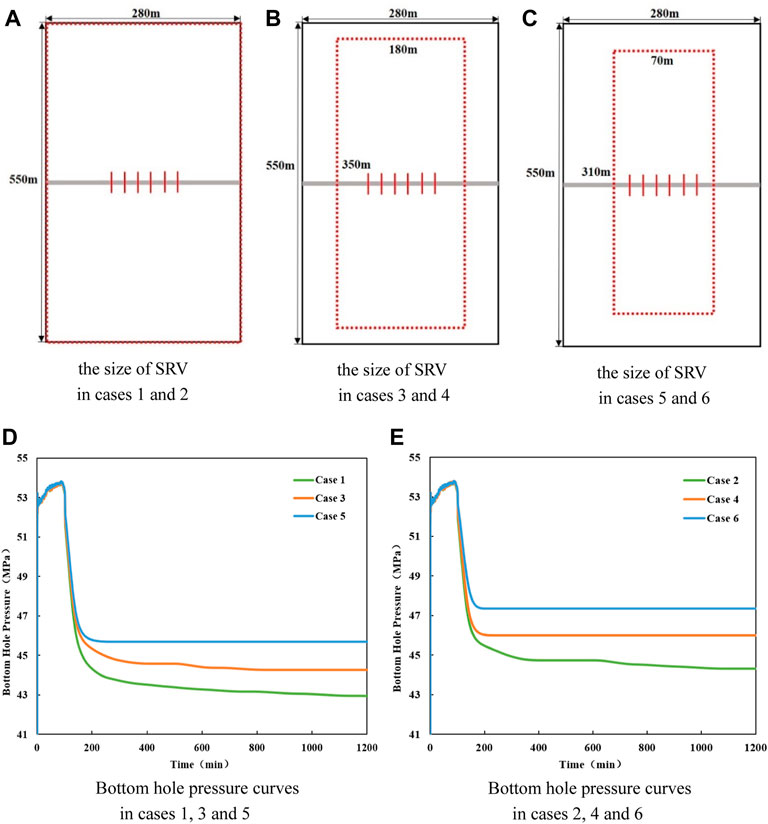
FIGURE 15. The size of SRV and bottom hole pressure curves in different cases. (A) The size of SRV in cases 1 and 2. (B) The size of SRV in cases 3 and 4. (C) The size of SRV in cases 5 and 6. (D) Bottom hole pressure curves in cases 1, 3 and 5. (E) Bottom hole pressure curves in cases 2, 4 and 6.
A model for simulating the integration process of hydraulic fracturing, shut-in period, and well production is developed. The distributions of pore pressure and water saturation varying in different periods and the production decline of shale gas well are obtained through the integrated simulation model. And the impact of shut-in time on production of shale gas well is also discussed. Moreover, the influences of the size of SRV and the permeability of micro-fracture system on bottom hole pressure during shut-in period are analyzed.
1) In hydraulic fracturing process, the distributions of pore pressure and water saturation in micro-fracture system and matrix around hydraulic fractures are impacted by the fracturing fluid leak-off. The invasive range of fracturing fluid and the spreading ranges of high pressure in the reservoir around hydraulic fractures increase with time. The variation range of bottom hole pressure is not the same during the fracture propagation process because the initiations of different hydraulic fractures are not simultaneous.
2) During shut-in period, the high pressure in the reservoir brought by hydraulic fracturing spreads to the deeper formation with the increase of shut-in time. And the invasive range of fracturing fluid in the reservoir also increases with the shut-in time. The distribution of water saturation in matrix changes significantly during shut-in period due to the influences of capillary pressure and pressure gradient. The bottom hole pressure drops rapidly during shut-in period due to pressure transmission.
3) In production process, the pore pressure in the reservoir around hydraulic fractures drops rapidly. And daily gas production of shale gas well shows a falling-rising-falling trend. The flow-back rate of fracturing fluid is less than 30% of the total volume of fracturing fluid. And there is still a large amount of fracturing fluid retained in micro-fracture system and matrix after production.
4) With the increase of shut-in time, the daily gas production increases and the daily water production decreases gradually. A 10 days optimal shut-in time of the shale gas well in Sichuan Province, China was suggested by comparing the gas production under different shut-in times. The invasion range of fracturing fluid in micro-fracture system and matrix gradually expands with the increase of shut-in time. The flow-back rate is negatively correlated with the shut-in time.
5) The range of SRV and the permeability of micro-fracture system are negatively correlated with the bottom hole pressure during shut-in period. And the permeability of the micro-fracture system determines the drop rate of bottom hole pressure, and the size of SRV determines the amplitude of decreased pressure.
The original contributions presented in the study are included in the article/supplementary material, further inquiries can be directed to the corresponding author.
YL, AL, and XC contributed to conception and design of the study. AL wrote the first draft of the manuscript. LC, CC, and WX wrote sections of the manuscript.
This study was supported by the Science and Technology Cooperation Project of the CNPC-SWPU Innovation Alliance, the National Natural Science Foundation of China (Grant no. U19A2043, U21B2071, and 52174033), and Natural Science Foundation of Sichuan Province (NSFSC) (No. 2022NSFSC0971).
Authors XC and LC was employed by PetroChina Xinjiang Oilfield Company. CC and WX PetroChina Southwest Oil & Gas Field Company.
The remaining authors declare that the research was conducted in the absence of any commercial or financial relationships that could be construed as a potential conflict of interest.
All claims expressed in this article are solely those of the authors and do not necessarily represent those of their affiliated organizations, or those of the publisher, the editors and the reviewers. Any product that may be evaluated in this article, or claim that may be made by its manufacturer, is not guaranteed or endorsed by the publisher.
Beskok, A., and Karniadakis, G. E. (1999). Report: A model for flows in channels, pipes, and ducts at micro and nanoscales. Microscale Thermophys. Eng. 3 (1), 43–77. doi:10.1080/108939599199864
Cavalcante Filho, J. S. D. A., and Sepehrnoori, K. (2017). Simulation of planar hydraulic fractures with variable conductivity using the embedded discrete fracture model. J. Petroleum Sci. Eng. 153, 212–222. doi:10.1016/j.petrol.2017.03.049
Cavalcante-Filho, J. S. A., Shakiba, M., and Moinfar, A. (2015). Implementation of a preprocessor for embedded discrete fracture modeling in an IMPEC compositional reservoir simulator. Houston, Texas, Usa: The Spe Reservoir Simulation Symposium.
Dachanuwattana, S., Xia, Z., Yu, W., Qu, L., Wang, P., Liu, W., et al. (2018). Application of proxy-based MCMC and EDFM to history match a shale gas condensate well. J. Petroleum Sci. Eng. 167, 486–497. doi:10.1016/j.petrol.2018.04.025
Dong, Z., Li, W., Lei, G., Wang, H., and Wang, C. (2019). Embedded discrete fracture modeling as a method to upscale permeability for fractured reservoirs. Energies 12 (5), 812. doi:10.3390/en12050812
Du, S., Liang, B., and Lin, Y. (2017). Field study: Embedded discrete fracture modeling with artificial intelligence in permian basin for shale formation. San Antonio, Texas, Usa: The Spe Annual Technical Conference and Exhibition.
Fakcharoenphol, P., Torcuk, M., Kazemi, H., and Wu, Y. (2016). Effect of shut-in time on gas flow rate in hydraulic fractured shale reservoirs. J. Nat. Gas Sci. Eng. 32, 109–121. doi:10.1016/j.jngse.2016.03.068
Feng, Y., Jones, J. F., and Gray, K. E. (2016). A review on fracture-initiation and-propagation pressures for lost circulation and wellbore strengthening. Spe Drill. Complet. 31 (02), 134–144. doi:10.2118/181747-pa
Ghanbari, E., and Dehghanpour, H. (2016). The fate of fracturing water: A field and simulation study. Fuel 163, 282–294. doi:10.1016/j.fuel.2015.09.040
Li, L., and Lee, S. H. (2008). Efficient field-scale simulation of black oil in a naturally fractured reservoir through discrete fracture networks and homogenized media. SPE Reserv. Eval. Eng. 11 (04), 750–758. doi:10.2118/103901-pa
Liang, X., Liang, T., Zhou, F., Wang, C., Yang, K., Wei, D., et al. (2021). Impact of shut-in time on production after hydraulic fracturing in fractured shale gas formation: An experimental study. J. Nat. Gas Sci. Eng. 88, 103773. doi:10.1016/j.jngse.2020.103773
Liu, J., Sheng, J. J., Emadibaladehi, H., and Tu, J. (2021). Experimental study of the stimulating mechanism of shut-in after hydraulic fracturing in unconventional oil reservoirs. Fuel 300, 120982. doi:10.1016/j.fuel.2021.120982
Liu, Y., Leung, J. Y., Chalaturnyk, R., and Virues, C. J. J. (2017). Fracturing fluid distribution in shale gas reservoirs due to fracture closure, proppant distribution and gravity segregation. The Spe Unconventional Resources Conference. Calgary, Alberta, Canada. February 2017. IEEE.
Luo, A., Li, Y., Wu, L., Peng, Y., and Tang, W. (2021). Fractured horizontal well productivity model for shale gas considering stress sensitivity, hydraulic fracture azimuth, and interference between fractures. Nat. Gas. Ind. B 8 (3), 278–286. doi:10.1016/j.ngib.2021.04.008
Moinfar, A., Varavei, A., Sepehrnoori, K., and Johns, R. T. (2013). Development of a coupled dual continuum and discrete fracture model for the simulation of unconventional reservoirs. The Spe Reservoir Simulation Symposium. The Woodlands, Texas, Usa. February 2013. IEEE.
Peng, Y., Zhao, J., Sepehrnoori, K., Li, Z., and Xu, F. (2019). Study of delayed creep fracture initiation and propagation based on semi-analytical fractional model. Appl. Math. Model. 72, 700–715. doi:10.1016/j.apm.2019.03.034
Peng, Y., Zhao, J., Sepehrnoori, K., Li, Y., and Li, Z. (2020a). The influences of stress level, temperature, and water content on the fitted fractional orders of geomaterials. Mech. Time. Depend. Mat. 24, 221–232. doi:10.1007/s11043-019-09417-0
Peng, Y., Zhao, J., Sepehrnoori, K., and Li, Z. (2020b). Fractional model for simulating the viscoelastic behavior of artificial fracture in shale gas. Eng. Fract. Mech. 228, 106892. doi:10.1016/j.engfracmech.2020.106892
Salimzadeh, S., Paluszny, A., and Zimmerman, R. W. (2017). Three-dimensional poroelastic effects during hydraulic fracturing in permeable rocks. Int. J. Solids Struct. 108, 153–163. doi:10.1016/j.ijsolstr.2016.12.008
Shen, W., Xu, Y., Gu, J., Li, X., and Huang, W. (2016). Numerical simulation of gas and water flow mechanism in hydraulically fractured shale gas reservoirs. J. Nat. Gas Sci. Eng. 35, 726–735. doi:10.1016/j.jngse.2016.08.078
Sun, R., Yu, W., Xu, F., Pu, H., and Miao, J. (2019). Compositional simulation of CO2 Huff-n-Puff process in Middle Bakken tight oil reservoirs with hydraulic fractures. Fuel 236, 1446–1457. doi:10.1016/j.fuel.2018.09.113
Wang, F., Pan, Z., and Zhang, S. (2017). Impact of chemical osmosis on water leakoff and flowback behavior from hydraulically fractured gas shale. J. Petroleum Sci. Eng. 151, 264–274. doi:10.1016/j.petrol.2017.01.018
Wang, F., Chen, Q., and Ruan, Y. (2020a). Hydrodynamic equilibrium simulation and shut-in time optimization for hydraulically fractured shale gas wells. Energies (Basel) 13 (4), 961. doi:10.3390/en13040961
Wang, Q., Hu, Y., Zhao, J., Chen, S., Fu, C., and Zhao, C. (2020b). Numerical simulation of fracture initiation, propagation and fracture complexity in the presence of multiple perforations. J. Nat. Gas Sci. Eng. 83, 103486. doi:10.1016/j.jngse.2020.103486
Wang, T., Yang, Y., Peng, Y., Zhao, J., Qi, T., Zeng, J., et al. (2021). Simulation and evaluation for acid fracturing of carbonate reservoirs based on embedded discrete fracture model. Nat. Gas. Ind. B 8 (6), 637–649. doi:10.1016/j.ngib.2021.08.011
Xu, Y., Cavalcante Filho, J. S., Yu, W., and Sepehrnoori, K. (2017). Discrete-fracture modeling of complex hydraulic-fracture geometries in reservoir simulators. SPE Reserv. Eval. Eng. 20 (02), 403–422. doi:10.2118/183647-pa
Xu, Y., Fernandes, B. R. B., Marcondes, F., and Sepehrnoori, K. (2019). Embedded discrete fracture modeling for compositional reservoir simulation using corner-point grids. J. Petroleum Sci. Eng. 177, 41–52. doi:10.1016/j.petrol.2019.02.024
Yu, W., Xu, Y., Liu, M., Wu, K., and Sepehrnoori, K. (2018). Simulation of shale gas transport and production with complex fractures using embedded discrete fracture model. AIChE J. 64 (6), 2251–2264. doi:10.1002/aic.16060
Yue, H., Chang, H., Fan, Y., Chen, F., and Chen, P. (2020). Construction and prospect of China's shale gas technical standard system. Nat. Gas. Ind. B 7 (6), 664–670. doi:10.1016/j.ngib.2020.04.007
Zhang, H., Li, T., Han, D., Wang, D., Sun, D., and Yu, B. (2020). Study on a dual embedded discrete fracture model forFluid flow in fractured porous media. Comput. Model. Eng. Sci. 124 (1), 5–21. doi:10.32604/cmes.2020.09290
Zhang, J., Shi, M., Wang, D., Tong, Z., Hou, X., Niu, J., et al. (2022a). Fields and directions for shale gas exploration in China. Nat. Gas. Ind. B 9 (1), 20–32. doi:10.1016/j.ngib.2021.08.014
Zhang, L., He, X., Li, X., Li, K., He, J., Zhang, Z., et al. (2022b). Shale gas exploration and development in the Sichuan Basin: Progress, challenge and countermeasures. Nat. Gas. Ind. B 9 (2), 176–186. doi:10.1016/j.ngib.2021.08.024
Zhao, J., Peng, Y., Li, Y., and Xiao, W. (2015). Analytical model for simulating and analyzing the influence of interfacial slip on fracture height propagation in shale gas layers. Environ. Earth Sci. 73 (10), 5867–5875. doi:10.1007/s12665-015-4360-4
Zhao, J., Wang, Q., Hu, Y., Ren, L., and Zhao, C. (2019). Numerical investigation of shut-in time on stress evolution and tight oil production. J. Petroleum Sci. Eng. 179, 716–733. doi:10.1016/j.petrol.2019.03.087
Zhao, J., Zhao, J., Hu, Y., Huang, T., Zhao, X., and Liu, X. (2020). Non-planar fracture propagation model for fluid-driven fracturing based on fluid-solid coupling. Eng. Fract. Mech. 235, 107159. doi:10.1016/j.engfracmech.2020.107159
Zhao, J., Ren, L., Jiang, T., Hu, D., Wu, L., Wu, J., et al. (2022). Ten years of gas shale fracturing in China: Review and prospect. Nat. Gas. Ind. B 9 (2), 158–175. doi:10.1016/j.ngib.2022.03.002
Zhou, S., Dong, D., Zhang, J., Zou, C., Tian, C., Rui, Y., et al. (2021). Optimization of key parameters for porosity measurement of shale gas reservoirs. Nat. Gas. Ind. B 8 (5), 455–463. doi:10.1016/j.ngib.2021.08.004
Keywords: shale gas, hydraulic fracturing, reservoir simulation, EDFM, integration process
Citation: Li Y, Luo A, Chen X, Cheng L, Chang C and Xie W (2022) A Novel model for simulating the integration process of hydraulic fracturing, shut-in period, and well production. Front. Energy Res. 10:979526. doi: 10.3389/fenrg.2022.979526
Received: 27 June 2022; Accepted: 24 August 2022;
Published: 19 September 2022.
Edited by:
Shuang Zheng, Aramco Services Company, United StatesReviewed by:
Hao Yan, China University of Mining and Technology, ChinaCopyright © 2022 Li, Luo, Chen, Cheng, Chang and Xie. This is an open-access article distributed under the terms of the Creative Commons Attribution License (CC BY). The use, distribution or reproduction in other forums is permitted, provided the original author(s) and the copyright owner(s) are credited and that the original publication in this journal is cited, in accordance with accepted academic practice. No use, distribution or reproduction is permitted which does not comply with these terms.
*Correspondence: Ang Luo, MTA1NDE1ODczNkBxcS5jb20=
Disclaimer: All claims expressed in this article are solely those of the authors and do not necessarily represent those of their affiliated organizations, or those of the publisher, the editors and the reviewers. Any product that may be evaluated in this article or claim that may be made by its manufacturer is not guaranteed or endorsed by the publisher.
Research integrity at Frontiers
Learn more about the work of our research integrity team to safeguard the quality of each article we publish.