
95% of researchers rate our articles as excellent or good
Learn more about the work of our research integrity team to safeguard the quality of each article we publish.
Find out more
BRIEF RESEARCH REPORT article
Front. Energy Res. , 12 August 2022
Sec. Advanced Clean Fuel Technologies
Volume 10 - 2022 | https://doi.org/10.3389/fenrg.2022.978134
This article is part of the Research Topic Advanced Methods of Mathematical Modeling and Experimental Study in Oil and Gas Reservoirs View all 15 articles
 Wang Huzhen1,2
 Liu Tiancheng1Sun Zhuangzhuang1Wang Chunyao1,3Liu Zhenyu1,2Zhou Zhijun1,2*Diao Changjun4Zhao Zhiming5
Aiming at the problems of formation pressure distribution and productivity prediction after Horizontal Well Volume Fracturing in stress sensitive reservoirs, the methods of dynamic permeability and dynamic threshold pressure gradient are used to deal with the influence of stress sensitivity, a numerical simulation method of oil-water two-phase flow based on finite element method is established. History matching is performed on the basis of the prediction of formation pressure distribution after horizontal well volume fracturing of, which ensures high matching accuracy. Taking the ultra-low permeability sandy glutenite reservoir of Baikouquan Formation in M18 area of Aihu Oilfield as research object, the influence law of formation pressure level on productivity and stress sensitivity on formation pressure distribution is studied. Analysis of the calculation results shows that: the influence of formation pressure level on well productivity is mainly in the first year of production, and the effect of energy increasing by volume fracturing is clarified. Stress sensitivity mainly affects the middle and later stage of production. With the increase of sensitivity, the permeability loss of the formation tends to be concentrated in the low-pressure area near the artificial fracture, forming an isolation zone with high flow resistance, which make the development effect of far well zone worse.
Generally speaking, the lower the reservoir permeability, the weaker the stress sensitivity (Li, 2005, Li, 2009; Gao et al., 2014; Dou et al., 2016; Luo et al., 2019). However, due to its special geological characteristics, abnormally high pressure and low permeability reservoirs often have higher effective stress during development, and generally show stronger stress sensitivity. With the increase of effective stress, the loss rate of reservoir permeability gradually increases, showing greater seepage resistance, which affects the productivity of oil wells. Clarifying the influence of stress sensitivity on formation pressure distribution and productivity is of great significance for reservoir protection and design reasonable production system.
The research methods of stress sensitivity on productivity mainly include analytical method, semi analytical method, and numerical method. Analytical methods are used to establish productivity models for vertical wells (Liu et al., 2014; Shan et al., 2017; Chai et al., 2018; Zhu et al., 2018) and horizontal wells (Yang et al., 2017; Jiang et al., 2012; Ning et al., 2020; Guo and Wu 2007), most of which have to be studied for non-fractured wells. Fang et al. (2015) based on the perturbation theory and combined with the source function, established a semi-analytical method for calculating the production of fracturing horizontal wells in Laplace space, and analyzed the pressure and production dynamic curves of multi-angle and multi-stage fracturing horizontal wells in stress sensitive oil reservoirs. Numerical methods mainly use finite difference, finite volume method and finite element method. Song (2012) established the oil-water relative permeability curve under the combined effect of stress sensitivity and starting pressure on the basis of the stress sensitivity experimental results. Wang et al. (2013) established the dynamic model of threshold pressure gradient and dynamic permeability on the basis of laboratory experiments, and used the finite difference method to solve numerically. Liu et al. (2017) established a three-phase seepage mathematical model for shale oil considering the threshold pressure gradient and stress sensitivity, used the finite volume method to obtain the numerical solution, and compiled a numerical simulator. The finite element method has flexible grid division and is easy to deal with complex boundaries. It has unique advantages in the study of seepage problems in artificially fractured wells (Zhang et al., 2017; Feng et al., 2019; Su et al., 2019), and is very suitable for the development of numerical calculation programs.
The finite element-based numerical method is used to study the seepage problem of fractured wells in stress sensitive reservoirs. Innovatively establish the equivalent characterization method of stress sensitivity effect using dynamic permeability and dynamic starting pressure gradient based on the experimental data of core stress sensitivity, and improve the accuracy of history fitting of fractured horizontal wells based on the prediction of formation pressure distribution before production. In order to improve the programming efficiency, the calculation program is developed based on the Finite Element Automatic Generation System (FEPG) (Liang, 2011) of the Chinese Academy of Sciences, which can save a lot of programming work (Zhang et al., 2010; Zhang 2013; Shi et al., 2016).
Basic assumptions: There is an oil-water two-phase fluid in a homogeneous reservoir, and both fluid and rock are weakly compressible. The influence of starting pressure gradient and capillary force is considered, and the influence of gravity is ignored. The motion equation is brought into the continuity equation, the fluid densities ρo, ρw are treated as constants, and the rock state equation is considered to process the right-hand term of the equation, and the oil phase pressure equation is obtained:
Where
Define the total seepage velocity as u, then
Get:
In order to improve the calculation stability of saturation equation, the relative mobility of water phase in the first term at the right end of the above formula λw is implicitly treated as a function of Sw. In the second term, the capillary pressure is also implicitly treated. Expand pc into Taylor series near Swn−1, and then take its first-order expansion and ignore the second-order small quantity, can get
The water phase saturation equation can be obtained:
The traditional fracture characterization method regards the fracture as a high-permeability zone, which has certain limitations in simulating complex fractures. The mixed element finite element method is used to simulate cracks with line elements. In order to facilitate mesh division, the implicit fracture line element is adopted, that is, the division of matrix mesh element and the fracture line element are carried out at the same time, and the fracture line element is hidden in the matrix element. This fracture treatment method needs to superimpose the stiffness of the fracture line element into the overall stiffness of the matrix, so as to improve the stiffness of the matrix element and improve the overall permeability of the matrix.
In the two-dimensional mathematical model of oil-water two-phase, artificial fractures are treated with line elements. The basic differential equations of artificial fractures have the same form as the matrix, and the dimension is one dimension lower than matrix. Due to the high fracture permeability, the threshold pressure gradient is not considered.
Oil phase pressure equation of artificial fracture:
Water phase saturation equation of artificial fracture:
Write the oil phase pressure Eq. 1 in integral form:
Integral by parts of the left-hand side of Eq. 9, can get:
When the oil-water well is at a constant pressure boundary, by selecting δp appropriately, make δp = 0 on the boundary and ignore the integral along the boundary
When the oil-water well is producing at a constant production rate q, and the bottom hole is the constant flow boundary, the integral term along the bottom hole boundary can be changed to
Similarly, the weak solution integral expression of the water phase saturation equation can be obtained:
The u in the first term of the formula is treated explicitly, so this term does not need to be integral by parts. In the same way, the integral form of the weak solution of the fracture system can be obtained.
The oil phase pressure equation and the water phase saturation equation were solved by implicit pressure and explicit water saturation. The time was discretized by the Crank-Nicolson scheme. The linear equations were solved by the direct method of LDLT decomposition. Both the water cut and the pressure gradient were solved using the least squares method.
Baikouquan formation in well block M18 of Aihu oil field is a low porosity, ultra-low permeability and abnormally high-pressure sandy conglomerate reservoir with a pressure coefficient of 1.63. The reservoir rocks of the Baikouquan Formation are mainly glutenite, gravel-bearing coarse sandstone and sandstone, and the pore types are mainly residual intergranular pores, intragranular dissolved pores, matrix shrinkage pores and crushed fractures. The reservoir porosity is mainly distributed between 8 and 14%, with an average of 11.9%, and the permeability is distributed between 0.01 × 10⁻³ μm2 and 46 × 10−3 μm2, with an average of 0.5 × 10⁻³ μm2. Crude oil has low viscosity and good fluidity. Medium water sensitivity, velocity sensitivity and strong stress sensitivity. Stress Sensitivity index b = 0.385 (
The stress sensitive data adopts the results of laboratory experiments. When the net confining pressure is 44 MPa, the formation permeability is reduced to 20% of the initial value. In the numerical calculation, according to the net formation confining pressure value of each node, interpolate the data in stress sensitive data to obtain the formation permeability loss, and then update the formation permeability and threshold pressure gradient data of the node.
Well M1 fracturing 12 stages and 22 clusters, of which the 6th and 11th stages fracturing one cluster, and the half-length of the fractures is 55–164 m. In the M18 well block, natural fractures are not developed in the reservoir, and the rock is partially plastic and has a low brittleness value. The large stress difference between the two horizontal directions makes it difficult to achieve volume fracturing with complex artificial fracture network patterns in this area. The artificial fractures are mainly plane fractures. Building a 2D Model of Well M1.
Well M1 adopts slick water + guar gum fracturing fluid, with a total fluid volume of 13,500 m3. In order to improve the accuracy of history matching, simulate the fracturing fluid injection process during fracturing construction, predict the formation pressure distribution before production under the influence of fracturing fluid energization, and use the total injected fluid volume and bottom-hole flow pressure during production to constrain Numerical calculation results.
The current production time of well M1 is 2.4 years, and the history matching is shown in Figure 1. The initial production of the well increased rapidly, and then decreased rapidly after reaching the peak. The history matching is carried out on the basis of the prediction of formation pressure distribution, which makes the matching effect in the initial stage better. When fracturing energization is not considered, the initial peak oil rate is only 60 t/d, and when fracturing energization is considered, it is 100 t/d, this is a very big difference. Therefore, if the influence of fracturing energization on the formation pressure distribution before production is not considered, history matching is difficult.
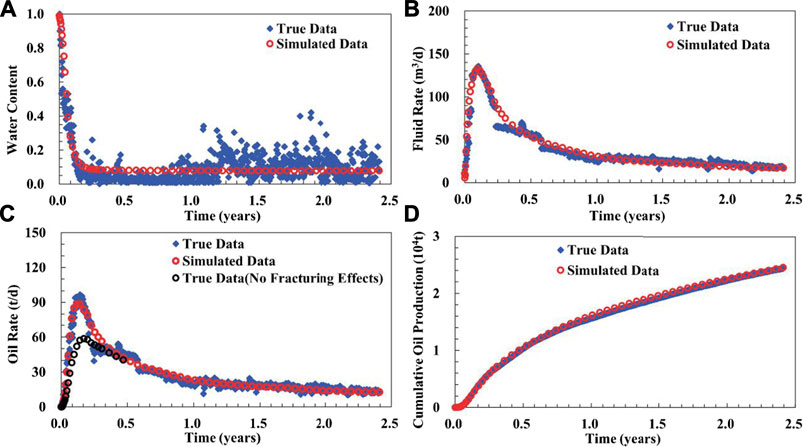
FIGURE 1. Historical matching curve of single well.(A) Water Content; (B) Fluid Rate; (C) Oil Rate; (D) Cumulative Production.
The two replacements of the nozzles caused large fluctuations in well production, and the matching effect was relatively poor in about half a year. This well lacks bottom-hole flow pressure data, which makes it difficult to accurately match production fluctuations, and can only match production trends. The cumulative oil production of well M1 in 2.4 years is 24,455 t, the cumulative oil production calculated by simulation is 24,564 t, and the fitting error is 0.45%.
The formation pressure and pressure gradient distribution of Well M1 are shown in Figure 2. At 2.4 years, the formation pressure in the simulation area of Well M1 was 35–61.23 MPa, and the permeability loss rate caused by stress sensitivity was 17.70%–2.22%.
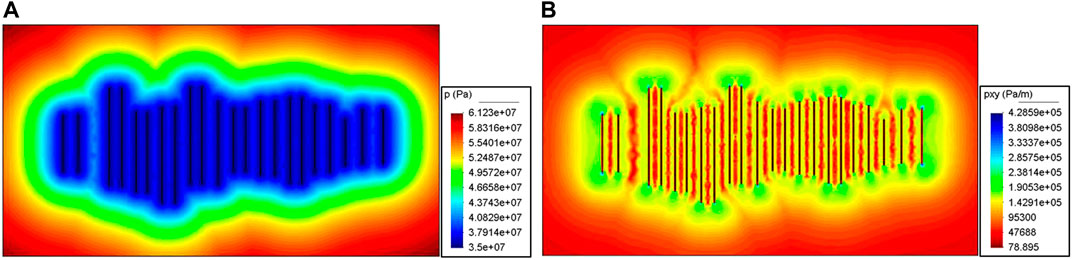
FIGURE 2. Distribution of formation pressure and pressure gradient. (A). Distribution of formation pressure, (B). Distribution of formation pressure gradient.
On the basis of single well history matching, predicted cumulative oil production in 8 years is 43,187 t, and the recovery degree is 12.77%.
An ideal model of a single well was established, the length of the horizontal section was 1,000 m, 24 clusters in 12 fracturing stages, and the half-length of the fractures were all 120 m, and other calculation parameters were the same as those of Well M1. Four pre-production formation pressure level schemes were established, and the average formation pressures
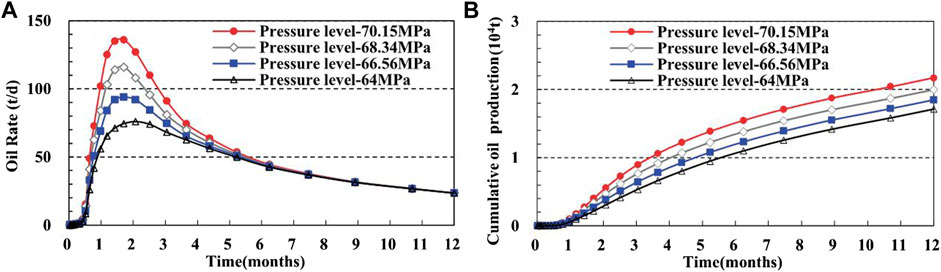
FIGURE 3. Influence of formation pressure level on initial productivity.
The bottom hole flow pressure drop is 20 MPa when the horizontal well has been in production for 8 years. Four schemes are selected for the permeability loss caused by stress sensitivity. The maximum permeability loss rates (Ks) near the bottom hole are 20%, 40%, 60%, and 80%, of which 80% scheme is close to the actual situation of well block M18. The numerical calculation model and other parameters are the same as those in the previous section, and the influence of fracturing on formation pressure is not considered. The formation pressure is taken as the original formation pressure.
Comparing the formation pressure distribution of the four stress sensitivity schemes in 8 years (Figure 4), it can be seen that the formation pressure consumed increases with the increase of stress sensitivity. The average formation pressure of the four schemes in 8 years is 35.17, 30.30, 27.40, and 25.37 MPa.
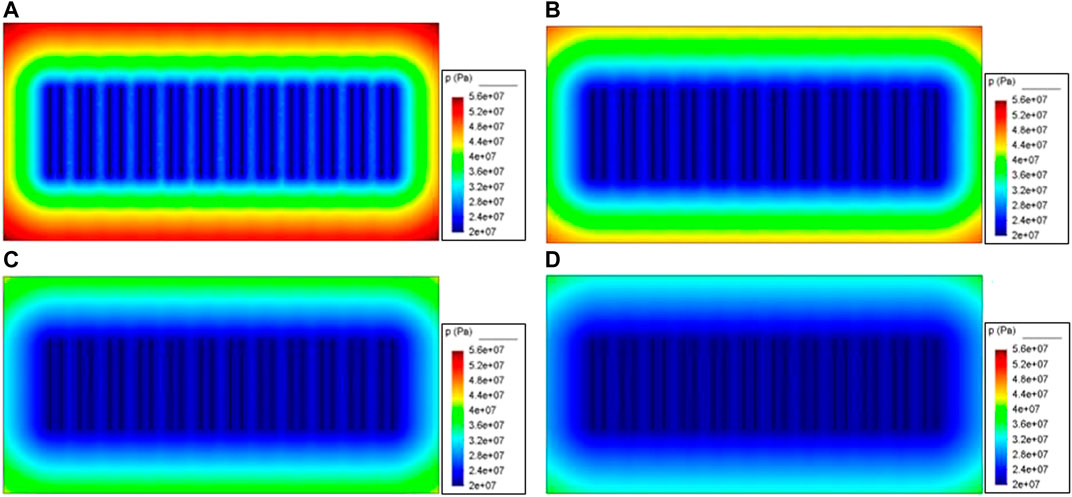
FIGURE 4. Effect of stress sensitivity on formation pressure distribution. (A) Max Ks = 20%; (B) Max Ks = 40%; (C) Max Ks = 60%; (D) Max Ks = 80%.
The loss of formation permeability is calculated according to the distribution of formation pressure. As the stress sensitivity increases, the difference between the maximum and minimum loss rates of the four schemes becomes larger and larger. The lowest loss rate of scheme 4 is only 26.41%, which is lower than that of scheme 2 and 3. On the one hand, the existence of stress sensitivity reduces the pore volume and reduces the reservoir permeability, which is not conducive to oil recovery. On the other hand, it is beneficial to maintain pore pressure and oil production, so stress sensitivity within a certain range may be beneficial to increase productivity (Wang et al., 2003; Li and Tu 2008). However, when the stress sensitivity is very strong, an isolation zone with lower permeability and higher fracturing gradient with high flow resistance tends to be formed near the fracture, which makes the oil production in the far-well area worse and reduces the productivity of the oil well. This situation can also be explained from the formation energy consumption, that is, the average formation pressure of scheme 4 is higher and the total pressure difference is lower. In the middle and late stages of production in the M18 well area, it is necessary to formulate a reasonable oil recovery rate and supplement formation energy to reduce the impact of stress sensitive oil wells.
Based on the basic principle of finite element method, a numerical method for predicting formation pressure distribution and oil well productivity of ultra-low permeability sandy conglomerate reservoir considering stress sensitivity is established. An innovative method to characterize the fracturing reformed area with permeability and threshold pressure gradient that vary with spatial location. The single well history matching is carried out on the basis of the formation pressure distribution prediction considering the influence of fracturing energy increase. In the peak yield stage, which is difficult to fit, the historical matching coincidence rate is high, and the overall historical fitting effect is good.
The fracturing energization effect in the M18 well area has a good oil-increasing effect. In view of the low fracturing fluid flowback rate, it is recommended to combine the imbibition theory to study the feasibility of oil displacement fracturing to further improve the oil recovery.
In the middle and late stages of oil well production, stress sensitivity strengthens the threshold pressure gradient and seepage resistance in the low-pressure zone near artificial fractures, so that the pressure is mainly consumed near the artificial fractures, and the production effect becomes poor. Optimizing the oil well production system, supplementing the formation energy, and reducing the influence of stress sensitivity are the key issues that need to be paid attention to in the M18 well area.
The original contributions presented in the study are included in the article/supplementary material, further inquiries can be directed to the corresponding author.
WH, LZ, and ZZhij contributed to conception and design of the study. DC organized the database. WH, LT, SZ, and ZZhim performed the numeral calculations and statistical analysis. WH, LT, WC, and SZ wrote sections of the manuscript. All authors contributed to manuscript revision, read, and approved the submitted version.
This work is financially supported by the Daqing guiding science and technology plan project (No. zd-2021-51).
Author WC was employed by NO. 1 Oil Production Plant PetroChina Daqing Oilfield Company. Author DC was employed by Xinjiang Oilfield Company, PetroChina.
The remaining authors declare that the research was conducted in the absence of any commercial or financial relationships that could be construed as a potential conflict of interest.
All claims expressed in this article are solely those of the authors and do not necessarily represent those of their affiliated organizations, or those of the publisher, the editors and the reviewers. Any product that may be evaluated in this article, or claim that may be made by its manufacturer, is not guaranteed or endorsed by the publisher.
Chai, R. K., Liu, Y. T., Wang, J. Q., and Xin, J. (2018). Study on productivity model of oil well in low-permeability reservoirs based on two-phase threshold pressure gradient and stress sensitivity (in Chinese). J. Xi'an Shiyou Univ. Nat. Sci. Ed. 33 (3), 44–50. doi:10.3969/j.issn.1673—064X.2018.03.007
Dou, H., Zhang, H., Yao, S., Zhu, D., Sun, T., Ma, S., et al. (2016). Measurement and evaluation of the stress sensitivity in tight reservoirs. Petroleum Explor. Dev. 43 (6), 1116–1123. doi:10.1016/s1876-3804(16)30130-6
Fang, S. D., Cheng, L. S., Li, C. Y., Cao, R. Y., Yang, J., and He, C. G. (2015). The productivity model of multi-angled fractured horizontal well in stress-sensitive reservoir (in Chinese). J. Northeast Petroleum Univ. 39 (1), 87–94. doi:10.3969/j.issn.2095-4107.2015.01.011
Feng, F. P., Lei, Y., Chen, D. F., Hu, C. Y., Wang, H. Z., and Huang, R. (2019). Parameter analysis of SRV fracturing effect of tight reservoirs based on finite element numerical simulation (in Chinese). Reserv. Eval. Dev. 9 (1), 29–33. doi:10.13809/j.cnki.cn32-1825/te.2019.01.006
Gao, T., Guo, X., Liu, J. N., Li, H. T., Xie, C., and Liu, H. (2014). Stress sensitivity experiment for ultra-low permeability core (in Chinese). Petroleum Geol. Oilfield Dev. Daqing 33 (4), 87–90. doi:10.3969/j.issn.1000-3754.2014.04.018
Guo, X., and Wu, Y. (2007). Influence of start-up pressure gradient and stress sensitivity on productivity of low-permeability gas reservoirs(in Chinese). Oil Gas Geol. 28 (4), 539–543. doi:10.11743/ogg20070417
Jiang, R., Wang, Y. Q., Zhang, Q., Huang, P., and Xu, Z. P. (2012). A capacity formula for horizontal well in stress-sensitive reservoir considering threshold pressure gradient and quadratic pressure gradient (in Chinese). Tuha Oil Gas 17 (1), 68–72.
Li, C. L., and Tu, X. W. (2008). Two types of stress sensitivity mechanisms for reservoir rocks: being favorable for oil recovery(in Chinese). Lithol. Reserv. 20 (1), 111–113. doi:10.3969/j.issn.1673-8926.2008.01.019
Li, C. L. (2005). Low permeability rocks are less sensitive to stress(in Chinese). Oil Drill. Prod. Technol. 27 (4), 62–63. doi:10.3969/j.issn.1000-7393.2005.04.019
Li, C. L. (2009). Stress sensitivity influence on oil well productivity(in Chinese). J. Southwest Petroleum Univ. Sci. Technol. Ed. 31 (1), 170–172. doi:10.3863/j.issn.1674-5086.2009.01.041
Liang, G. P. (2011). Finite element analysis software platform FEPG(in Chinese). Comput. Aided Eng. 20 (3), 92–96.
Liu, F., Wang, Y. L., Chen, X. F., Yunhe, S., and Yue, W. (2014). Analysis on oil well productivity of low-permeability reservoirs with stress-sensitivity being taken into considerations(in Chinese). Oil Gas. Geol. 34 (1), 124–128. doi:10.11743/ogg20130117
Liu, L. J., Yao, J., Sun, H., Bai, Y. H., Xu, B. Y., and Chen, L. (2017). The effect of threshold pressure gradient and stress sensitivity on shale oil reservoir productivity (in Chinese). Pet. Drill. Tech. 45 (5), 84–91. doi:10.11911/syztjs.201705015
Luo, C., Zhou, P. G., Yang, H., and Shi, J. G. (2019). Stress sensitivity characteristics of low permeability reservoirs (in Chinese). J. Southwest Petroleum Univ. Sci. Technol. Ed. 41 (6), 1–7. doi:10.11885/j.issn.16745086.2019.01.21.03
Ning, B., Xiang, Z. P., Liu, X. S., Zhijun, L., Zhonghua, C., Bocai, J., et al. (2020). Production prediction method of horizontal wells in tight gas reservoirs considering threshold pressure gradient and stress sensitivity. J. Pet. Sci. Eng. 187, 106750. doi:10.1016/j.petrol.2019.106750
Shan, A. P., Shi, L. H., Kang, K., and Lu, C. (2017). A new production model of ultra-low permeability reservoirs under con sideration of start-up pressure gradient and stress sensitivity effect (in Chinese). Xinjiang Oil Gas 13 (4), 41–46.
Shi, W. H., Yang, T. H., Liu, H. L., and Yang, B. (2016). Non-Darcy flow model and numerical simulation for water-inrush in fractured rock mass. Chin. J. Rock Mech. Eng. 35 (3), 446–455. doi:10.13722/j.cnki.jrme.2015.0389
Song, C. T. (2012). Numerical reservoir simulation considering threshold pressure gradient and stress sensitive phenomenon(in Chinese). Sci. Technol. Eng. 12 (25), 6319–6326.
Su, Y. L., Lu, M. J., Li, M., Zhang, Q., Wang, W. D., and Dong, M. Z. (2019). Numerical simulation of shale oil coupled flow in multi-pore media (in Chinese). Oil Gas. Geol. 40 (3), 645–652+660. doi:10.11743/ogg20190319
Wang, X. J., Zhao, Y. S., Wen, W., Chi, B., and Sun, Y. (2003). Stress sensitivity and poroperm lower limit of deliverability in the low-permeability reservoir (in Chinese). Oil & Gas. Geol. 24 (2), 162–165. doi:10.11743/ogg20030212
Wang, J., Liu, H. Q., Liu, R. J., and Xu, J. (2013). Numerical simulation for low-permeability and extra-low permeability reservoirs with considering starting pressure and stress sensitivity effects (in Chinese). J. Rock Mech. Eng. 32, 3317–3327.
Yang, Z. P., Yang, H., Chen, H. P., and Zhang, H. (2017). New method for evaluating rock stress sensitivity for low- permeability tight gas reservoirs. Chem. Technol. Fuels Oils 53 (1), 68–76. doi:10.1007/s10553-017-0782-x
Zhang, C. L., Wang, J. Y., and Fang, G. Y. (2010). Numerical simulation of fluid flow through shale coupled with multi-field based on FEPG (in Chinese). Drill. Fluid & Complet. Fluid 27 (3), 69–71.
Zhang, Q. F., Huang, Z. Q., Yao, J., Wang, Y., and Li, Y. (2017). Two-phase numerical simulation of discrete fracture model based on multiscale mixed finite element method. Chin. Sci. Bull. 62 (13), 1392–1401. doi:10.1360/n972016-00584
Zhang, S. L. (2013). Numerical simulation and analysis of structural fractures based on FEPG(in Chinese). J. Xi’an Univ. Sci. Technol. 33 (4), 86–91+100.
Zhu, M. Q., Wang, N. T., and Zhang, H. (2018). Influences of the start-up pressure gradient and stress sensitive effect on the productivity of the oil reservoir(in Chinese). Petroleum Geol. Oilfield Dev. Daqing 37 (3), 59–63. doi:10.19597/j.issn.1000-3754.201709044
ϕ porosity, fraction
ϕ0 initial porosity, fraction
So oil saturation, fraction
Sw water saturation, fraction
t time, s
K permeability, m2
K0 initial permeability, m2
Kro oil-phase relative permeability
Krw water-phase relative permeability
μo oil-phase viscosity, Pa s
μw
water-phase viscosity, Pa s
po oil-phase pressure, Pa
p0 original formation pressure, Pa
pw water-phase pressure, Pa
pc capillary pressure, Pa
G threshold pressure gradient, Pa/m
Cf rock compressibility, Pa−1
Ct comprehensive compressibility, Pa−1
Co oil-phase compressibility, Pa−1
Cw water-phase compressibility, Pa−1
λ oil-water two-phase fluidity
λo oil-phase relative fluidity
λw water-phase relative fluidity
u total seepage velocity, m/s
vo oil-phase seepage velocity, m/s
vw water-phase seepage velocity, m/s
A seepage area, m2
fo oil-phase of fracture system
fw water-phase of fracture system
fc fracture capillary pressure
‘ derivative
n-1 previous time step
Keywords: abnormal high pressure, stress-sensitive, horizontal well, volume fracturing, pressure distribution prediction
Citation: Huzhen W, Tiancheng L, Zhuangzhuang S, Chunyao W, Zhenyu L, Zhijun Z, Changjun D and Zhiming Z (2022) Formation pressure distribution and productivity prediction of fractured horizontal wells in stress sensitive reservoirs. Front. Energy Res. 10:978134. doi: 10.3389/fenrg.2022.978134
Received: 25 June 2022; Accepted: 14 July 2022;
Published: 12 August 2022.
Edited by:
Xiukun Wang, China University of Petroleum, Beijing, ChinaReviewed by:
Lei Li, China University of Petroleum (East China), ChinaCopyright © 2022 Huzhen, Tiancheng, Zhuangzhuang, Chunyao, Zhenyu, Zhijun, Changjun and Zhiming. This is an open-access article distributed under the terms of the Creative Commons Attribution License (CC BY). The use, distribution or reproduction in other forums is permitted, provided the original author(s) and the copyright owner(s) are credited and that the original publication in this journal is cited, in accordance with accepted academic practice. No use, distribution or reproduction is permitted which does not comply with these terms.
*Correspondence: Zhou Zhijun, c3lnYzQyM0AxNjMuY29t
Disclaimer: All claims expressed in this article are solely those of the authors and do not necessarily represent those of their affiliated organizations, or those of the publisher, the editors and the reviewers. Any product that may be evaluated in this article or claim that may be made by its manufacturer is not guaranteed or endorsed by the publisher.
Research integrity at Frontiers
Learn more about the work of our research integrity team to safeguard the quality of each article we publish.