 Yuyan Yang1
 Jichun Liu
 Yulin Xue
- 1College of Electrical Engineering, Sichuan University, Chengdu, China
- 2Powerchina Hydropower Development Group Co., Ltd, Chengdu, China
Energy-saving and emission reduction will become the focus of the energy industry in the future. The coordination of the carbon and electricity markets can help achieve the goals of carbon reduction. With the establishment of the carbon market, carbon emitting power generation units (CEPGU) need to consider the trading strategy and comprehensive benefits in the electricity and carbon markets. To further explore the mechanism and interaction process of electricity price and carbon price, the day-ahead electricity market model and carbon market trading model are developed in this study. Based on the deviation between the bid-winning power output in the electricity market and the quota plan in the carbon market, the generation cost model and the carbon quota trading decision model of the units are constructed. Finally, a case study is provided to simulate the coordinated trading process of the carbon and electricity markets. The transaction time scales of the two markets are matched. The results prove that the generation plan of the units can coordinate with the carbon quota level and provide a trading strategy for the power generation enterprises.
Introduction
With the development of the industrial economy, the problem of high energy consumption and carbon emissions from industries have become increasingly prominent. Although the emission reduction potential of the whole society is vast, the pressure of emission reduction in various industries has been increasing sharply. The goal of “Carbon Peak and Carbon Neutral” sheds new light on optimizing dispatching and trading mechanisms to save energy and reduce carbon emissions. The national carbon emission rights trading management method of China came into effect on 1 February 2021, and officially went online on July 16, which uses a market mechanism to control carbon emissions (Jin et al., 2020) and improve carbon emission efficiency (Chen et al., 2021). The electricity markets play a vital role in allocating electricity production factors and resources. The cooperation of carbon and electricity markets will promote the realization of “Carbon Peak and Carbon Neutral” goal.
Some researches study the impact of relevant energy policies on carbon emission trading. A multi-region multimarket equilibrium model considering Renewable Electricity Certificates market and carbon market is developed in (Wang et al., 2021). Feng et al. (2021) simulate the combined effects of tradable green certificates and carbon market on the electricity market. Ying and Xin-gang (2021) use the system dynamics method to evaluate the impact. Carbon quota allocation and management (Zhu et al., 2022), sector selection, supervision, punishment, and an appropriate carbon price (Feng et al., 2020) are key factors in the implementation of carbon emissions trading scheme (Chen et al., 2020). The factors in the carbon and electricity markets are interrelated and affect each other. Liu and Jin (2020) study the interactions between electricity, fossil fuel and carbon price. Lin et al. (2019) assess the impact of power market transition on the economy and carbon emissions in Guangdong, China. Although the interaction of these factors has been studied, the carbon and electricity markets of China operate independently. The goals, price trends, market members and implementation paths of the two markets have not yet been synchronized well. The lack of effective coordination in operation mechanism leads to unclear prospects for the joint members of the two markets and increase the uncertainty of market factors.
There have been investigations into the carbon and electricity markets in Europe (Višković et al., 2017) and Australia (Nazifi et al., 2021), which provide a reference to design the collaborative mechanism of the carbon and electricity markets in China. The carbon market mechanism can reduce carbon emissions, increase the environmental benefits (Wang X. et al., 2022) and promote renewable energy development (Sun et al., 2022). Many scholars have carried out much research on the two markets model. Deane et al. (2015) build a comprehensive electricity market to study the relationship of electricity prices, cross border flows, emissions and associated total system costs. Zhang et al. (2021) use a computable general equilibrium model to explore the deregulation of electricity prices in the context of carbon pricing in China. Duan et al. (2021) study the bidding and trading process of the two markets in the equilibrium model. Most existing studies only regard the carbon market factors as the cost items of the objective function or constraints and do not explore the formation mechanism of the actual carbon price.
Under the cooperation of carbon and electricity markets in China, power generation enterprises need to optimize their business and fulfill social responsibility in the two markets. Carbon trading mechanism can affect the bidding output and strategy of high-carbon generating units (Liu, 2022). An optimal electricity allocation model that considers the bidding game of generation companies is proposed for power system reform (Cui et al., 2021). An evaluation method is proposed to internalize the emission cost of power plants in the day-ahead market offering (Andrianesis et al., 2021). Power generation enterprises with CEPGU should not only consider energy saving and carbon reduction. They should also pay attention to the coordination of the bidding strategy in electricity and carbon markets (Wang P. et al., 2022) to manage risk and obtain the suitable generation incomes (Wattoo et al., 2020).
The production and profit of firms are related to quota allocation and carbon cost (Wang et al., 2018). Carbon price prediction plays a vital role in power generation scheduling (Kockar et al., 2009) and power grid investment planning (Yu et al., 2022). It is also an essential factor affecting the coordinated trading strategy of the carbon and electricity markets. With the increasing perfection of the carbon market mechanism, more industries and market members are covered, which lead to the significant increase of the carbon price volatility and uncertainty. Numerical models are often used to study the uncertainties of future carbon prices and emissions (Ruhnau et al., 2022). Carbon price fluctuation can affect the carbon emission reduction investment of coal-fired power plants (Zhang et al., 2020). Time series model is suitable for predicting short-term price volatility (Eugenia Sanin et al., 2015). There is little research applying the time series model in the carbon price prediction to the coordinated trading strategy of the carbon and electricity markets.
The contributions of this study can be summarized as follows:
a) The exponential generalized autoregressive conditional heteroscedasticity (EGARCH) carbon price prediction model is used to dynamically update the carbon price in China’s carbon market, which is helpful for CEPGU to formulate a coordinated carbon and electricity trading strategy in a short time. The EGARCH model can describe the asymmetry of the variance effect and reflect the leverage that sudden events have on the fluctuations of the carbon price.
b) Considering the time-scale matching of the trading in carbon and electricity markets, this paper explores the formation mechanism and interaction process of electricity price and carbon price.
c) The coordinated trading strategy for the carbon and electricity markets provides a reference for the joint members of the two markets and helps them pay lower carbon cost to fulfill the responsibility of carbon emission reduction.
The remainder of this paper is organized as follows. In section II, the coordinated trading process of the carbon and electricity markets is proposed. In section III, the total quota and allocation model and carbon price prediction model are constructed based on historical data. In section IV, the day-ahead electricity market with the carbon cost model is formulated. The carbon market model and carbon quota trading strategy are discussed in section V. In section VI, the formation mechanism and interaction process of electricity price and carbon price are presented in case studies. Section VII concludes the paper.
Coordinated trading process of the carbon market and electricity markets
With the improvement of the electricity market and carbon markets, power generation enterprises with CEPGU as their primary business will inevitably face a more complicated economic impact in the two markets. The units in power generation enterprises need to develop coordinated trading strategies for the carbon and electricity market. It is necessary to find a suitable strategy to balance power generation profits and carbon emission responsibilities and build a sustainable operation mode. The coordinated trading process of the carbon and electricity markets designed in this paper is as follows and shown in Figure 1.
a) Total quota and allocation
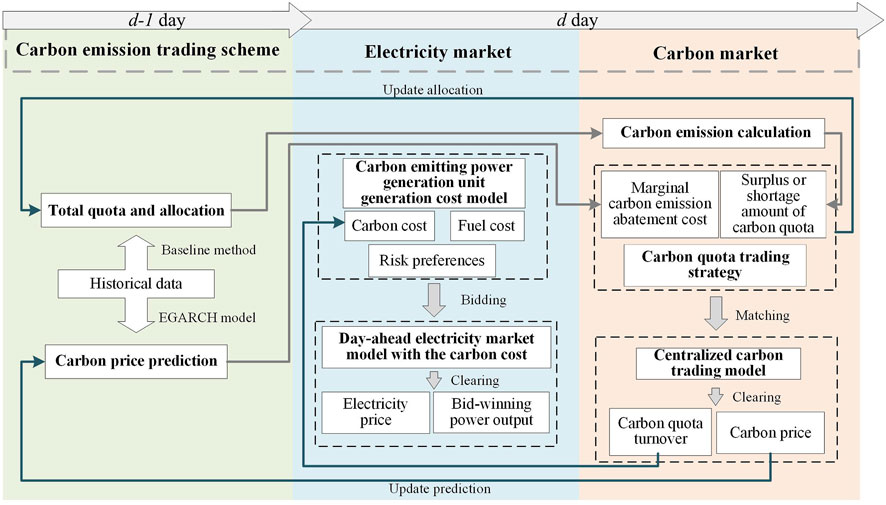
FIGURE 1. Coordinated trading process in the carbon and electricity markets.
The total pre-allocated quota of the CEPGU is calculated in the current year based on historical emission data and the baseline method. The carbon quota allocation of the current day is revised and updated by the predicted power generation ratio and the quota surplus of the previous day. The d day is taken as the trading day of the carbon and electricity markets.
b) Day-ahead electricity market trading phase
The d day electricity market optimization is carried out on d-1 day. The generation cost model of the CEPGU consists of coal consumption cost and carbon cost. The carbon cost results from the carbon market trading on the d-1 day, which is the product of carbon price and trading quota on the d-1 day. Based on generation cost and risk preference, the units declare the bidding information of the d day in the day-ahead electricity market. Under the constraints of load balance, network transmission and unit operation, the clearing and checking of the electricity market are carried out. The market institution announces the clearing price of the d day and the bid-winning output of each unit.
c) Carbon market trading phase
On the d day, after the electricity market, the surplus and shortage amount of carbon quota can be obtained by subtracting the carbon emission and quota allocation value on the d day, which is regarded as the carbon market quotation of units. By comparing the predicted carbon price on the d day with their own marginal carbon emission abatement cost, the market members make the purchase and sale decision of carbon quota on the d day. Under the constraints of trading volume, market quotation and balance, the carbon market trading center matches the demanders and suppliers of carbon quotas, which clears the d day carbon price and quota trading volume. The remaining quota that has not participated in carbon trading or has not been transacted after participating in carbon trading is accounted for in the quota allocation value on the d+1 day.
d) The dual optimization process of the electricity and carbon markets on d+1 day is the same as above.
Carbon quota decomposition and carbon price prediction model based on historical data
Carbon emission trading scheme
The carbon market in China adopts the principle of Cap-and-Trade. Under this mechanism, authorities first set the total amount of Chinese Emission Allowance (CEA) based on the overall Emission reduction target. The Cap-and-Trade principle consists of three parts: CEA allocation, CEA trading, and offset. At present, the carbon market in China adopts the free allocation of all quotas. As the market mechanism becomes increasingly mature, it gradually transitions to auction. The allocated CEA can be used for market transactions or offset against actual emissions. Any shortage of CEA can be made up through market purchases, while the surplus of CEA can be sold. At the end of the performance period, the enterprise will be fined for failing to complete the carbon offset.
The electric power industry is one of the earliest industries to be included in carbon trading due to its relatively complete carbon emission data statistics. Currently, the coal-fired and gas-fired units are mainly included in the scope of carbon trading in the power generation industry. In this paper, only coal-fired units are considered as CEPGU. As the national carbon market in China matures, more and more industries will be included in the carbon trading scope.
Total quota and allocation model
The principle of total quota and allocation is the basis of carbon reduction targets. Based on the baseline method, the enterprise carbon quota is equal to the industry benchmark multiplied by the actual power output of the enterprise in the current year.
The annual pre-allocation carbon quota
where
Carbon price prediction model
The future carbon price trend judgment influences the trading decision of market members in the electricity and carbon market. The EGARCH model can be applied to predict the carbon price based on the historical data (Benz and Trück, 2009). It can describe the asymmetry of variance, reflect the leverage effect of emergencies on carbon price fluctuations, and better predict the trend of carbon price fluctuations. This paper uses the carbon price data of the China’s national carbon market.
The carbon price prediction steps are as follows:
a) The logreturns of the carbon price of the national carbon market in China are constructed by historical data, the first-order difference of the natural logarithm of the carbon market closing price on the d day.
where
b) Unit root test (ADF test) is used to verify the stationarity of the logreturns of the carbon price. When the t-statistic value is less than the critical value at the test level of 1, 5, and 10% (the p-value is less than the significance level), the logreturns of the carbon price have stability.
c) Autocorrelation and partial autocorrelation tests are performed on the logreturns of the carbon price. When the autocorrelation and partial autocorrelation coefficients of the series fall within the double standard deviations and the probability corresponding to the Q-statistic is greater than the confidence level of 0.05, it is proved that there is no significant correlation between the series at the significance level of 5%.
d) The Heteroscedasticity test is performed on the logreturns by the residual square correlation graph. When the autocorrelation and partial autocorrelation coefficients fall beyond the double standard deviations, and the p-value corresponding to Q-statistics is less than 0.05, it is proved that the series has autocorrelation and ARCH effect. It shows that the autoregressive model can explain series volatility, and future volatility can be predicted by historical volatility.
e) When the ARCH effect exists, the EGARCH model is established by considering the asymmetry and leverage effect of the variance effect.
where
Parameter estimation is carried out in the above steps. Carbon price prediction on the d day
Day-ahead electricity market model with the carbon cost
Carbon emitting power generation unit
With the increasing number of industries included in the carbon market and the fluctuation of the carbon price, CEPGU will face more significant uncertainty in making power generation and carbon quota plans. The generation cost model of the CEPGU is as follows:
where
The generation cost in the quadratic function is piecewise linearized and divided into K segments. The original model is formulated as follows:
where
The dispatch center publishes the electricity demand for each period of the trading day before the trading day in advance. Based on the market judgment and the acceptable risks (Li et al., 1999), the generation units can divide the range of quotation coefficients into three categories: If unit i is a risk-pursuing type, the range of quotation coefficient is
Zero carbon emitting power generation unit
Although the output of wind and solar power shows significant volatility and randomness, wind and solar power generation units hardly produce carbon emissions during operation. Then they can be regarded as zero carbon emitting generators, which are considered fully absorbed in the following market clearing.
Electricity market clearing with the carbon cost
The electricity market clearing calculation is carried out after the quotation of unit. The quotation of unit is sorted from low to high. Moreover, the market-clearing point under the corresponding load in each period is calculated to determine the bid-winning quantity of marginal units and the unbid-winning quotation segment of units. The objective function of market-clearing
where T is the total number of trading periods in 1 day.
At the same time, the following constraints should be considered:
a) Power balance constraint
where
b) Unit output constraint
where
c) Unit climbing rate constraint
d) Minimum time constraints of on and off state
where
After clearing, it is necessary to check whether the results meet the constraints of the grid.
Carbon market model
The surplus and shortage amount of carbon quota are fast becoming a key influence factor in the carbon quota plan of the CEPGU. Based on the clearing result of the electricity market, the corresponding carbon emissions are calculated, and the marginal carbon emission abatement cost and carbon price prediction are compared to make the quota purchase and sale decision. The time scale of carbon trading is generally long. On the one hand, to match the time scale of the electricity market, on the other hand, to disperse the risks of carbon market trading, the frequency of CEPGU participating in carbon trading can be enhanced. The units will decide whether to enter the carbon market trading according to the daily quota surplus or shortage. As for the market mechanism, enhancing the circulation of carbon quota and market activity can make the carbon price close to the actual social marginal carbon emission abatement cost.
Calculation of carbon emissions
The carbon emission of unit i in period t can be expressed as:
where
Carbon quota trading strategy
The surplus and shortage amount of carbon quota of unit i on the d day
where
Marginal carbon emission abatement cost refers to each additional unit of carbon reduction cost. It is an essential factor in influencing the emission reduction cost and the quota plan of enterprises or units. Considering the daily carbon price prediction and its own marginal carbon emission abatement cost, the quota trading decision of unit i
where
Centralized carbon trading model
It is assumed that all market members are recipients of the carbon price. The market members declare the information about the surplus or shortage amount of carbon quotas on the carbon trading platform. The platform matches according to the principle of price priority and declaration time priority. The quotation of market members who buy (sell) quota will be ranked from high to low (from low to high) to form the quota demand (supply) curve, and the members with the exact quotation will be ranked according to the declaration time sequence. The market-clearing point is the intersection of the quota supply curve and demand curve. The corresponding value of the horizontal axis is the clearing quota volume, and the corresponding value of the vertical axis is the clearing carbon price.
The objective function of the carbon market is to maximize the social benefit
where N and M denote the number of quota demanders and suppliers during trading period.
Constraints on carbon market trading are as follows:
a) Quota trading volume constraint
In order to prevent market manipulation, the carbon quota demand of member i on the d day
b) Market price constraint
where the declared quotation of market members should be between the upper limit
c) Market equilibrium constraint
where the total quantity of carbon quota trading pairs
In the final trading result of the carbon market, the declared quotation before the market-clearing point
where
Simulation
Basic data
This paper uses the modified IEEE30 node system for case simulation, and four coal-fired units, one wind and one solar power generation unit are set. Parameters such as unit type, rated power, upper and lower output limits, slope climbing rate and coal consumption coefficient are listed in Table 1. Wind and solar power output are shown in Figure 2. Table 2 shows the carbon emission intensity, allocation values of electricity generation, average annual load rate and initial daily carbon quota of the four coal-fired units in 2020. The initial daily carbon quota allocation is replaced by the average value of the pre-allocated quota in 2021. The electricity market model constructed in this paper takes 24 h as a cycle, 1 h as a step length, and the carbon market model takes 1 day as a cycle. YALMIP/CPLEX solves the two market models in MATLAB. The computation time is 81.66 s.
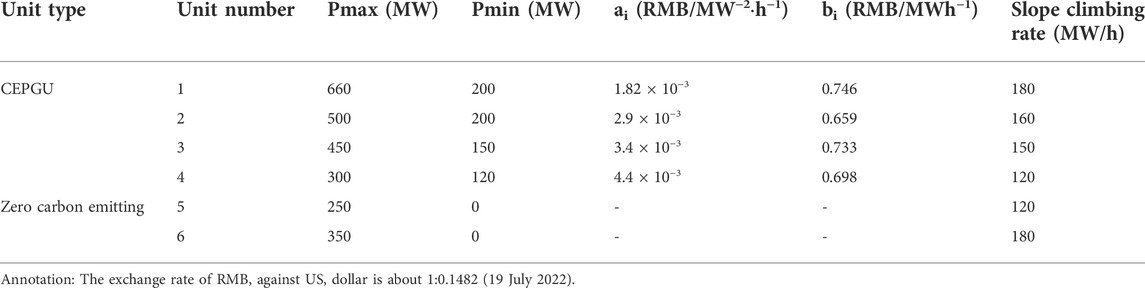
TABLE 1. Unit economic and technical parameters.

FIGURE 2. The power output of wind and PV.
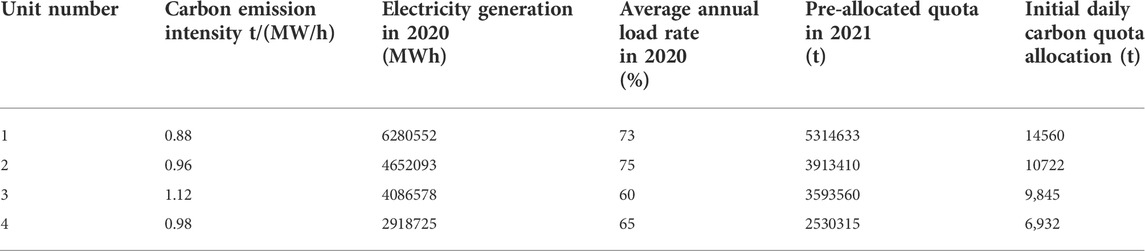
TABLE 2. Simulation parameter setting.
Carbon price prediction
Figure 3 shows the carbon price fluctuation of the national carbon market in China from July 2021 to December 2021. Econometric software Eviews8.0 is used to analyze the fluctuation of the national carbon price. The period from 16 July 2021, to 26 November 2021, is selected as the estimation interval. The period from 29 November 2021, to 6 December 2021, is selected as the prediction interval to verify the rationality of the prediction model.
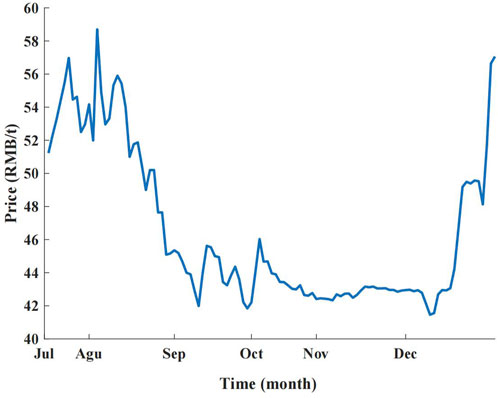
FIGURE 3. The carbon price of the national carbon market in China.
The statistical analysis of the logarithmic return series of the carbon price is shown in Table 3, which indicates that the series distribution has a long right trailing and is characteristic of sharp peaks and thick tails. The Jarque-Bera statistic shows that the series rejects the assumption of normal distribution.
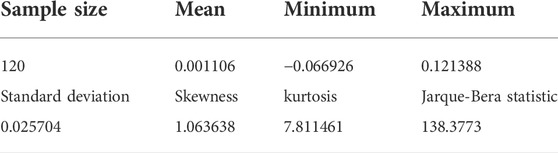
TABLE 3. Summary statistics of CEA logreturns.
ADF test results are shown in Table 4. The t-statistic value is less than the critical value under the test level of 1, 5 and 10%. The probability is less than the significance level, indicating that the series is stable.
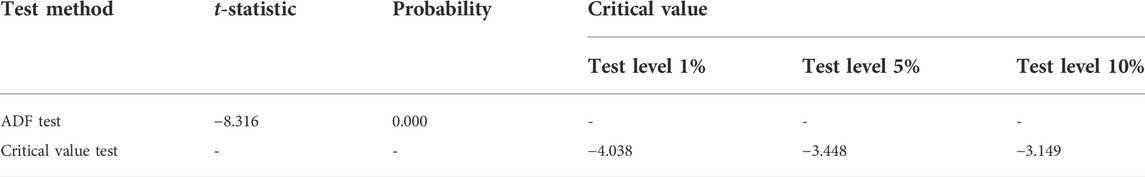
TABLE 4. ADF test of CEA benefit.
The autocorrelation (AC) and partial autocorrelation (PAC) coefficients of the series are shown in Supplementary Table SA1. When they fall within the double standard deviations, and the probability corresponding to the Q-statistic is greater than the confidence level of 0.05, there is no significant correlation between the series at the significance level of 5%.
The series is tested by a square correlation graph of residuals, as shown in Supplementary Table SA2. Its autocorrelation and partial autocorrelation coefficients fall beyond the double standard deviations. The p-value corresponding to Q-statistics is less than 0.05, which indicates the ARCH effect.
Based on the above tests and analysis, the ARCH effect exists in the logreturns of the carbon price, so the EGARCH model can be used to estimate and predict the sample data of the series. The series is imported into the econometric software Eviews8.0 to obtain empirical results, as shown in Table 5. The coefficients of each variable in the model have significant effects at the significance level of 0.05, and the carbon price estimation model can be established. The residuals, logreturns and conditional standard deviation of the carbon price estimation model from July 2021 to December 2021 are shown in Figure 4, which indicates that the logreturns and residual series have the same distribution.
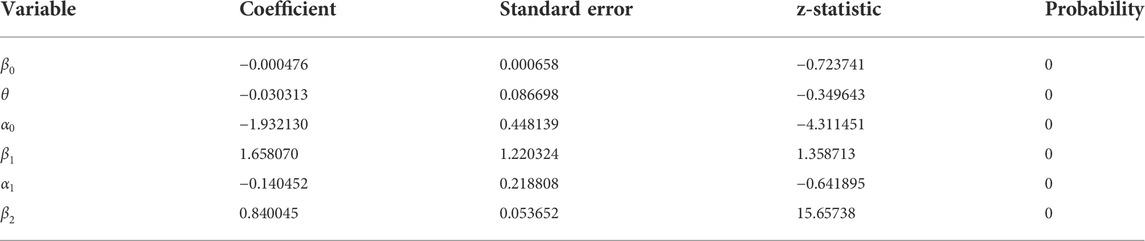
TABLE 5. Parameter estimates of CEA benefit sample for July 2021 - December 2021.
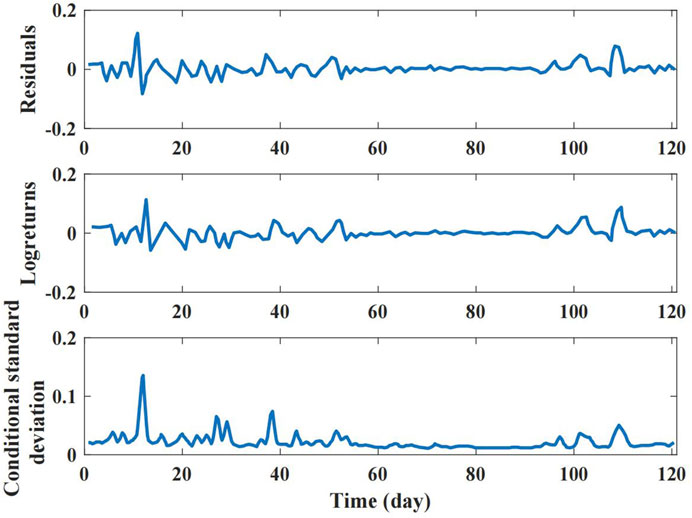
FIGURE 4. Residuals, logreturns and conditional standard deviation of the model in the estimation phase.
Electricity market clearing results
The carbon price from November 29 to 6 December 2021, is predicted using the logarithmic benefit model of carbon price obtained in the estimation phase. The historical data of the estimation phase before November 29 is used to predict the carbon price on November 29. The predicted simulated value is compared with the actual value of the carbon price. The real value of the carbon price on November 29 is also included in the estimation period. The carbon price on November 30 is predicted as above. The rest can be updated in the same steps as shown in Table 6. The relative errors of carbon price prediction are all within 4%. It is generally believed that if the value of mean absolute percentage error (MAPE) is lower than 10, or Theil inequality coefficient is between 0 and 1, the prediction accuracy of the model can be considered high. Therefore, the estimation model constructed above for the logarithmic benefit of the carbon price can better simulate the trend of the carbon price and is suitable for the analysis and prediction of the carbon market. The predicted carbon price of 45.03 RMB/t on December 6 is taken as the predicted carbon price of the d day in the coordinated trading strategy of the carbon and electricity market.
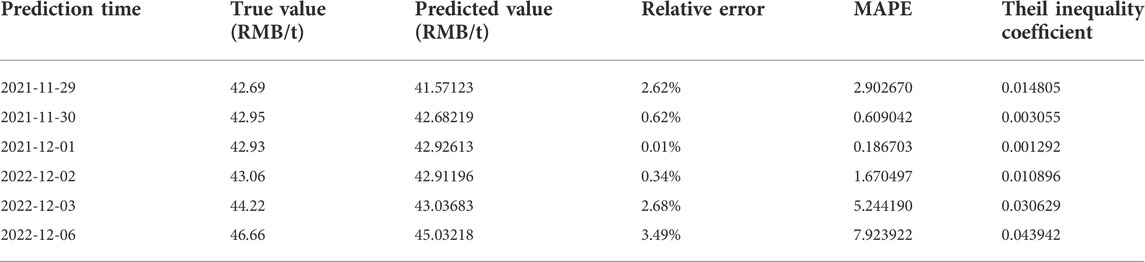
TABLE 6. Forecasting of CEA benefit sample.
On the d-1 day, each unit makes the electricity market quotation according to the load demand of the d day (as shown in Figure 5). On the initial day, there is no carbon cost item in the unit generation cost model, and the carbon cost of the previous day is included in the generation cost model after the initial day. In order to avoid the uncertainty of carbon price fluctuation, all units are selected as risk-averse types, and
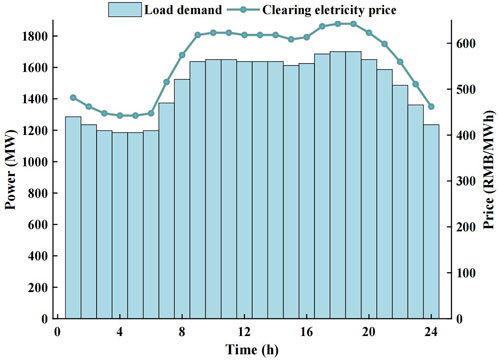
FIGURE 5. System load and clearing electricity price.
According to the quotation of the CEPGU, the power output of each unit is shown in Figure 6. Unit 2 with a lower price prioritizes clearing, and the quoted quantity is preferentially satisfied, while units 1, three and 4 with a higher quotation can clear part of the quotations. Unit four can only be dispatched during peak load periods due to the high cost of generating power and the corresponding high quotation price. The units produce the carbon emissions, as shown in Figure 7.
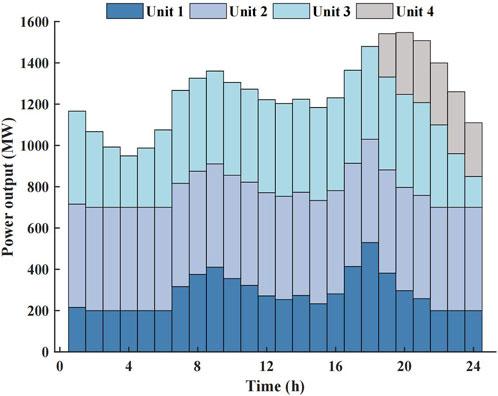
FIGURE 6. Power output of CEPGU.
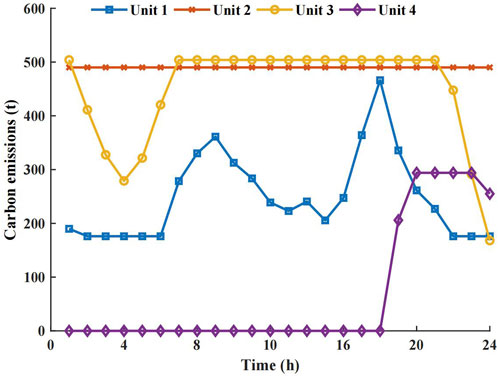
FIGURE 7. Carbon emission of CEPGU.
Carbon market trading results
Four CEPGUs trade with four non-power industry members in the carbon market. Their quota surplus and shortage, and marginal carbon emission abatement cost are shown in Table 7. In Table 7, when the surplus and shortage amount of quota is negative, it means that quota needs to be purchased; when it is positive, there is a surplus quota to be sold. Units 2, three and members 5, seven have quota surpluses, while units 1, four and members six and eight have quota shortages. All units and members are willing to trade quota, whose quoted price is according to marginal carbon emission abatement cost, and quoted quantity is according to quota surplus and shortage.
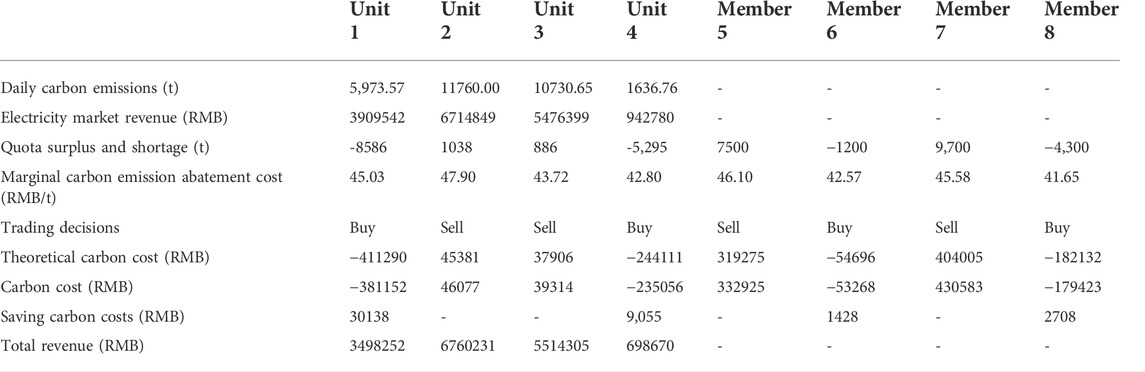
TABLE 7. Information and market revenue of electricity market and carbon market members.
The simulation results of matching in the carbon market are shown in Figure 8. The quota supplier is member 7, member 5, unit three and unit two in ascending order of quotation price. The demand side of the quota is unit 1, unit 4, member six and member eight in descending order of quotation. The total quota supply is 19,123.65 tons, the total quota demand is 19,381.67 tons, and the final quota trading volume is 19,123.65 tons. As the total quota supply is lower than the total demand, member eight at the end of the quota demand curve becomes the marginal user of the transaction, which intends to purchase 4,300 tons of quota. However, the actual purchase quota is 4,041.98 tons. The average price quoted by marginal user member eight and unit two at the end of the quota supply and demand curve forms the final carbon clearing price of 44.39 RMB/t.
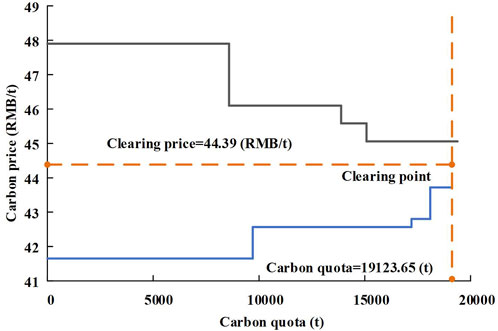
FIGURE 8. Carbon market clearing results.
The daily carbon emissions of CEPGU, the electricity market income, and the carbon costs of each unit and member are shown in Table 7. The carbon costs of the unit on this day are included in the generation cost model for the next day. Unit two and three get their negative carbon market cost (equivalent to positive income) by selling surplus quota with the clearing carbon price. The money paid by unit one and unit four to purchase the quota shortage with the clearing carbon price is the actual carbon cost of unit one and unit 4. If the unit does not participate in carbon trading, the money paid by it for the excessive carbon emission as its own marginal carbon emission abatement cost is the theoretical carbon cost. By comparing the theoretical carbon cost and actual carbon cost of units 1 and 4, the theoretical carbon cost is higher than the actual one. The two are deducted to obtain the remaining carbon cost, indicating that the power generation units can reduce their carbon emission cost by participating in the carbon market. The carbon emission trading system adds additional costs to high-carbon emitting generators. It encourages them to reduce carbon emissions by reducing power generation or upgrading or investing in low-carbon technologies. It also encourages the production of low-carbon power generation units or the use of extra revenue for low-carbon investment. Overall, the flow of carbon quota in the market reduces the total carbon cost of the market and promotes capital to tilt toward low-carbon power generation units.
Conclusion
Based on the carbon quota decomposition and carbon price prediction model, this paper constructs the generation cost model of the CEPGU and the quota trading decision model under the carbon and electricity markets framework. The EGARCH carbon price prediction model is considered to update to help make the coordinated carbon and electricity trading strategy on a short time scale. The coordinated trading strategy of the carbon and electricity market establishes the correlation between bid-winning power output and the surplus and shortage amount of carbon quotas. It realizes the coordination between the generation plan and the carbon quota level of CEPGU. The demanders of carbon quota, unit 1, unit 4, member six and member seven reduce their carbon cost by about 7.91, 3.85, 2.68 and 1.51% through participation in the carbon market. The coordinated trading process of the carbon and electricity markets matches the trading time scales of the two markets. It promotes the optimal allocation of production and carbon emission factors in the power sector. It also helps the clearing carbon price reflect the social marginal carbon emission reduction cost. This paper only considers the power generation side of the electricity market as the carbon market participant, and the next step is to introduce the demand side of the electricity market into the carbon market. The impact of other carbon price levels on the model will be considered in future research.
Data availability statement
The original contributions presented in the study are included in the article/Supplementary Material further inquiries can be directed to the corresponding author.
Author contributions
The research was designed and performed by YY, JL, XX, and KX. The data was collected by ZL, YX, and BY. Analysis of data was performed by YY, JL, and XX. Finally, the original draft was written by YY. JL and XX reviewed and edited the manuscript. All authors agreed to be accountable for the content of the work.
Funding
This work was supported by the National Natural Science Foundation of China through the research project grant U2066209.
Conflict of interest
Authors ZL, YX, and BY were employed by the Powerchina Hydropower Development Group Co., Ltd.
The remaining authors declare that the research was conducted in the absence of any commercial or financial relationships that could be construed as a potential conflict of interest.
Publisher’s note
All claims expressed in this article are solely those of the authors and do not necessarily represent those of their affiliated organizations, or those of the publisher, the editors and the reviewers. Any product that may be evaluated in this article, or claim that may be made by its manufacturer, is not guaranteed or endorsed by the publisher.
Supplementary material
The Supplementary Material for this article can be found online at: https://www.frontiersin.org/articles/10.3389/fenrg.2022.977509/full#supplementary-material
References
Andrianesis, P., Biskas, P., and Liberopoulos, G. (2021). Evaluating the cost of emissions in a pool-based electricity market. Appl. Energy 298, 117253. doi:10.1016/j.apenergy.2021.117253
Benz, E., and Trück, S. (2009). Modeling the price dynamics of CO2 emission allowances. Energy Econ. 31, 4–15. doi:10.1016/j.eneco.2008.07.003
Chen, L., Liu, Y., Gao, Y., and Wang, J. (2021). Carbon emission trading policy and carbon emission efficiency: an empirical analysis of China’s prefecture-level cities. Front. Energy Res. 9, 793601. doi:10.3389/fenrg.2021.793601
Chen, Z., Yuan, X.-C., Zhang, X., and Cao, Y. (2020). How will the Chinese national carbon emissions trading scheme work? The assessment of regional potential gains. Energy Policy 137, 111095. doi:10.1016/j.enpol.2019.111095
Cui, J., Li, Y., He, C., Zhang, Z., Wang, H., Tang, J., et al. (2021). Optimal electricity allocation model under China’s planning-market double-track mechanism considering bidding game of generation companies. Front. Energy Res. 9, 673228. doi:10.3389/fenrg.2021.673228
Deane, J. P., Driscoll, Á., and Gallachóir, B. P. Ó. (2015). Quantifying the impacts of national renewable electricity ambitions using a North–West European electricity market model. Renew. Energy 80, 604–609. doi:10.1016/j.renene.2015.02.048
Duan, S., Chen, H., Xiao, D., Huang, J., Zheng, X., and Deng, S. (2021). “Analysis of electricity market equilibrium considering carbon emission mechanism,” in 2021 international conference on power system technology (POWERCON). Presented at the 2021 international conference on power system technology (POWERCON), Haikou, China, 08-09 December 2021 (IEEE), 625–629. doi:10.1109/POWERCON53785.2021.9697475
Eugenia Sanin, M., Violante, F., and Mansanet-Bataller, M. (2015). Understanding volatility dynamics in the EU-ETS market. Energy Policy 82, 321–331. doi:10.1016/j.enpol.2015.02.024
Feng, Q., Wu, Z., and Zhang, W. (2020). Carbon emissions market adjustment in the electricity supply sector: a government perspective. J. Clean. Prod. 275, 123132. doi:10.1016/j.jclepro.2020.123132
Feng, T., Li, R., Zhang, H., Gong, X., and Yang, Y. (2021). Induction mechanism and optimization of tradable green certificates and carbon emission trading acting on electricity market in China. Resour. Conservation Recycl. 169, 105487. doi:10.1016/j.resconrec.2021.105487
Jin, J., Zhou, P., Li, C., Bai, Y., and Wen, Q. (2020). Optimization of power dispatching strategies integrating management attitudes with low carbon factors. Renew. Energy 155, 555–568. doi:10.1016/j.renene.2020.03.174
Kockar, I., Conejo, A. J., and McDonald, J. R. (2009). “Influence of emissions trading scheme on market clearing and prices,” in 2009 IEEE power & energy society general meeting. Presented at the energy society general meeting (PES), Calgary, Canada, 26-30 July 2009 (IEEE), 1–5. doi:10.1109/PES.2009.5275425
Li, C-A., Svoboda, A. J., Guan, X., and Singh, H. (1999). Revenue adequate bidding strategies in competitive electricity markets. IEEE Trans. Power Syst. 14, 492–497. doi:10.1109/59.761871
Lin, J., Kahrl, F., Yuan, J., Chen, Q., and Liu, X. (2019). Economic and carbon emission impacts of electricity market transition in China: a case study of Guangdong province. Appl. Energy 238, 1093–1107. doi:10.1016/j.apenergy.2019.01.128
Liu, X., and Jin, Z. (2020). An analysis of the interactions between electricity, fossil fuel and carbon market prices in Guangdong, China. Energy Sustain. Dev. 55, 82–94. doi:10.1016/j.esd.2020.01.008
Liu, X. (2022). Research on bidding strategy of virtual power plant considering carbon-electricity integrated market mechanism. Int. J. Electr. Power Energy Syst. 137, 107891. doi:10.1016/j.ijepes.2021.107891
Nazifi, F., Trück, S., and Zhu, L. (2021). Carbon pass-through rates on spot electricity prices in Australia. Energy Econ. 96, 105178. doi:10.1016/j.eneco.2021.105178
Ruhnau, O., Bucksteeg, M., Ritter, D., Schmitz, R., Böttger, D., Koch, M., et al. (2022). Why electricity market models yield different results: carbon pricing in a model-comparison experiment. Renew. Sustain. Energy Rev. 153, 111701. doi:10.1016/j.rser.2021.111701
Sun, C., Wei, J., Zhao, X., and Yang, F. (2022). Impact of carbon tax and carbon emission trading on wind power in China: based on the evolutionary game theory. Front. Energy Res. 9, 811234. doi:10.3389/fenrg.2021.811234
Višković, V., Chen, Y., and Siddiqui, A. S. (2017). Implications of the EU emissions trading system for the south-east Europe regional electricity market. Energy Econ. 65, 251–261. doi:10.1016/j.eneco.2017.04.033
Wang, G., Zhang, Q., Su, B., Shen, B., Li, Y., and Li, Z. (2021). Coordination of tradable carbon emission permits market and renewable electricity certificates market in China. Energy Econ. 93, 105038. doi:10.1016/j.eneco.2020.105038
Wang, P., Tang, J., Zhang, Z., Li, Y., Wu, H., Ji, C., et al. (2022). Bidding strategy optimization for power generation company in carbon emission rights and electricity market. Energy Rep. 8, 325–331. doi:10.1016/j.egyr.2022.02.174
Wang, S., Wan, L., Li, T., Luo, B., and Wang, C. (2018). Exploring the effect of cap-and-trade mechanism on firm’s production planning and emission reduction strategy. J. Clean. Prod. 172, 591–601. doi:10.1016/j.jclepro.2017.10.217
Wang, X., Bai, X., and Wang, P. (2022). Optimal capacity allocation model for integrated energy microgrids considering aggregation of prosumers under multi-market mechanisms. Front. Energy Res. 10, 875499. doi:10.3389/fenrg.2022.875499
Wattoo, W. A., Kaloi, G. S., Yousif, M., Baloch, M. H., Zardari, B. A., Arshad, J., et al. (2020). An optimal asset allocation strategy for suppliers paying carbon tax in the competitive electricity market. J. Electr. Eng. Technol. 15, 193–203. doi:10.1007/s42835-019-00318-3
Ying, Z., and Xin-gang, Z. (2021). The impact of Renewable Portfolio Standards on carbon emission trading under the background of China’s electricity marketization reform. Energy 226, 120322. doi:10.1016/j.energy.2021.120322
Yu, G., Wang, K., Hu, Y., and Chen, W. (2022). Research on the investment decisions of PV micro-grid enterprises under carbon trading mechanisms. Energy Sci. Eng. 1189. doi:10.1002/ese3.1189
Zhang, K., Yao, Y.-F., Liang, Q.-M., and Saren, G. (2021). How should China prioritize the deregulation of electricity prices in the context of carbon pricing? A computable general equilibrium analysis. Energy Econ. 96, 105187. doi:10.1016/j.eneco.2021.105187
Zhang, X., Gan, D., Wang, Y., Liu, Y., Ge, J., and Xie, R. (2020). The impact of price and revenue floors on carbon emission reduction investment by coal-fired power plants. Technol. Forecast. Soc. Change 154, 119961. doi:10.1016/j.techfore.2020.119961
Keywords: carbon market, electricity market, carbon emission, trading strategy, carbon emitting power generation units
Citation: Yang Y, Liu J, Xu X, Xie K, Lai Z, Xue Y and Yang B (2022) Cooperative trading strategy of carbon emitting power generation units participating in carbon and electricity markets. Front. Energy Res. 10:977509. doi: 10.3389/fenrg.2022.977509
Received: 24 June 2022; Accepted: 22 July 2022;
Published: 13 September 2022.
Edited by:
Dongliang Xiao, South China University of Technology, ChinaReviewed by:
Bo Liu, Kansas State University, United StatesHadi Farabi-Asl, Research Institute for Humanity and Nature, Japan
Copyright © 2022 Yang, Liu, Xu, Xie, Lai, Xue and Yang. This is an open-access article distributed under the terms of the Creative Commons Attribution License (CC BY). The use, distribution or reproduction in other forums is permitted, provided the original author(s) and the copyright owner(s) are credited and that the original publication in this journal is cited, in accordance with accepted academic practice. No use, distribution or reproduction is permitted which does not comply with these terms.
*Correspondence: Jichun Liu, amljaHVubGl1c2N1MTk3NUAxNjMuY29t