 Tongwen Jiang1
 Hedong Sun
- 1Science and Technology Management Department of China National Petroleum Corporation, Beijing, China
- 2PetroChina Research Institute of Petroleum Exploration and Development, Beijing, China
- 3PetroChina Tarim Oilfield Company, Korla, China
- 4Changqing Downhole Technology Company, CNPC Chuanqing Drilling Engineering Co., Ltd., Xi’an, China
The Keshen gas field in the Kuqa Depression, the Tarim Basin, China, contains multiple ultra-deep fractured tight sandstone gas reservoirs with edge/bottom water, which are remarkably complex in geologic structure, with fracture systems at different scales. There is still a lack of a method for effectively describing the flow behaviors of such reservoirs. In this paper, the fracture system was characterized by classes using the actual static and dynamic data of the gas reservoirs, and the mathematical models of gas (single-phase) and gas-water two-phase flows in “pore–fracture–fault” multi-porosity discrete systems. A fracture network system was generated randomly by the Monte-Carlo method and then discretized by unstructured grid. The flow models were solved by the hybrid-unit finite element method. Taking Keshen-2/8 reservoirs as examples, four types of dynamic formation modes were built up. Performances of reservoir of the same category were systematically analyzed, which revealed the coupling of gas supply and water invasion mechanisms in different fracture systems. The gas single-phase flow was found with the characteristic of “fault–fracture gas produced successively and matric-fracture system coupling overlaid”, while the gas-water two-phase flow showed the characteristic of “rapid water dash in fault, drained successive in fractures and matric block divided separately”. This study reveals the development features of this unique reservoir effectively, and designs development strategies of full life cycle water control for enhancing the gas recovery. It can be expected that the recovery factor of newly commissioning reservoirs would be increased by more than 10% as compared with the Keshen-2 gas reservoir. These findings will play an important role in guiding high and stable production of Keshen gas field development in the long term.
Introduction
Keshen gas field locates in the Kelasu structural belt of Kuqa Depression in Tarim Basin, China. The breakthrough of Well KS2 in August 2008 ushered in the large-scale exploration and development of the Keshen gas field. By the end of 2021, the original gas in place (OGIP) proved cumulatively reached 800 billion cubic meters (Bcm), and the annual gas production capacity exceeded 10.5 Bcm, allowing the Keshen gas field to be the main battlefield for increasing gas reserves and production in the Tarim Oilfield. With high mountains, numerous cliffs and ravines developed on the surface, and complex structures such as imbricate thrust structures and sudden structures underground, the Keshen gas field is characterized by large buried depth (5,000–8,000 m), high pressure (88–138 MPa), tight reservoir matrix (0.001–0.5 mD), multiple orders of faults, dominance of water-bearing gas reservoirs and complicated water/gas distribution.
The complex surface conditions and underground geological structures result in poor quality of seismic data. Conventional acquisition and processing technologies cannot essentially enhance the quality of data. Thus, the subsalt structures are very difficult to interpret, and the structures can hardly be confirmed. Without similar gas fields at home or abroad for reference, two stages of development tests have been carried out in Keshen-2 and Keshen-8 gas reservoirs in succession (Jiang and Sun, 2018). The Keshen-2 gas reservoir was developed using the areal well pattern and volumetric fracturing process, which is often adopted in unconventional gas reservoirs, with regard to concepts of tight gas and continuous oil and gas reservoirs. The designed production capacity was 35 × 108 m3/a. However, reliability evaluation was not conducted on seismic data for the development plan design and well deployment, resulting in a lot of failure and inefficient wells. Consequently, the initial production capacity was only 22 × 108 m3/a. At the initial stage of production, the formation pressure dropped evenly but rapidly, early two-phase flow back analysis (Zhang and Emami-Meybodi, 2020; Zhang and Emami-Meybodi, 2022) and online production rate transient analysis results shown that there was a large deviation between dynamic reserves and static reserves (Jiang et al., 2021). The actual development indexes deviated greatly from those in the designed plan, and water production was observed soon after production. The natural productivity was low, and the productivity declined rapidly after stimulation. The total absolute open flow potential of wells in the block after 3 years of production was only 30% of the initial production (Jiang and Sun, 2018). The Keshen-8 gas reservoir revealed satisfactory development performance in line with the strategy of hydrocarbon accumulation controlled by structures and production controlled by fractures (Shen et al., 2022).
Significantly different from conventional fractured gas reservoirs, the Keshen gas reservoirs have the development characteristics of great productivity differences among wells, fast inter-well pressure responses, and quick water invasion (Wang et al., 2018; Li et al., 2022). Accordingly, for the Keshen gas reservoirs, the development strategy was defined as “centralized well placement at high positions, moderate stimulation and early drainage” (Jiang and Sun, 2018; Li et al., 2022), and it was recognized that flow occurs in the “pore–fracture–fault” triple porosity system (Wei et al., 2019). However, conventional dual-porosity (Barenblatt et al., 1960; Warren and Root, 1963; Kazemi, 1969; Dean and Lo, 1988; Kazemi and Gilman, 1993; Zeng et al., 2012) and triple-porosity models (Liu, 1981; Liu, 1983; Wu et al., 2004; Wu et al., 2018) cannot accurately characterize the flow patterns in such strongly heterogeneous reservoirs with “pores–fractures–faults”. The discrete fracture network (DFN) model (Zambrano et al., 2016; Flemisch et al., 2017; Rueda Cordero et al., 2018; Li et al., 2018; Tarhuni et al., 2021) can accurately highlight the shape, orientation and conductivity of any fractures through visual description. Although it has obvious advantages in dealing with deterministic fractured sandstone reservoirs, the DFN model is not suitable for highly randomly developed fractured reservoirs. Therefore, a multi-scale random fracture network (Sun et al., 2022) and a multi-scale discrete fracture numerical well test model were constructed by randomly generating fractures and recombining them in batches and regions for better description of reservoir dynamic characteristics. It is necessary to further identify its mechanism, so as to establish a reliable foundation for formulating rational development strategy and enhancing recovery of the gas reservoir.
Considering the highly discrete presence of fractures in the Keshen gas field, based on the idea of DFN model, this paper presents a mathematical model of gas single-phase flow in “pore–fracture–fault” triple discontinuous media (Wei et al., 2019; Sun et al., 2022) to highlight the successive gas production and coupling gas supply mechanism between matrix and fracture systems of different scales. Using the flow experimental data (Qi et al., 2021; Wang et al., 2021), a gas-water two-phase flow model is established to reveal the progressive water invasion mechanism in fractures with different scales. Depending on the flow mechanisms of different types of gas reservoirs at different stages of development, corresponding development strategies are formulated.
Flow of gas in the pore–fracture–fault multi-scale media
Physical models and assumptions
The conventional dual-porosity continuum model of fractured reservoir (Figure 1A) assumes the fractures as the flow channels and the matrix as the reservoir space. This paper considers the multi-scale discrete fracture network physical model with three porous media, i.e., faults, fractures (both natural and induced fractures) and matrix, as shown in Figure 1B.
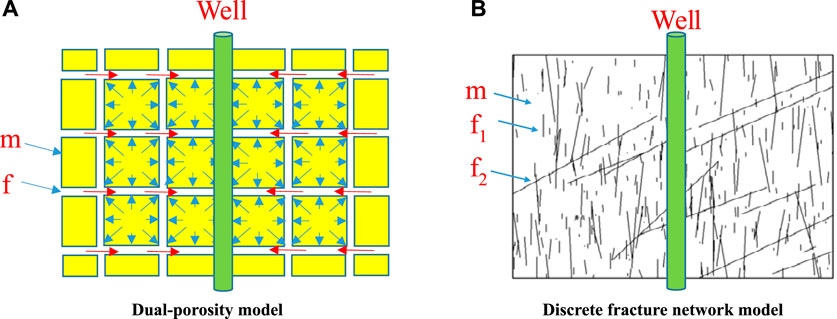
FIGURE 1. Physical models. (A) Dual-porosity model (B) Discrete fracture network model
It is assumed (Wei et al., 2019; Sun et al., 2022) that: (1) there are three kinds of porous media in the reservoir, i.e., matrix, fracture and fault, which are different in permeability on at least one order of magnitude; (2) the gas flow is single-phase flow subject to the Darcy’s law; (3) the flow of fluid is one-dimensional flow in fractures and faults, and two-dimensional flow in matrix, and both fractures and faults are finitely conductive fractures with different conductivities; and (4) natural fractures and faults are randomly generated according to the probability distribution function, and the induced fractures are wing-symmetrical fractures.
Mathematical model
The governing equation of fluid flow in matrix (Sun et al., 2022) is
The governing equation of fluid flow in faults (large fractures) is
The governing equation of fluid flow in natural fractures is
The governing equation of fluid flow in induced fractures is
The initial condition is
The inner boundary condition is
The outer boundary condition is
Dimensionless is defined as
where pD is the dimensionless pressure; xD and yD are the dimensionless coordinate position in the reservoir; lD is the dimensionless coordinate in the natural fracture; LD is the dimensionless coordinate position in the fault (large fracture); KsfD is the dimensionless permeability of the natural fracture; KbfD is the dimensionless permeability of faults (large fractures); KfD is the dimensionless permeability of artificial fractures; KmLD is the dimensionless permeability of the matrix; tD is the dimensionless time; CD is the dimensionless wellbore storage coefficient; x and y are the coordinate positions in reservoir, m; p is the reservoir pressure, MPa; ψ is the pseudo pressure, MPa2/(mPa·s); ϕ is the effective porosity, %; Ct is the total compressibility, MPa−1; μ is the gas viscosity, mPa·s; t is the production time, h; Km is the reservoir matrix permeability, mD; Kf is the permeability of induced fractures, mD; Ksf is the permeability of small fractures, mD; Kbf is the permeability of faults (big fractures), mD; Ff is the storativity ratio of induced fractures; Fsf is the storativity ratio of small fractures; Fbf is the storativity ratio of faults (big fractures); l is a location in the fracture, m; L is a location in the fault, m; xf is the half-length of the induced fracture, m; Γin is the inner boundary; qsc is the gas production under standard condition, m3/d; T is the reservoir temperature, K; h is the effective thickness of reservoir, m; C is the wellbore storage factor, m3/MPa; S is the skin factor, dimensionless; N is the number of inner boundary elements, dimensionless; n indicates the external normal direction of element Γ, dimensionless; Γout is the outer boundary; Z is the gas deviation coefficient, dimensionless; subscript w indicates the bottom hole; subscript I indicates the initial state.
The unstructured grid discretization technique is used to perform Delaunay triangulation on the calculation area containing random fractures, and the hybrid element finite element method is used to solve the model (Wan et al., 2016).
Flow mechanism
The numerical results of the above mathematical model show that different from the conventional viewpoint on the pressure gradient diffusion of the pseudo-homogeneous fracture network, there is a sudden change in pressure between adjacent media in the “pore–fracture–fault” system, and also spatial-temporal differences in gas production in different porous media. The gas single-phase flow is characterized by fault–fracture–pore gas produced successively, coupling overlaid, and synergistic gas supply. The prime pressure derivative (PPD) curve (Figure 2) (Mattar and Santo, 1992) derived from well test also shows the feature of gas supply from the matrix (the curve is usually a decline curve, and the energy supply is reflected when the curve stops falling and flattens).
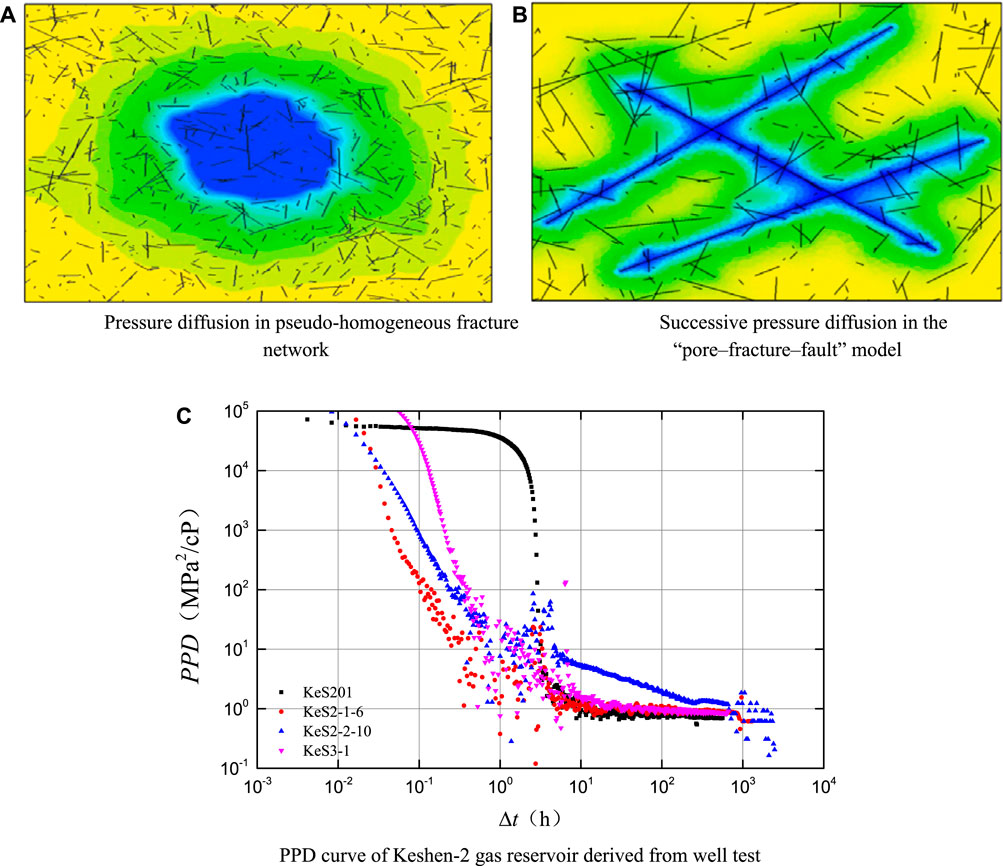
FIGURE 2. Gas supply mechanism of single-phase flow in multi-scale media. (A) Pressure diffusion in pseudo-homogeneous fracture. (B) Successive pressure diffusion in the. (C) PPD curve of Keshen-2 gas reservoir derived from well test.
Flow of gas/water in the pore–fracture–fault multi-scale media
Assumptions
There is a gas well in the discontinuous tight gas reservoir, and there are faults, natural fractures and induced fractures around the wellbore (Wei et al., 2019; Sun et al., 2022), as shown in Figure 1B. It is assumed that: (1) there are three kinds of porous media in the reservoir, i.e., matrix, fracture and fault, which are different in permeability on at least one order of magnitude; (2) the flow is gas-water two-phase flow subject to the Darcy’s law, the gas slippage effect is neglected, but the impacts of capillary force is considered; (3) the flow of fluid is one-dimensional flow in fractures and faults, and two-dimensional flow in matrix, and both fractures and faults are finitely conductive fractures with different conductivities; (4) natural fractures and faults are randomly generated according to the probability distribution function, and the induced fractures are wing-symmetrical fractures; and (5) primitive water occurs in three forms: edge water, bottom water and gas/water in the same layer.
Mathematical model
The governing equation of matrix pressure (Kong, 2020; Zhang and Emami-Meybodi, 2020; Shen et al., 2022) is:
The governing equation of matrix saturation is:
The governing equation of fracture (fault) pressure is:
The governing equation of fracture (fault) saturation is:
The initial condition is:
The inner boundary condition is:
The closed outer boundary is:
The outer boundary of edge water is:
The outer boundary of bottom water is:
where λ is the mobility, mD/(mPa·s); p is the reservoir pressure, MPa; ϕ is the effective porosity, decimal; Ct is the total compressibility, MPa−1; Ctw is the sum of pore compressibility and water compressibility, MPa−1; μ is the gas viscosity, mPa·s; t is the production time, h; Sw is the water saturation, dimensionless; Sgr is the residual gas saturation, dimensionless; △ph is the difference between bottom water pressure and original reservoir pressure at water invasion point, MPa; l is the coordinate axis of fracture governing equation, m; wf is the fracture width, m; Γin is the inner boundary; qg is the gas production under standard conditions, m3/d; h is the effective thickness of reservoir, m; Γout is the outer boundary; K is the reservoir permeability, mD; subscripts g, w, c and f indicate gas, water, capillary force and fracture or fault, respectively.
In this paper, the control volume finite-element method (CVFEM) is used to solve the governing equations composed of Eqs. 9–20, with detailed procedures given in Reference (Chen et al., 2006). CVFEM is a combination of finite element method and finite volume method. It integrates the interpolation function of the former and the numerical calculation format of the latter. Without the necessity of secondary reconstruction of grid, CVFEM can directly use the finite element grids, which are more flexible and accurate, and have the feature of local conservation of finite volume.
Model validation
The proposed model and the commercial numerical simulation software are used to numerically simulate the gas-water two-phase flow in induced fractures (without considering the random natural fractures) given the same reservoir parameters and gas-water permeability curve, in order to validate that the proposed model is constructed and solved correctly. The initial pressure of the reservoir is 30MPa, the temperature is 100°C, the permeability is 0.1mD, the effective thickness is 10m, the porosity is 10%, the water saturation is 60%, and the gas relative density is 0.6. The half-length of the fracture is 100m, the conductivity is 100mD•m, the gas flow rate is 10000 m3/d, production time is 1000 h. Figure 3 compares the calculation results of bottom-hole pressure and saturation field. It is found that the bottom-hole pressure and water production calculated by the proposed model are consistent with the results of the conventional classical model, which verifies the correctness of the proposed model and its solution.
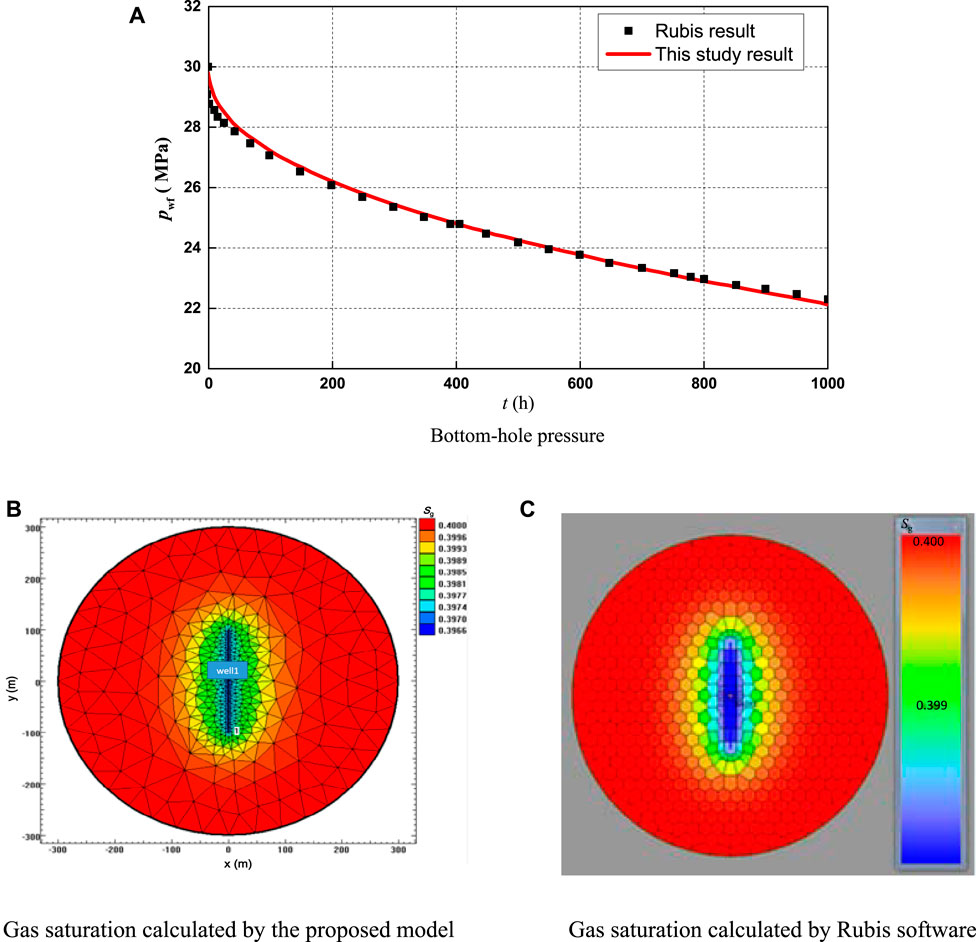
FIGURE 3. Calculation results of the proposed model and the Rubis software. (A) Bottom-hole pressure. (B) Gas saturation calculated by the proposed model. (C) Gas saturation calculated by Rubis software.
Flow mechanism
It can be concluded from the numerical results of the mathematical model above that, in different pore–fracture–fault combinations, the characteristics of water invasion are complex and diverse, rather than the singular mode of water channeling along fault/fracture in traditional view. Generally, gas-water two-phase flow in multi-scale media is characterized by “rapid dash in fault, drained successive in fractures and matric block divided separately”. In case of edge water, the initial pressure of the reservoir is 120MPa, the temperature is 160°C, the permeability is 0.2mD, the effective thickness is 80m, the porosity is 8%, the water saturation is 35%, and the gas relative density is 0.6. The drainage range is 1.2 km*1.2 km. There are 200 natural fractures in this area, the average fracture length is 200m, the conductivity is 10000mD·m, and the gas production is 50 × 104 m3/d to simulate the production for 710 d. With the production, pressure drops gradually and the edge water approaches the producer along faults or fractures. When the water invades into the producer, the water production increases significantly, and the bottom-hole pressure decreases greatly, as shown in Figure 4.
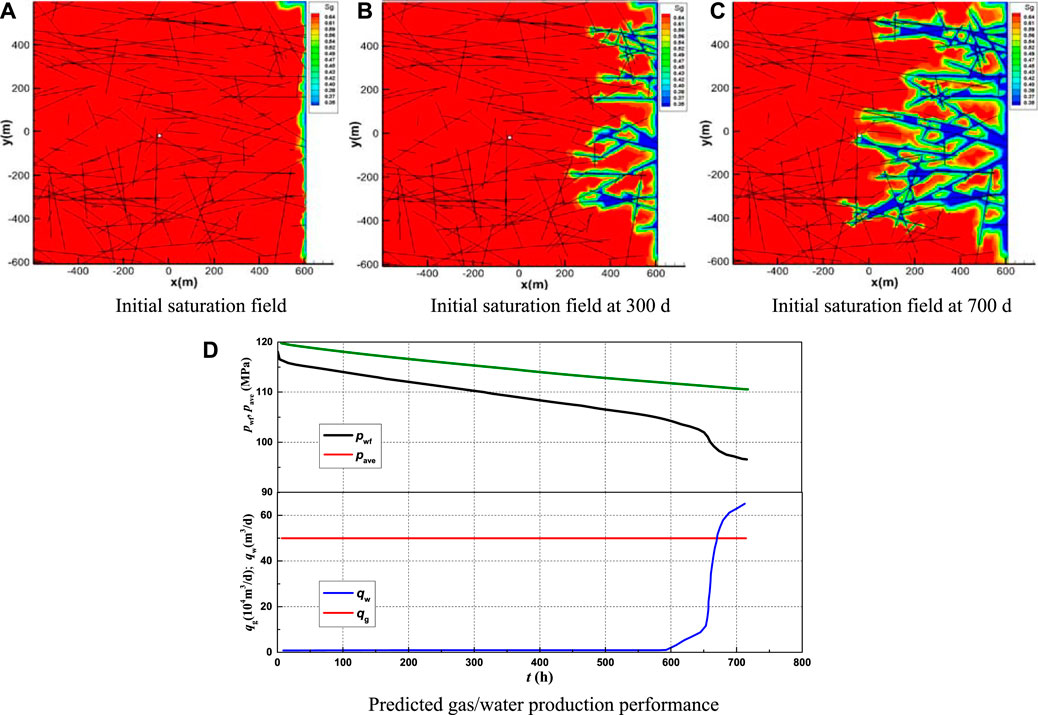
FIGURE 4. Mechanism of gas-water two-phase flow in multi-scale media (in case of edge water). (A) Initial saturation field. (B) Saturation field at 300 d. (C) Saturation field at 700 d. (D) Predicted gas/water production performance.
In case of bottom water, it is assumed that there are three points at which natural fractures communicate with the bottom water around the gas well. There are 100 natural fractures in the drainage area, the average fracture length is 150m, and other parameters are consistent with the edge water conditions. With the production, the pressure drops gradually, and the water approaches the well along the fractures. When the water invades into the well, the water production increases instantaneously. As the impacts of invasion points arrive one after another, the water production increases and the bottom-hole pressure decreases in steps. The three invasion points correspond to three steps, and the time of the steps coincides with the time when the water in the saturation pressure field invades into the well, as shown Figure 5. There is a large amount of residual gas in the matrix outside the water invasion pathways.
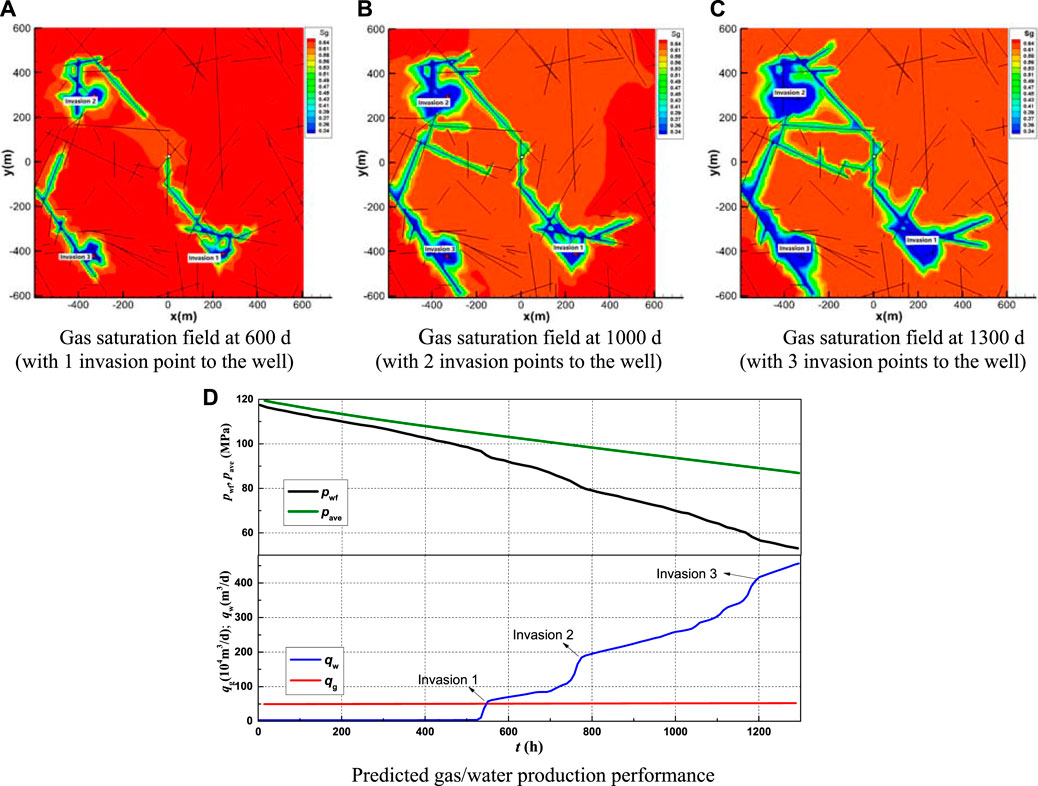
FIGURE 5. Mechanism of gas-water two-phase flow in multi-scale media (in case of bottom water). (A) Gas saturation field at 600 d (with 1 invasion point to the well). (B) Gas saturation field at 1000 d (with 2 invasion point to the well). (C) Gas saturation field at 1300 d (with 3 invasion point to the well). (D) Predicted gas/water production performance.
The high-pressure lab test also shows that the displacement is faster initially when there are more fractures. After the displacement interfaces intersect in fractures, a large amount of water trapped gas is generated in the matrix between two intersecting fractures, which reduces the instantaneous displacement efficiency. The more the intersected fractures, the easier the generation of water trapped gas. In the unstable displacement stage, migration of gases, including large gas bubbles and smaller foggy bubbles with small particle sizes, can be observed for a relatively long time. In the stable displacement stage, only a small quantity of bubbly water trapped gas is adsorbed at the interface between matrix and fracture, and a small amount of water trapped gas remains in the fracture channels, as shown in Figure 6.
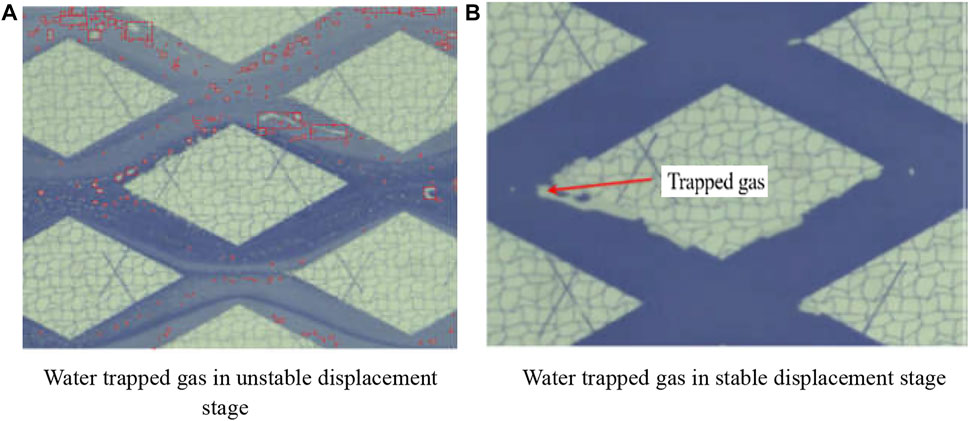
FIGURE 6. Test results for water trapped gas during displacement. (A) Water trapped gas in unstable displacement stage. (B) Water trapped gas in stable displacement stage.
Dynamic description of reservoirs in Keshen gas field
As a kind of typical fractured tight sandstone reservoirs, the Cretaceous Bashijiqike Formation reservoirs in the Keshen gas field experienced multiple phases of tectonic movements and intensive tectonic compression. Consequently, they exhibit complex patterns of fracture evolution and development, characterized by “multi-phase, multi-scale, multi-strata and multi-occurrence”, as shown in Figure 7.

FIGURE 7. Section of the Kelasu structural belt.
By using the 3D laser scanning for outcrop fracture characterization, imaging logging fracture identification under ultra-deep, high-temperature and high-pressure conditions, effectiveness evaluation and industrial CT fracture characterization, four structural patterns are identified in the Cretaceous. From north to south, the anticlines transits gradually from strongly compressive, highly steep and sudden anticlines to weakly compressive, wide, gentle and flat anticlines. Due to the difference in compressive stress during the uplift of South Tianshan Mountains, the northern belt (Keshen-2–Kela-2) is dominated by oblique extrusion deformation, with a series of basement involved thrust faults, together with multiple vertical imbricate stacks to form wedged thrust structure. The southern belt (south of Keshen-2) is dominated by horizontal shrinkage deformation, with a series of detachment faults to form detachment-thrust and abrupt structures. Fractures are different in characteristics from structural style to structural style, and the structural styles agree well with well test modes (Table 1).
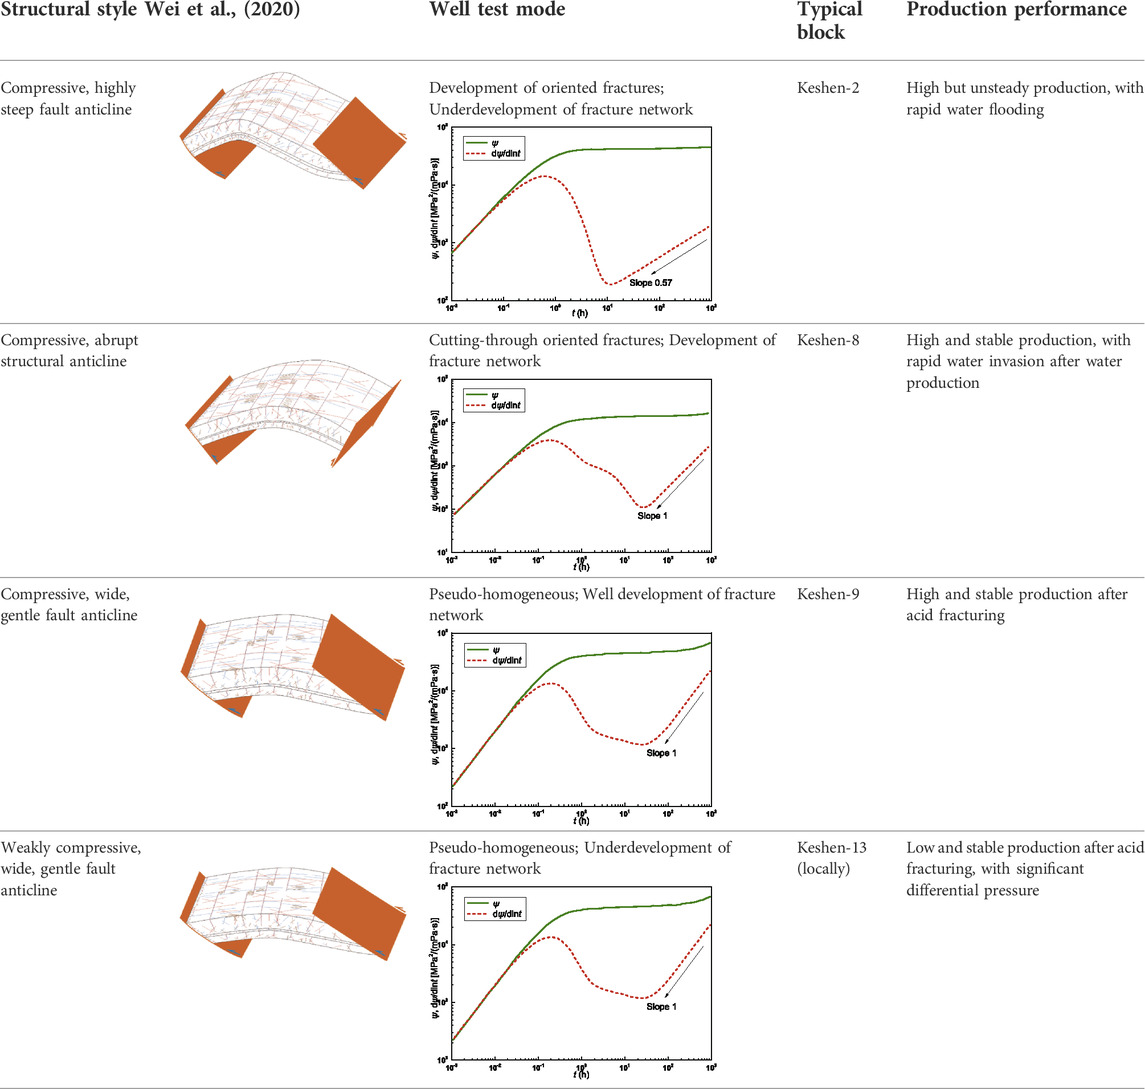
TABLE 1. Correlation of structural styles and well test modes in Keshen gas field.
Massive well test data show that the Keshen gas field has the characteristics of flow in pore–fracture–fault multi-scale media, and the permeability difference between matrix and fracture is more than 5 orders of magnitude. Figure 8 illustrates the well testing curves of typical wells. Since the existence of large fractures was not recognized in the early evaluation stage of Keshen 2 gas reservoir, the designed indexes were too optimistic. In reality, problems such as water production and sand production occurred shortly after the production.
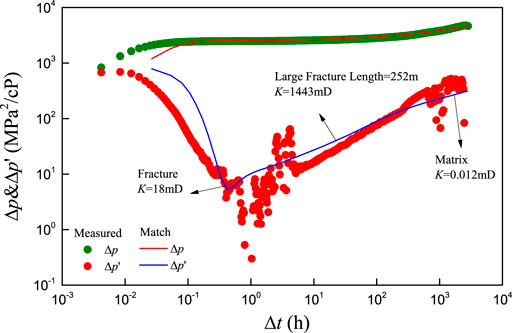
FIGURE 8. Pressure build-up test curve for a well in Keshen-2 gas reservoir.
In the past 2 years, breakthroughs in production profile technologies for gas wells with ultra-high pressure (with wellhead pressure over 100 MPa) and narrow tubing and extensive application of remote acoustic logging technologies further verified the accuracy of dynamic description based on well test data. As shown in Figure 9, the remote acoustic logging data interpretation results show the existence of large fractures around a well. Production profile test further proves that both gas and water are produced from these large fractures.
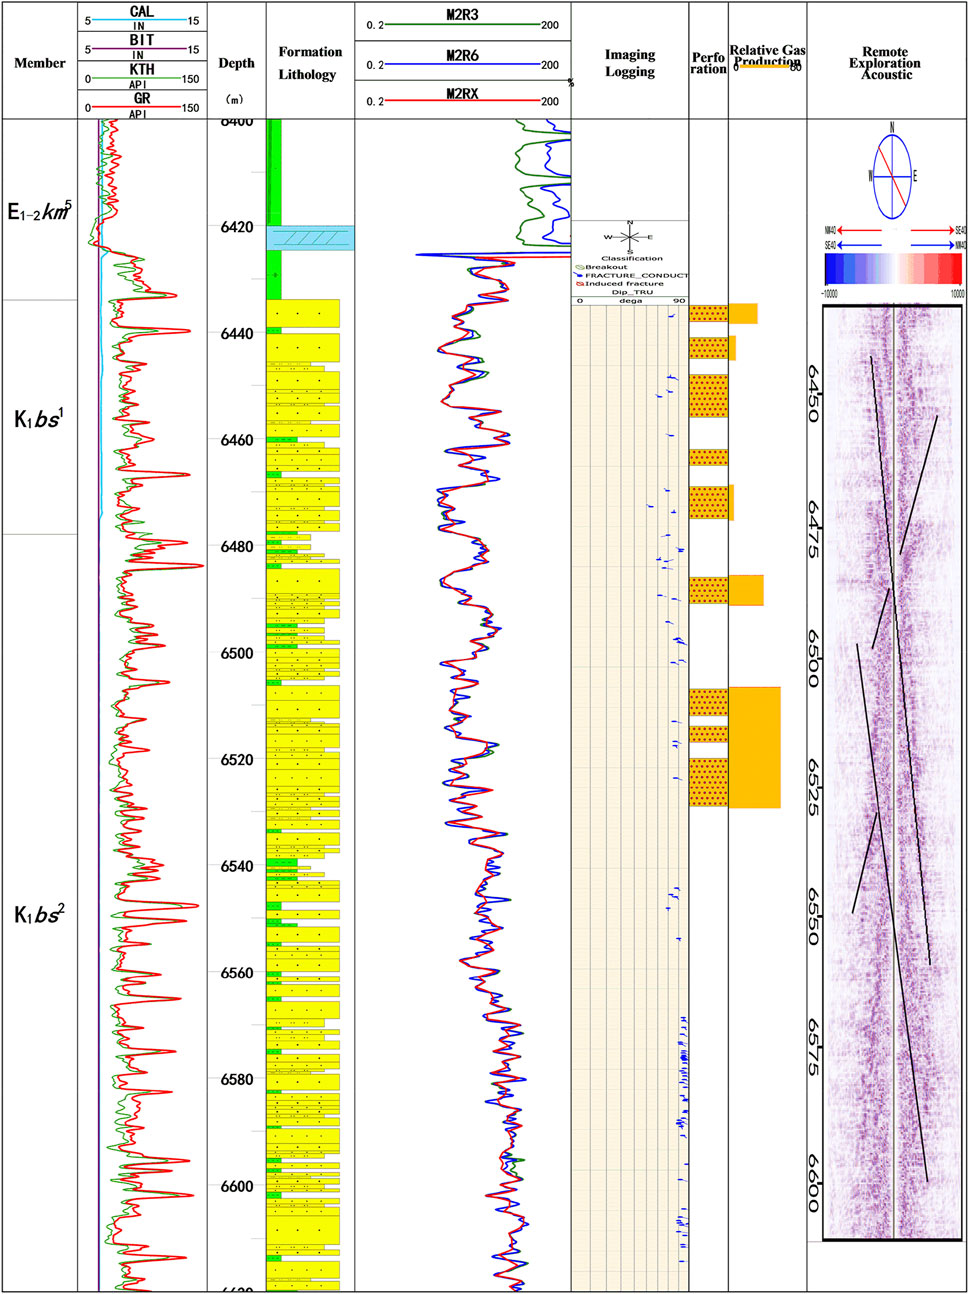
FIGURE 9. Comparison of production profile and remote exploration acoustic logging data of a well in Kelasu gas field.
Within individual gas reservoir, the overall connectivity is good, and different fracture patterns lead to varying production characteristics. According to well interference test, the inter-well interference is strong inside the gas reservoir. Due to the existence of “highway” between wells, the interference signal can reach the adjacent well, that is, 1 km away in ten some minutes, while the response time of the interference signal of two wells more than 10 km away is only 7–10 h. In the early development stage, the formation pressures in different parts of the gas reservoir basically keep decreasing synchronously. In the Keshen-2 gas reservoir with oriented fractures, pressure waves can sweep the entire fracture network within a short time, and formation water invades unevenly and rapidly along fault system. Matrix, fracture and fault are coupled in terms of gas supply (Figure 2B). However, the gas supply of the matrix system to the fractures is limited, leading to rapid decline of pressure and production; the gas reservoir is divided by water invasion channels after non-uniform water invasion. In addition to oriented large fractures, the Keshen-8 gas reservoir contains evenly distributed small fractures, allowing the gas wells to be highly capable of high and stable productivities. The flow behaviors of such gas reservoirs have been evidenced by the test results of Well KeS8-5. As shown in Figure 10, the remote exploration acoustic logging data show the existence of four faults within 30 m around Well KeS8-5; the imaging logging interpretation indicates that fractures are evenly distributed vertically in Well KeS8-5; the production profile test suggests that gas is not produced evenly, but predominantly from two intervals: 6853.0–6965.0 m and 6951.0–6953.0 m. These conclusions coincide well with the results of dynamic description based on well test data.
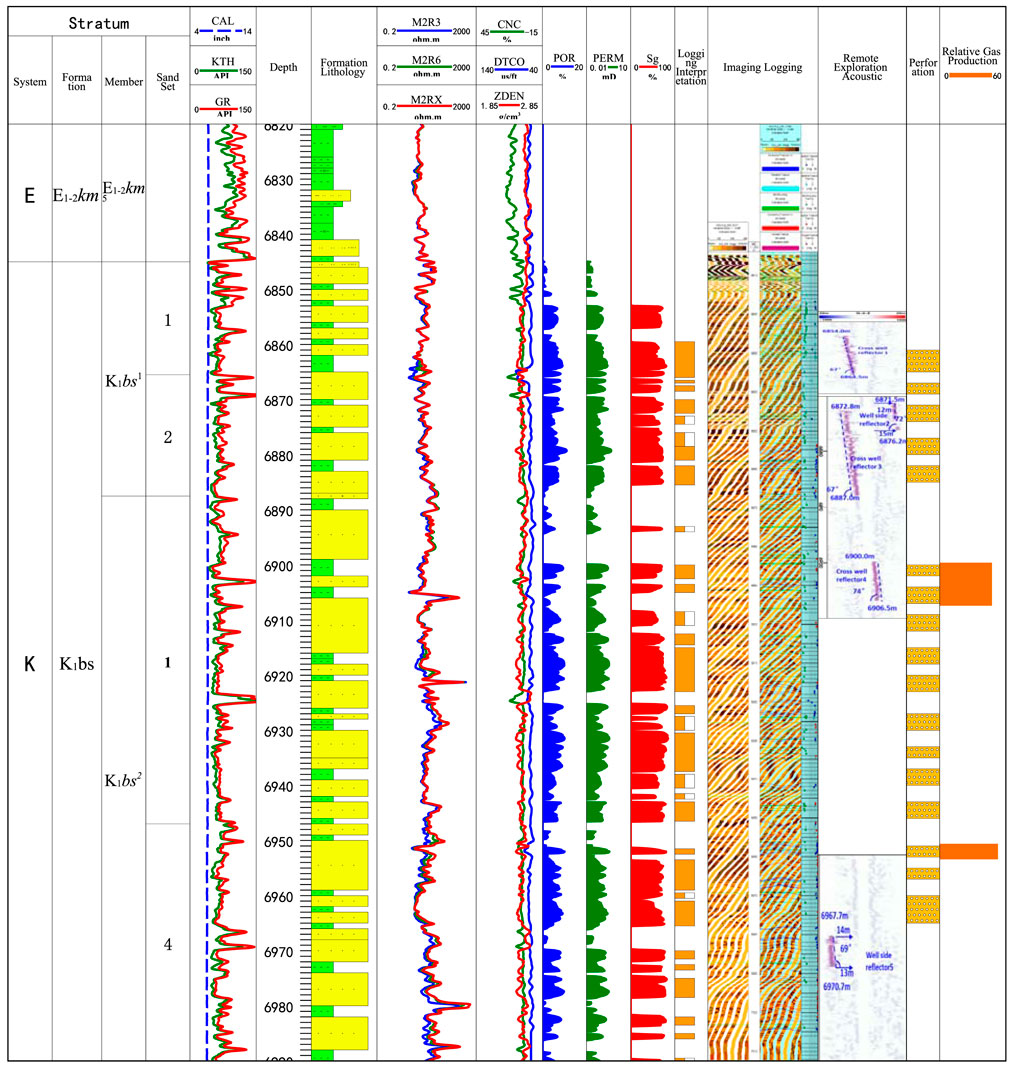
FIGURE 10. Physical properties and results of imaging logging, remote exploration acoustic logging and production profile test of Well KeS8-5.
Strategies for water control
Water invasion is the biggest challenge for maintaining the stable production at 10 Bcm in the Keshen gas field. Once water breaks through in the gas reservoir, the formation water may quickly invade the gas reservoir along the “highway” to cause “water trapped gas”, thereby reducing the production significantly. For example, the Keshen-2 gas reservoir was put into production test in April 2013, and water production was initially observed in wells at the edge in 2014. Because no continuous and effective efforts were made to drain the water timely, wells in the south, north and middle and high parts of the gas reservoir came into water production successively from May 2019. As a result, the gas production declined rapidly. The gas reservoir was divided by water with the significant feature of pressure partition, which made the gas recovery in the matrix very difficult. The Keshen-8 gas reservoir was put into production in July, 2015. Since 2020, water was produced in six wells (incl. KS8-11, KS801, and KS802) successively in the west of the gas reservoir. The formation water advanced rapidly along the large fault system (Figure 11). The logging data of the water-producing wells show that the main gas producing layers obviously correspond to the water producing layers, and the formation water mainly came from the fracture zone in the perforated interval.

FIGURE 11. Fine fault characterization and AFE microfracture attributes in Keshen-8 gas reservoir.
Mechanism research and development practices have proved that the early gas recovery by water drainage has a significant impact on the enhanced gas recovery of the Keshen-8 gas reservoir. After water production, the wells at the edge of the gas reservoir were transformed to be developed by water drainage, with the designed daily water drainage of 200–4,000 m3. Figure 12 shows the prediction results of numerical simulation. Clearly, as the water drainage increases, the abandonment pressure of the gas reservoir drops, the EUR improves, and the water breakthrough time delays. This scheme exhibits the EUR enhanced by 10%, abandonment pressure reduced by 7.62 MPa and water production in structural high delayed by 5 years compared with the schemes at the water drainage of 1000 m3 and 2800 m3.
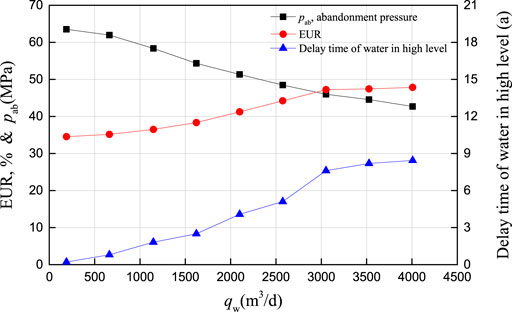
FIGURE 12. EUR and abandonment pressures at different water drainages.
In November 2021, coiled tubing enhanced gas lift drainage was conducted in two water-producing wells, KS801 and KS802, at the structural edge of the Keshen-8 gas reservoir. After the large-scale gas-lift drainage in Well KS801, Well KS8-11 maintained stable daily gas production and slight rise of tubing pressure (from 22.5 MPa in early December 2021 to 27.79 MPa in early February 2022) while the production system was kept unchanged, indicating remarkable effects. Moreover, the water drainage capacity of the two wells decreased gradually, which further indicates that the water energy is limited (Figure 13).
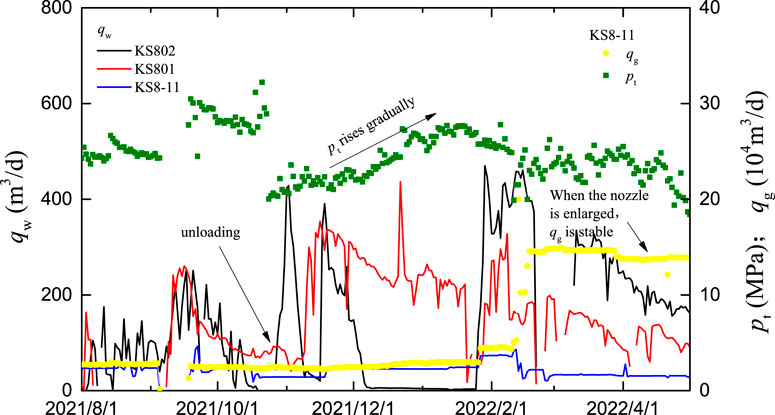
FIGURE 13. Production curve of Well KS8-11 after water drainage.
Enhanced gas recovery by water drainage was carried out in Wells KS802 and KS801 in the western part of the Keshen-8 gas reservoir. As a result, the chloride value in the reservoir decreased gradually until it became stabile. For example, the chloride value in Well KS8-15, 1.2 km away from Well KS802, decreased gradually from 85,772 mg/L and kept stable at 6,292–7,084 mg/L. As the intensity of water drainage reduced, the chloride value rose again rapidly (Figure 14).
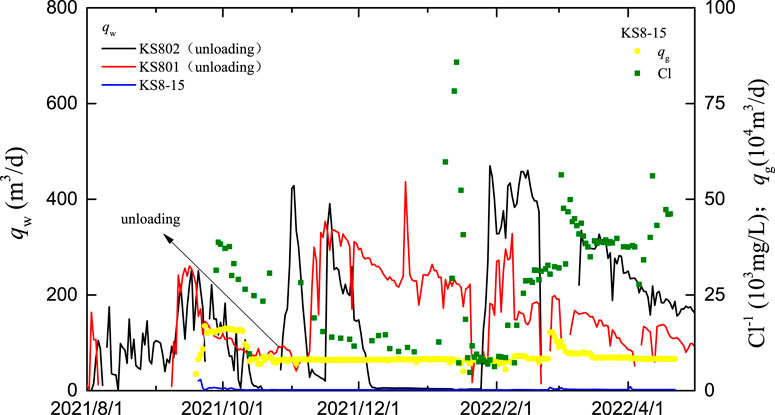
FIGURE 14. Change of chloride value in Well KS8-15.
The water drainage practices demonstrate that the early water drainage can cut off the “highway” for water invasion in the Keshen-8 gas reservoir. Accordingly, the water control strategies are customized for weak, strong and watered out gas reservoirs (Table 2).
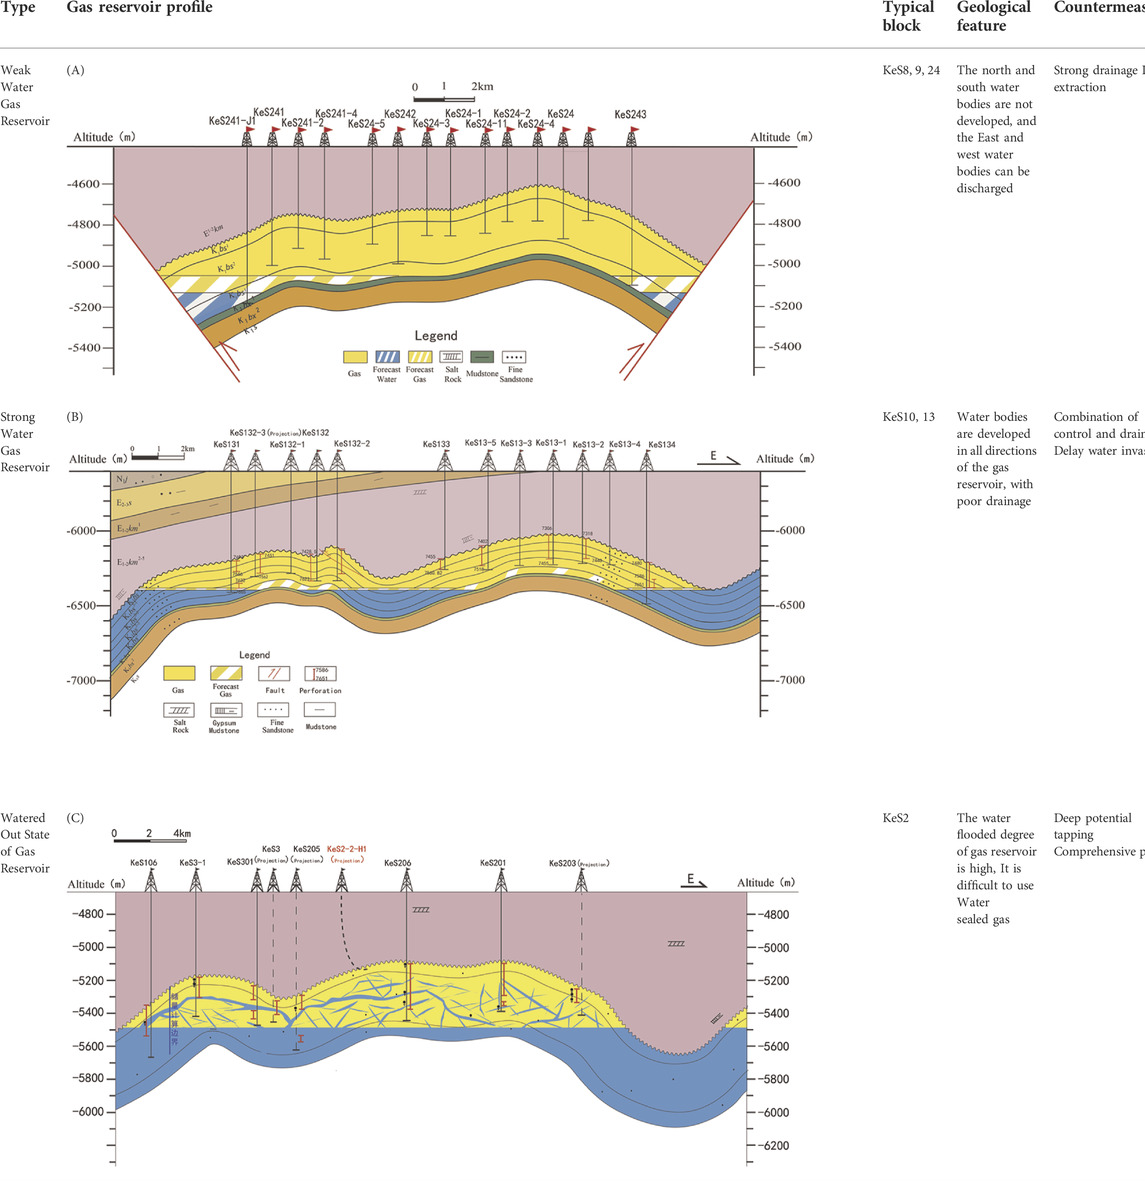
TABLE 2. Different water-control strategies for the Keshen gas fields.
Conclusion
(1) With comprehensive consideration to morphology, orientation and conductivity of multi-scale fractures, the mathematical model for coupling gas single-phase and gas-water two-phase flows in the pore–fracture–fault system was established. It provides a new way for researches related to development mechanism of tight sandstone gas reservoirs with pores, fractures and faults.
(2) There is a sudden change in pressure between adjacent media in the “pore–fracture–fault” system, and also spatial-temporal differences in gas production in different porous media. The mechanism of fault–fracture–pore gas produced successively, coupling overlaid, and synergistic gas supply is established, laying a foundation for enhancing the gas recovery through reservoir stimulation characterized by “moderate stimulation of low-efficiency fractures and expansion of fracture network for synergetic gas supply”.
(3) In different pore–fracture–fault combinations, the characteristics of water invasion are complex and diverse, rather than the singular mode of water channeling along fault/fracture in traditional view. Generally, gas-water two-phase flow in multi-scale media is characterized by “rapid dash in fault, drained successive in fractures and matric block divided separately”, laying a foundation for the water control strategy of “multi-scale complex flow field optimization for production allocation and early water drainage”.
(4) The water drainage practices demonstrate that the early water drainage can cut off the “highway” for water invasion in the Keshen-8 gas reservoir. This scheme exhibits the EUR enhanced by 10%, abandonment pressure reduced by 7.62 MPa and water production in structural high delayed by 5 years compared with the schemes at the water drainage of 1000 m3 and 2800 m3.
Data availability statement
The original contributions presented in the study are included in the article/supplementary material, further inquiries can be directed to the corresponding author.
Author contributions
TJ, HS, and XX contributed to conception and design of the study. WO organized the model. YT performed the statistical analysis. HS, WO, and SZ wrote the first draft of the manuscript. TJ, XX, and YT wrote sections of the manuscript. All authors contributed to manuscript revision, read, and approved the submitted version.
Funding
The major science and technology project of PetroChina Co., Ltd. “Research and Application of Key Technologies for Deep & Ultra-Deep Gas Field Development in Kuqa Depression” (No. 2018E-1803).
Conflict of interest
TJ was employed by the Science and Technology Management Department of China National Petroleum Corporation. XX, SZ, and YT were employed by the PetroChina Tarim Oilfield Company. WO was employed by the Changqing Downhole Technology Company, CNPC Chuanqing Drilling Engineering Co., Ltd.
The remaining author declares that the research was conducted in the absence of any commercial or financial relationships that could be construed as a potential conflict of interest.
Publisher’s note
All claims expressed in this article are solely those of the authors and do not necessarily represent those of their affiliated organizations, or those of the publisher, the editors and the reviewers. Any product that may be evaluated in this article, or claim that may be made by its manufacturer, is not guaranteed or endorsed by the publisher.
References
Barenblatt, G. I., Zhrltov Iu, P., and Kochina, I. N. (1960). Basic concepts in the theory of seepage of homogeneous liquids in fissured rocks[J]. PMM 24 (5), 852–864.
Chen, Z., Huan, G., and Ma, Y. (2006). Computational methods for multiphase flows in porous media[M]. Philadelphia: Society for Industrial and Applied Mathematics.
Dean, R. H., and Lo, L. L. (1988). Simulations of naturally fractured reservoirs. SPE Reserv. Eng. 3 (2), 638–648. doi:10.2118/14110-pa
Flemisch, B., Berre, I., Boon, W., Fumagalli, A., Schwenck, N., Scotti, A., et al. (2017). Benchmarks for single-phase flow in fractured porous media. Adv. Water Resour. 111, 239–258. doi:10.1016/j.advwatres.2017.10.036
Jiang, T., Sun, H., Wang, H., et al. (2021). Reserves estimation for geopressured gas reservoirs [M]. Beijing: Petroleum Industry Press.
Jiang, T., and Sun, X. (2018). Development of Keshen ultra-deep and ultra-high pressure gas reservoirs in the Kuqa foreland basin, Tarim Basin: Understanding points and technical countermeasures[J]. Nat. Gas. Ind. 38 (6), 1–9.
Kazemi, H., and Gilman, J. R. (1993). Multiphase flow in fractured Petroleum reservoirs[G]. Flow and contaminant transport in fractured rock. Elsevier.
Kazemi, H. (1969). Pressure transient analysis of naturally fractured reservoirs with uniform fracture distribution. Soc. Petroleum Eng. J. 9 (4), 451–462. doi:10.2118/2156-a
Kong, X. (2020). Advanced seepage mechanics(third edition)[M]. Hefei, Anhui, China: University of Science and Technology of China Press.
Li, G., Tian, J., and Duan, X. (2022). Measures and practice for improving the recovery factor of ultradeep tight sandstone gas reservoirs: A case study of Kelasu gas field. Tarim. Basin[J]. Nat. Gas. Ind. 42 (1), 93–101.
Liu, C. (1981). Exact solution for the compressible flow equations through a medium with triple-porosity[J]. Appl. Math. Mech. 2 (4), 457–462.
Liu, C. (1983). Exact solution of unsteady axisymmetrical two-dimensional flow through triple porous media[J]. Appl. Math. Mech. 4 (5), 717–724.
Li, Y., Shang, Y., and Yang, P. (2018). Modeling fracture connectivity in naturally fractured reservoirs: A case study in the yanchang formation, ordos basin, China[J]. Fuel 211, 789–796.
Mattar, L., and Santo, M. (1992). How wellbore dtnamics affect pressure transient analysis[J]. JCPT 31 (1), 32–40.
Qi, X., Liu, S., Yu, Z., Sun, H., Chang, B., Luo, Z., et al. (2021). Interfacial dynamics of gas–water displacement in fractured porous media under high pressure. Phys. Fluids 33, 092003. doi:10.1063/5.0062141
Rueda Cordero, J. A., Mejia Sanchez, E. C., and Roehl, D. (2018). Integrated discrete fracture and dual porosity - dual permeability models for fluid flow in deformable fractured media. J. Petroleum Sci. Eng. 175, 644–653. doi:10.1016/j.petrol.2018.12.053
Shen, W., Ma, T., Li, X., Sun, B., Hu, Y., Xu, J., et al. (2022). Fully coupled modeling of two-phase fluid flow and geomechanics in ultra-deep natural gas reservoirs. Phys. Fluids 34, 043101. doi:10.1063/5.0084975
Sun, H., Ouyang, W., Wan, Y., Zhu, S., and Tang, Y. (2022). Discrete fracture network well test analysis for naturally fractured tight sandstone gas reservoir[J]. Nat. Gas. Ind. 42 (7), 56–66.
Tarhuni, M. N., Sulaiman, W. R., Jaafar, M. Z., Milad, M., and Alghol, A. M. (2021). A review of the dynamic modeling approaches for characterizing fluid flow in naturally fractured reservoirs[J]. Energy Eng. 118 (4), 761–795.
Wan, Y., Liu, Y., Liu, W., Han, G., and Niu, C. (2016). A numerical approach for pressure transient analysis of a vertical well with complex fractures. Acta Mech. Sin. 32 (4), 640–648. doi:10.1007/s10409-016-0568-0
Wang, F., Zeng, F., Lu, W., Hou, X., Cheng, H., Gao, J., et al. (2021). Fractal analysis of tight sandstone petrophysical properties in unconventional oil reservoirs with NMR and rate-controlled porosimetry. Energy fuels. 35 (5), 3753–3765. doi:10.1021/acs.energyfuels.0c03394
Wang, Z., Sun, X., and Xiao, X. (2018). Efficient development technologies for ultradeep, overpressured and fractured sandstone gas reservoirs: A cased study of the Kelasu gas field in the Tarim Basin[J]. Nat. Gas. Ind. 38 (4), 87–95.
Warren, J. E., and Root, P. J. (1963). The behavior of naturally fractured reservoirs. Soc. Petroleum Eng. J. 3 (3), 245–255. doi:10.2118/426-pa
Wei, C., Zhang, C., and Dong, C. (2019). Seepage characteristics and development mechanism characterized by faults-fracture-pores"triple medium"in Keshen 2 gas reservoirs, Tarim Basin[J]. Nat. Gas. Geosci. 30 (12), 1684–1693.
Wei, G., Wang, J., Zeng, L., Tang, Y., Wang, Ke, Liu, T., et al. (2020). Structural reworking effects and new exploration discoveries of subsalt ultra-deep reservoirs in the Kelasu tectonic zone[J]. Nat. Gas. Ind. 40 (1), 20–30.
Wu, Y., Cheng, L., Huang, S., Fang, S., Jia, P., and Wang, S. (2018). A semianalytical model for simulating fluid flow in naturally fractured reservoirs with nonhomogeneous vugs and fractures. SPE J. 24 (1), 334–348. doi:10.2118/194023-pa
Wu, Y., Liu, H., and Bodvarsson, G. S. (2004). A triple-continuum approach for modeling flow and transport processes in fractured rock. J. Contam. Hydrology 73 (1), 145–179. doi:10.1016/j.jconhyd.2004.01.002
Zambrano, M., Tondi, E., Korneva, I., Panza, E., Agosta, F., Janiseck, J. M., et al. (2016). Fracture properties analysis and discrete fracture network modelling of faulted tight limestones, Murge Plateau, Italy. Italian J. Geosciences 135 (1), 55–67. doi:10.3301/ijg.2014.42
Zeng, F., Zhao, G., and Liu, H. (2012). A new model for reservoirs with a discrete-fracture system. J. Can. Petroleum Technol. 51 (2), 127–136. doi:10.2118/150627-pa
Zhang, F., and Emami-Meybodi, H. (2020). A semianalytical method for two-phase flowback rate-transient analysis in shale gas reservoirs[J]. SPE J. 25 (4), 1599–1622.
Keywords: discrete fracture network model, multi-scale, flow mechanism, water invasion, dynamic description, fractured gas reservoir
Citation: Jiang T, Sun H, Xiao X, Zhu S, Ouyang W and Tang Y (2022) Multi-scale flow mechanism and water control strategy of ultra-deep multi-porosity fractured tight sandstone gas reservoirs. Front. Energy Res. 10:977439. doi: 10.3389/fenrg.2022.977439
Received: 24 June 2022; Accepted: 11 July 2022;
Published: 10 August 2022.
Edited by:
Fuyong Wang, China University of Petroleum, ChinaReviewed by:
Weijun Shen, Institute of Mechanics (CAS), ChinaFengyuan Zhang, China University of Petroleum, China
Mingqiang Wei, Southwest Petroleum University, China
Copyright © 2022 Jiang, Sun, Xiao, Zhu, Ouyang and Tang. This is an open-access article distributed under the terms of the Creative Commons Attribution License (CC BY). The use, distribution or reproduction in other forums is permitted, provided the original author(s) and the copyright owner(s) are credited and that the original publication in this journal is cited, in accordance with accepted academic practice. No use, distribution or reproduction is permitted which does not comply with these terms.
*Correspondence: Hedong Sun, c3VuaGVkQHBldHJvY2hpbmEuY29tLmNu