 Zhaobo Sun
 Yingxian Liu2
 Yue Gao
- 1CNOOC International Limited, Beijing, China
- 2Tianjin Branch of CNOOC Ltd., Tianjin, China
- 3School of Petroleum Engineering, China University of Petroleum (East China), Qingdao, China
The results of core displacement experiments show that increasing the water drive velocity when it is bigger than the limit value can effectively reduce the residual oil saturation and improve the oil displacement efficiency under the same PV. However, the existing commercial simulators (Eclipse, CMG et al.) cannot simulate the effect of water velocity on the relative permeability curve in the process of numerical simulation.
In this article, capillary number (Ca), defined as the dimensionless ratio of viscous force to capillary force, is used to characterize the relationship between water drive velocity and residual oil. Second, a new Boltzmann (BG) equation is proposed to match the nonlinear relationship between Ca and residual oil. The BG equation is a continuous function, which is very beneficial to the stability of numerical calculation. Finally, a new reservoir numerical simulator is established which captures the dynamic variation of residual oil saturation with water drive velocity in a water flooding reservoir based on the black oil model. The new simulator was verified by comparing it with the commercial reservoir simulator ECLIPSE and experimental data. The simulation results show that compared with the common model, the model considering the dynamic variation of residual oil saturation with water drive velocity reduced the residual oil saturation near the main flow line after enhanced injection rate. The oil phase flow capacity in the model is enhanced, the water cut is decreased, and the oil recovery rate is higher. The history matching of the S oilfield in Bohai Bay is achieved with the new simulator, and the history matching accuracy is obviously higher than that of Eclipse. The findings of this study can help with a better understanding of the distribution law and flow law of remaining oil in the high water cut stage of the reservoir and have good theory and application value for water flooding offshore oilfields.
Introduction
Deeply understanding the seepage law of oil, gas, and water in reservoir porous media and the time-varying law of rock porous is the basis for improving the accuracy of reservoir numerical simulators, which has been widely studied by scholars in recent years (Xu et al., 2012; Jiang et al., 2018; Shen et al., 2019; Sun et al., 2019; Rios et al., 2020; Qiao, 2021).
Cui and Ma (Cui et al., 2014; Ma et al., 2019) found through experiments that long-term water flooding will lead to the change of the pore throat structure of an unconsolidated sandstone reservoir and promote the formation of large pores. Zhang et al. (1997) found that with the progress of water injection development, the pore throat dimensions, relative permeability, and wettability of rocks have changed. Xu et al. (2015) and Xu et al. (2016) carried out experimental research on the change of relative permeability after waterflooding. He found that long-term waterflooding will reduce the residual oil saturation, increase the irreducible water saturation, increase the relative permeability of the water phase under the residual oil saturation, and move the iso-osmotic point to the right. Ju et al.’s (2005) research shows that in the process of oilfield water drive development, with the increase of water cut, the content of light components in crude oil decreases, resulting in the increase of crude oil viscosity to three times the initial state. Based on the microscopic grid and numerical simulation technology, Hou et al. (2016) proposed a new simulation method, which can consider the changes of porosity, permeability, and relative permeability with time in the process of water drive. A comprehensive reservoir simulation technique based on time-varying petro-physical parameters characterized by effective displacement flux was proposed by Zhao et al. (2022).
The water cut of the oil field has been rising after a long period of water flooding development. Enhancing liquid for oil increment is an effective way to sustain stable production and improve recovery factors in the mid-late life of reservoirs developed by water flooding (Feng et al., 2013; Liu et al., 2017; Sun et al., 2020). Many scholars have found that increasing the displacement pressure difference can improve the oil displacement efficiency through microscopic displacement experiments by CT and microfluidic technology (Zhang et al., 2017; Zhu et al., 2017; Liu et al., 2021; Tan et al., 2022). After long-term water flooding, most of the remaining oil in the rock pore space exists in five forms such as cluster-shaped, pore surface film-like, slit-like, cube corner-shaped, and intergranular adsorption-like (Li et al., 2014; Gao et al., 2020). Without changing the water drive velocity, it is difficult to drive the residual oil by high PV displacement alone, but as the water drive velocity increases, the residual oil keeps decreasing and is driven out by water (Li et al., 2006). In addition, the results of core displacement experiments show that increasing the water drive velocity when it is bigger than a limit value can effectively reduce the residual oil saturation and improve the oil displacement efficiency under the same PV (Ji et al., 2012).
However, all commercial reservoir numerical simulators (Eclipse, CMG et al.) do not consider the mechanism that the increase in water drive velocity leads to the decrease of residual oil (Ning et al., 2019). Therefore, reservoir numerical simulators frequently encounter the problem of large errors in history matching, especially in the mid-late life of reservoirs developed. This study aims to propose a novel method to characterize the mechanism of the dynamic variation of residual oil with water drive velocity. In this article, we propose a new BG equation to match the variation of residual oil saturation with the Ca, and then develop a new numerical simulator. In addition, compared with the Eclipse, we analyzed the differences in the distribution of residual oil saturation and oil saturation in the numerical model under different liquid production rates and further presented how the new method contributes to accurate history matching in S Oilfield.
Matching of experimental results and BG equations
In order to explain the mechanism of the phenomenon, increasing the water drive velocity when it is bigger than the limit value can effectively reduce the residual oil saturation and improve the oil displacement efficiency under the same PV. We introduce the Ca as shown in Eq. 1, which is defined as the ratio of viscous force to capillary force. Changing the displacement conditions, such as increasing the water drive velocity, can effectively increase the Ca, which is conducive to increasing the contribution of the viscous force of the injected water in the displacement process.
In order to better quantitatively describe the variation law of residual oil saturation with the water drive velocity, we have drawn the variation curve of residual oil and Ca, as shown in Figure 1. When the Ca is small (Ca<1.51 × 10⁻⁶ in Figure 1), there is little change in residual oil saturation, which is a repellent region dominated by capillary forces. As the value of the Ca increases, an inflection point appears in Figure 1, which indicates the transition from a predominantly capillary force to a predominantly viscous force. This transition zone occurs when Ca is in the range of 1.51 × 10⁻⁶∼5.48 × 10⁻⁶. In this transition zone, the residual oil saturation decreases rapidly with the increase of Ca. However, when the Ca is large (Ca > 5.48 × 10⁻⁶ in Figure 1), the residual oil saturation in the rock has been reduced to the limit value and cannot be further reduced, and increasing the water drive velocity cannot further change the residual oil saturation.
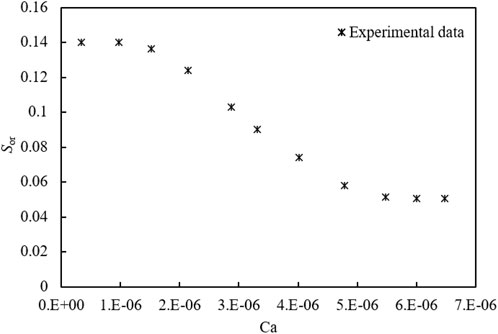
FIGURE 1. Variation curve of residual oil and Ca (WROC).
In order to show more precisely the relationship between the Ca and the residual oil saturation, the residual oil saturation decreases nonlinearly with the increase of the Ca. A new nonlinear equation (BG equation) is proposed in this article, as shown in Eq. 2. The functional schematic of the BG equation is shown in Figure 2.
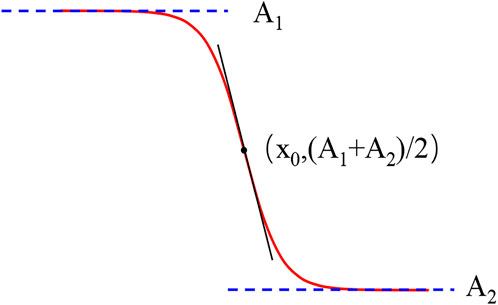
FIGURE 2. Schematic diagram of BG equation.
From the variation of Eq. 2, we obtain Eq. 3, which is the matching equation of residual oil saturation and the Ca.
In the curve matching process,
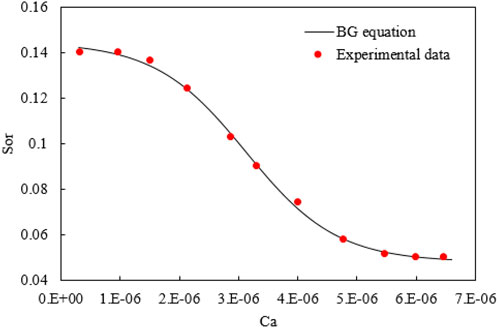
FIGURE 3. Curve of experimental data matching.
After obtaining the residual oil saturation under different Ca according to Eq. 3, the oil–water relative permeability curve under different Ca can be calculated according to Eqs 4–6, as shown in Figure 4.
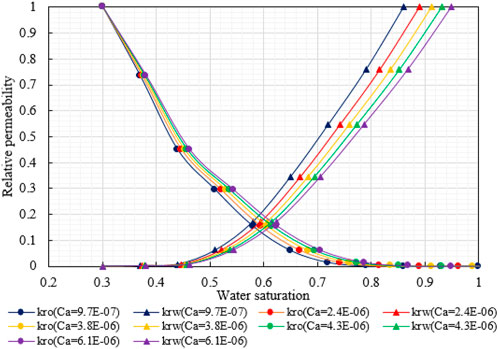
FIGURE 4. Relative permeability curves for different Ca.
Simulator development
Methodology
Seepage equation
Oil phase:
Water phase:
Gas phase:
Auxiliary equation
Initial condition
Initial pressure:
Initial saturation:
Outer boundary condition
Inner boundary condition
Constant production rate:
Constant bottom hole flowing pressure:
The mathematical model is differentially discretized using the finite difference method to establish a fully implicit numerical model of the oil, gas, and water phases with the following procedure:
Workflow of the newly developed simulator
Based on the established mathematical model, a new simulator is developed. The workflow of the overall solution procedure and the calculation of parameters are shown in Figure 5. At the end of each time step, the Ca of each grid is calculated. Then, the residual oil saturation of each grid is calculated by the BG equation, a new relative permeability curve is recalculated, and finally, the conductivity of each grid is corrected. The code of the framework is programmed in Fortran 90.
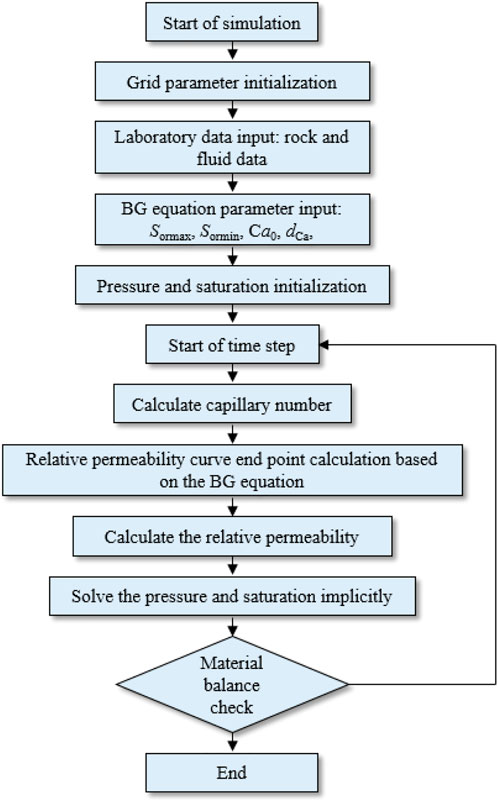
FIGURE 5. Workflow of the newly developed simulator.
Simulator validation
In order to verify the accuracy of the new simulator, a conceptual numerical model was established using the basic parameters of the S reservoir in Bohai Bay, which are shown in Table 1. The water injection rate of the water injection well is 400 m3/d, and the daily fluid production rate of the oil production well is 400 m3/d. The simulation lasted for 40 years. In the verification stage, the new simulator developed in this article did not consider the change in residual oil saturation with the Ca. Finally, the simulation results were compared with those of the commercial simulator (Eclipse).
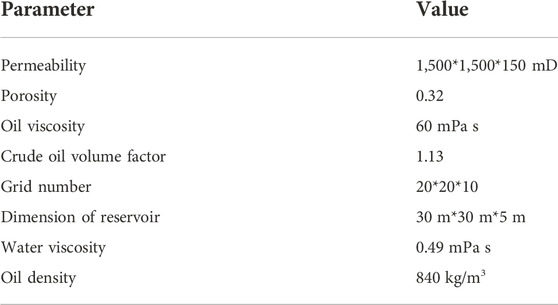
TABLE 1. Basic parameters of the conceptual model.
In Figure 6, the new simulator (without considering the residual oil variation) is in full agreement with the simulation results of Eclipse, and the error is controlled within 0.2%. Therefore, the new simulator is accurate and effective.
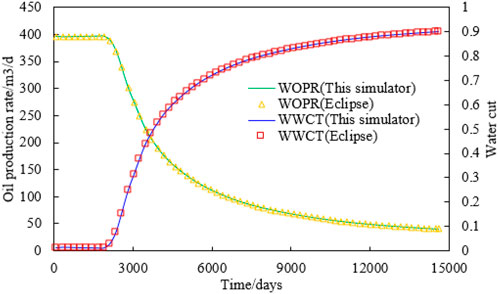
FIGURE 6. Simulation results of the new simulator and Eclipse.
Results and discussion
To study the effect of different water velocities on the oil saturation distribution of the numerical model, the water injection rate of the injection well increased from 800 m3/d to three times the original rate to 2,400 m3/d at 7,500 days of the simulation, and the oil well also increased the fluid production rate according to the principle of balance between injection and production, as shown in Figure 7.
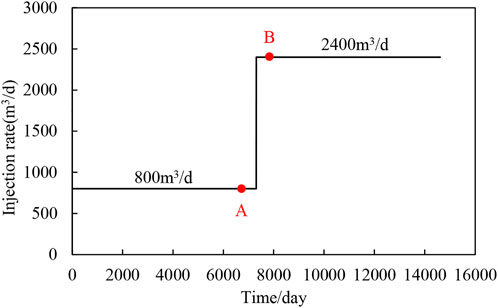
FIGURE 7. Schematic diagram of enhanced liquid production setting.
The numerical simulation results of the new simulator and Eclipse were compared in 3D Grid, and the basic parameters of the reservoir numerical model are exactly the same. The residual oil saturation of the reservoir model was intercepted at the time A (before enhanced liquid production) and at the time B (after enhanced liquid production) as shown in Figure 8. As shown in Figures 8A and B, Eclipse cannot realize the change in residual oil saturation, so its residual oil saturation is unchanged after enhanced liquid production. In Figures 8C and D, the new simulator considers the dynamic change of residual oil saturation with water drive velocity. Before enhanced liquid production, the water drive velocity can only change the residual oil saturation of the grid near the well, as shown in Figure 8C. After enhanced liquid production, the residual oil saturation of the grid near the main flow line decreases under the effect of high-speed flushing of the injected water, as shown in Figure 8D. Furthermore, the decrease in residual oil saturation also improves the displacement efficiency, and that is why the oil saturation near the injection well in Figure 9A is much lower than that in Figure 9B because more oil can be displaced by the high-speed injected water.
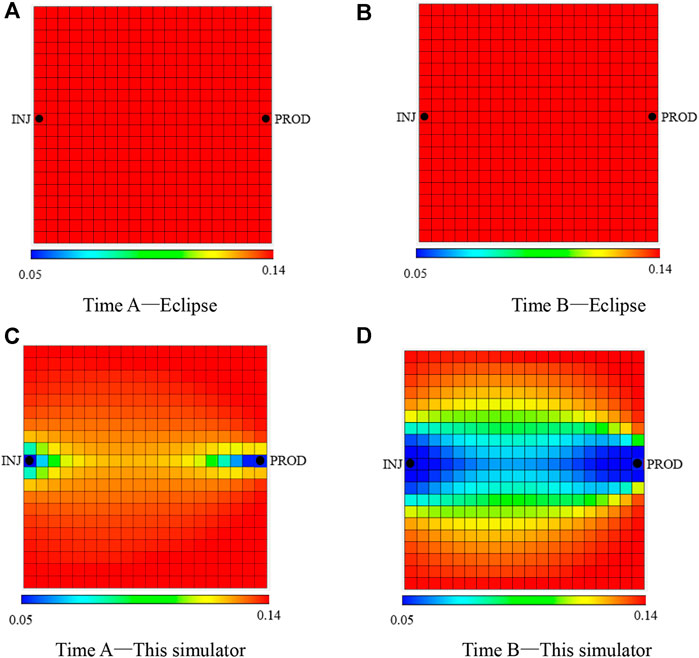
FIGURE 8. Residual oil saturation.
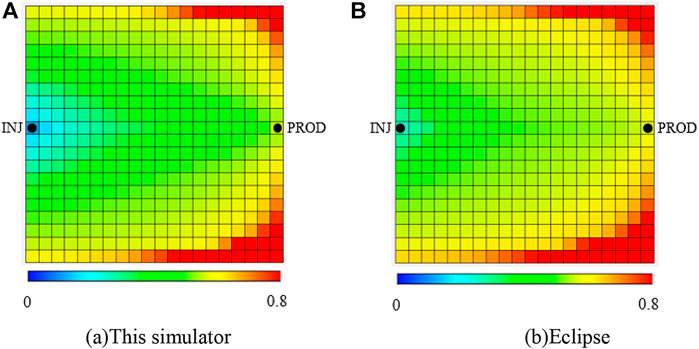
FIGURE 9. Oil saturation at the end of development.
Before enhanced liquid production, the water drive velocity of most grids in the model is low and has not reached the limit that can change the residual oil. Therefore, the oil production rate and water cut of the new simulator did not differ significantly from the Eclipse, as shown in Figure 10. After enhanced liquid production, as shown in Figure 11. The water cut of the new simulator decreases and forms a concave after enhanced liquid production. The reason for the abovementioned phenomenon is that the new simulator considers the influence of water drive velocity on residual oil saturation. After enhanced liquid production, the water drive velocity of the model increases, and more oil is displaced by water.
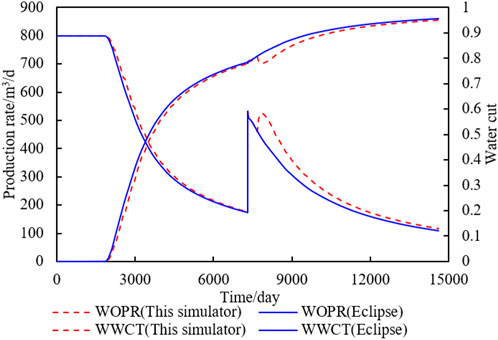
FIGURE 10. Comparison curves of oil production rate and water cut of different simulators.
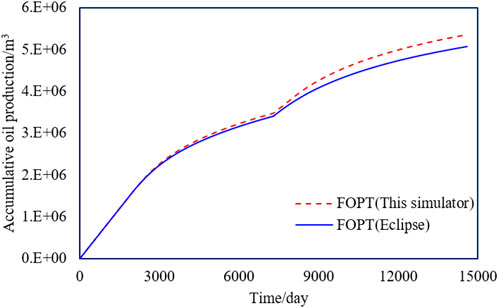
FIGURE 11. Comparison curve of cumulative oil production of different simulators.
Field application
The S oilfield is located in Bohai Bay, China. The porosity is mainly distributed between 27.0 and 35.8%, with an average of 32.0% and a median of 32.6%. The permeability ranges from 100.0 mD to 12,000.0 mD, with an average of 2,815.0 mD and a median of 2,195.0 mD. It is an extra-high porosity, extra-high permeability reservoir. After two well network encryptions and multiple rounds of fluid extraction in the reservoir, the tracer test data indicate that the water drive rate has reached 2–3 times that of the initial development stage, entering the stage of high water cut and high fluid production.
The new simulator is applied to the S oilfield to verify if the realization of the dynamic variation of residual oil with water drive velocity will get better simulation results. The parameters of the BG equation in the new simulator were optimized with reference to the results of the core displacement experiments in the S reservoir. Eclipse and the new simulator are used for the history match of the S reservoir numerical model, respectively, where the model parameters in both simulators were the same except that the new simulator considered the mechanism of residual oil variation with water drive velocity. As shown in Figure 12, in the early stage of development, the water drive velocity is small, and the results of both simulators are similar; in the later stages of development, the large water drive velocity leads to residual oil decline, so the water cut of the new simulator is more consistent with the historical data, while the water cut of the Eclipse is significantly higher than the historical data. In summary, compared with the traditional numerical simulator (Eclipse), the new simulator has a higher accuracy of historical matching, and the simulation results are more compounded with the actual situation. The overall accuracy of historical matching is improved by 24% compared with Eclipse.
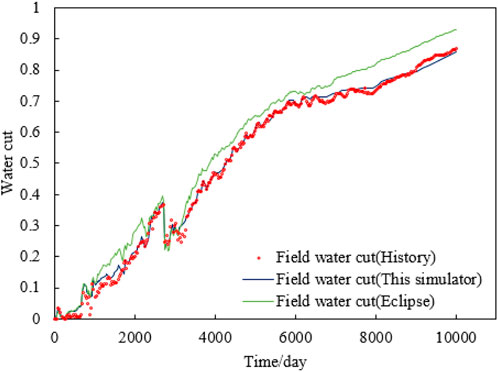
FIGURE 12. Historical matching comparison curve of water cut.
Summary and conclusion
For waterflooding reservoirs, increasing water drive velocity can significantly reduce residual oil saturation. This mechanism of dynamic variation of residual oil saturation with water drive velocity will significantly impact the fluid flow in the reservoir and the development performance of the oilfield. However, all commercial reservoir numerical simulators (Eclipse, CMG et al.) have not considered this mechanism. In this article, a novel method based on the Ca and BG equation is proposed to describe the nonlinear variation of residual oil with water drive velocity. A new reservoir numerical simulator is developed and validated against Eclipse. Compared to the existing studies, the new study simulates the effect of water velocity on the relative permeability curve in the process of numerical simulation for the first time. The novel method and new reservoir numerical simulator are implemented for the history matching of S oilfield, and the new simulator has a higher accuracy of historical matching which is improved by 24% compared with Eclipse.
Data availability statement
The raw data supporting the conclusion of this article will be made available by the authors, without undue reservation.
Author contributions
Study conception and design: ZS; methodology: ZS and MK; experimental and data collection: HC; simulation study: ZS, YG; analysis of results: ZS; writing the manuscript: All authors. All authors reviewed the results and approved the final version of the manuscript.
Funding
This research was funded by the Major Scientific and Technological Projects of CNOOC (Grant numbers: KJGG 2022-0904).
Conflict of interest
ZS was employed by the company CNOOC International Limited; YL, HC, and YG were employed by the Tianjin Branch of CNOOC Ltd; RJ was employed by the China University of Petroleum (East China).
The remaining author declares that the research was conducted in the absence of any commercial or financial relationships that could be construed as a potential conflict of interest.
Publisher’s note
All claims expressed in this article are solely those of the authors and do not necessarily represent those of their affiliated organizations, or those of the publisher, the editors, and the reviewers. Any product that may be evaluated in this article, or claim that may be made by its manufacturer, is not guaranteed or endorsed by the publisher.
References
Cui, C., Li, K., Yang, Y., Huang, Y., and Cao, Q. (2014). Identification and quantitative description of large pore path in unconsolidated sandstone reservoir during the ultra-high water-cut stage. J. Petroleum Sci. Eng. 122, 10–17. doi:10.1016/j.petrol.2014.08.009
Feng, Q., Wang, S., and Bai, J. (2013). Numerical simulation of development effect of enhanced liquid production in heterogeneous reservoirs. Petroleum Geol. Recovery Effic. 20 (3), 49–52. doi:10.13673/j.cnki.cn37-1359/te.2013.03.014
Gao, W., Li, Y., He, S., Pan, D., Liu, M., and Guan, C. (2020). Classification method of occurrence mode of remaining oil based on fluorescence thin sections. Acta Pet. Sin. 41 (11), 1406–1415. doi:10.7623/syxb202011010
Hou, J., Zhang, Y., Wang, D., and Zhou, K. (2016). Numerical simulation of reservoir parameters’ synergetic time-variability on development rules. J. Pet. Explor. Prod. Technol. 6 (4), 641–652. doi:10.1007/s13202-015-0208-4
Ji, S., Tian, C., Shi, C., Ye, J., Zhang, Z., and Fu, X. (2012). New understanding on water-oil displacement efficiency in a high water-cut stage. Petroleum Explor. Dev. 39 (3), 362–370. doi:10.1016/s1876-3804(12)60052-4
Jiang, R., Zhang, W., Zhao, P., Jiang, Y., Cai, M., Tao, Z., et al. (2018). Characterization of the reservoir property time-variation based on 'surface flux' and simulator development. Fuel 234 (15), 924–933. doi:10.1016/j.fuel.2018.06.136
Ju, B., Fan, T., and Zhang, J. (2005). Oil viscosity variation and its effects on production performance in water drive reservoir. Pet. Explor 33 (1), 99–102.
Li, Y. Q., Li, J., Ding, S., and Sun, X. (2014). Characterization of remaining oil after polymer flooding by laser scanning confocal fluorescence microscopy. J. Dispersion Sci. Technol. 35 (7), 898–906. doi:10.1080/01932691.2013.802243
Li, Z., He, S., Yang, W., and Men, C. (2006). Physical simulation experiment of water driving by micro-model and fractal features of residual oil distribution. J. China Univ. Petroleum(Edition Nat. Sci. 3, 67–71.
Liu, C., Zhang, J., Zhou, W., and Wang, K. (2017). Dynamic calculation method for liquid production increase potential of offshore oilfield at high water cut stage. Petroleum Geol. Recovery Effic. 24 (4), 110–115. doi:10.13673/j.cnki.cn37-1359/te.2017.04.009
Liu, X., Ren, D., Dong, F., Nan, J., and Zhou, R. (2021). Quantitative study of residual oil distribution during water flooding through digital core analysis. Geofluids 1, 1–8. doi:10.1155/2021/6619440
Ma, K., Cai, H., and Sun, Z. (2019). Nuclear magnetic resonance-based experiment on the effects of displacement velocity and multiple on the pore throat characteristics and recovery factor of unconsolidated sandstone reservoirs. China Offshore Oil Gas 6, 86–91.
Ning, Y., Zhang, K., He, S., Chen, T., Wang, H., and Qin, G. (2019). Numerical modeling of gas transport in shales to estimate rock and fluid properties based on multiscale digital rocks. Energy Procedia 158, 6093–6098. doi:10.1016/j.egypro.2019.01.505
Qiao, X. (2021). Status analysis and development of reservoir numerical simulation technology. IOP Conf. Ser. Earth Environ. Sci. 631 (1), 012052. doi:10.1088/1755-1315/631/1/012052
Rios, V. S., Avansi, G. D., and Schiozer, D. J. (2020). Practical workflow to improve numerical performance in time-consuming reservoir simulation models using submodels and shorter period of time. J. Petroleum Sci. Eng. 195, 107547. doi:10.1016/j.petrol.2020.107547
Shen, L., Cui, T., Liu, H., Zhu, Z., Zhong, H., Chen, Z., et al. (2019). “Numerical simulation of two-phase flow in naturally fractured reservoirs using dual porosity method on parallel computers: Numerical simulation of two-phase flow in naturally fractured reservoirs,” in Proceeding International Conference on High Performance Computing in Asia-Pacific Region, New York, 14 January 2019 (Guangzhou, Peoples R China: Acm), 91–100. doi:10.1145/3293320.3293322
Sun, K., Liu, H., Wang, Y., Ge, L., Gao, J., and Du, W. (2020). Novel method for inverted five-spot reservoir simulation at high water-cut stage based on time-varying relative permeability curves. ACS Omega 5 (7), 13312–13323. doi:10.1021/acsomega.0c01388
Sun, Z., Li, Y., Ma, K., Xu, J., Zhang, G., Jiang, R., et al. (2019). “A novel method to characterise time-variation of reservoir properties: Experimental study, simulator development and its application in Bohai Bay oilfield,” in Proceeding SPE/IATMI Asia Pacific Oil & Gas Conference and Exhibition, Bali, Indonesia, October 29–31, 2019. Bali, Indonesia: society of petroleum engineers). doi:10.2118/196261-MS
Tan, J., Cai, H., Li, Y. L., Liu, C., Miao, F., and Liu, C. (2022). Physical simulation of residual oil displacement production in offshore strong bottom water reservoir. J. Pet. Explor. Prod. Technol. 12, 521–546. doi:10.1007/s13202-021-01297-w
Xu, J., Guo, C., Jiang, R., and Wei, M. (2016). Study on relative permeability characteristics affected by displacement pressure gradient: Experimental study and numerical simulation. Fuel 163, 314–323. doi:10.1016/j.fuel.2015.09.049
Xu, J., Guo, C., Wei, M., and Jiang, R. (2015). Impact of parameters׳ time variation on waterflooding reservoir performance. J. Petroleum Sci. Eng. 126, 181–189. doi:10.1016/j.petrol.2014.11.032
Xu, X., Tian, S., Xu, T., Xu, T., and Su, Y. (2012)., The equivalent numerical simulation of fractured-vuggy carbonate reservoirAppl. Mech. Mater. Trans Tech Publications Ltd. 110. , 3327–3331. doi:10.4028/www.scientific.net/AMM.110-116.3327
Zhang, H., Liu, Q., Li, F., and Lu, Y. (1997). Variations of petrophysical parameters after sandstone reservoirs watered out in Daqing oilfield. SPE Adv. Technol. Ser. 5 (1), 128–139. doi:10.2118/30844-pa
Zhang, X., Zhao, L., Wang, J., Chen, L., and Yue, X. (2017). “Residual oil distribution of heterogeneous reservoir at different water drive velocity,” in Proceedings of the International Field Exploration and Development Conference, Singapore, 12 July 2018 (Springer), 326–332. doi:10.1007/978-981-10-7562-5-29
Zhao, P., Shen, Z., Cai, M., Zhang, J., Jiang, R., Zhao, M., et al. (2022). A comprehensive reservoir simulation technique based on time-varying petro-physical parameters characterized by effective displacement flux. J. China Univ. Petroleum(Edition Nat. Sci. 46 (1), 89–96.
Zhu, G., Yao, J., Zhang, L., Sun, H., and Zhang, K. (2017). Pore-scale investigation of residual oil distributions and formation mechanisms at the extra-high water-cut stage. Chin. Sci. Bull. 62 (22), 2553–2563. doi:10.1360/n972017-00392
Nomenclature
n time steps
xw, yw, zw location coordinates of the well
u number of iterations
Vb mesh block volume
δ The difference between the u+1 and u parameter iterations at the n+1 time step.
Keywords: numerical simulation, water flooding reservoirs, capillary number, relative permeability, residual oil
Citation: Sun Z, Liu Y, Cai H, Gao Y and Jiang R (2023) The numerical simulation study on the dynamic variation of residual oil with water drive velocity in water flooding reservoir. Front. Energy Res. 10:977109. doi: 10.3389/fenrg.2022.977109
Received: 24 June 2022; Accepted: 29 August 2022;
Published: 06 January 2023.
Edited by:
Xiukun Wang, China University of Petroleum, ChinaReviewed by:
Shuyang Liu, China University of Petroleum (East China), ChinaJunrong Liu, China University of Petroleum, China
Copyright © 2023 Sun, Liu, Cai, Gao and Jiang. This is an open-access article distributed under the terms of the Creative Commons Attribution License (CC BY). The use, distribution or reproduction in other forums is permitted, provided the original author(s) and the copyright owner(s) are credited and that the original publication in this journal is cited, in accordance with accepted academic practice. No use, distribution or reproduction is permitted which does not comply with these terms.
*Correspondence: Zhaobo Sun, eGlzb3ZlckAxMjYuY29t