 Ping Shao
 Zhile Yang
 Yuanjun Guo
 Shihao Zhao1
- 1Zhengzhou University, School of Electrical Engineering, Zhengzhou, China
- 2Shenzhen Institute of Advanced Technology, Chinese Academy of Sciences, Shenzhen, Guangdong, China
Due to the considerable number of electric vehicles and the characteristics of energy storage, it is possible for these new energy factors to participate in the operation and regulation of the power system and provide reserve service. In view of this, a multi-objective optimal scheduling model is established, aiming at the economic benefits of electricity collectors, the microgrid power fluctuations, and user satisfaction. Among them, the expression paradigm of user satisfaction is proposed. At the same time, an improved adaptive non-dominated sorting genetic algorithm (NSGA-III-W) was proposed to solve the problem of large-scale and high-dimensional multi-objective in the model. First, an adaptive T-crossover operator is proposed to increase the search and optimization capability of NSGA-III. Second, an adaptive crossover mutation mechanism is proposed to improve the convergence performance of the algorithm. In addition, a compromise solution is selected from the obtained Pareto-dominated solutions through the distance ranking method of superior and inferior solutions (TOPSIS). The improved NSGA-III algorithm, namely the NSGA-III-W algorithm, is compared with the mainstream intelligent optimization algorithms non-dominated sorting genetic algorithm II (NSGA-II) and decomposition-based multi-objective evolutionary algorithm (MOEA\D), and the simulation results demonstrate the feasibility of the proposed model and the effectiveness of the proposed algorithm.
1 Introduction
In response to the threat of climate change, China announced targets for peaking carbon dioxide emissions and carbon neutrality by 2030 and 2060 (Han et al., 2022), respectively. China’s “14th Five-Year Plan” further proposes that during the “14th Five-Year Plan” period, carbon dioxide emissions per unit of GDP should be reduced by 18%, and by 2025, the proportion of non-fossil energy in total energy consumption will increase to about 20% (Gong et al., 2022). From the perspective of the power system (Zhao et al., 2022), the construction of a new power system with new energy sectors as the main body has become the development form of energy power in the future, and the high proportion of new energy integration brought new challenges to the flexible operation of the power system (Huang et al., 2020). At the same time, electric vehicles (Flah et al., 2021; Mohamed et al., 2022) have received strong support from different countries and governments for their use of cleaner energy, lower maintenance costs, and higher energy efficiency (Li and Hu, 2021). The rapid and large-scale development of electric vehicles provides new solutions to the aforementioned challenge. Batteries in electric vehicles can respond quickly to signals and most sit idle for the majority of a day, which becomes a realistic condition and favorable factor for the regulation and dispatch of electric vehicles (Cheng et al., 2021). Electric vehicles have the characteristics of both adjustable load and energy storage, so they can not only draw electricity from the power system (Cheng and Yu, 2019) but also be used to implement the vehicle to grid (V2G) function (Kempton and Letendre, 1997), which can involve in the grid as energy storage to provide auxiliary reserve services (Pavić et al., 2017; Barcellona et al., 2019; Ghosh, 2020) for the grid. However, the disorderly charging and discharging of a large number of electric vehicles may increase the operating stress of the existing grid (Singh and Tiwari, 2020), lead to an increase in peak loads, losses, and voltage violations in the distribution system (Clement-Nyns et al., 2009), and even cause the power distribution system to collapse (Shafiee et al., 2013). If the electricity in the non-use phase of electric vehicles is sold to the power grid as a credible reserve capacity based on the needs and wishes of users to provide backup services for the power grid, it can effectively achieve the purpose of reducing the load fluctuation of the power grid (Wei et al., 2020), shaving peaks and filling valleys (Wang and Wang, 2013; Alam et al., 2014; Liang et al., 2018), and supplying power to the power grid as a backup power source.
At present, many research studies related to the optimization scheduling problem of electric vehicles participating in the power grid to provide auxiliary reserve services have been done. Sortomme and El-Sharkawi (2011 discussed optimal scheduling of V2G energy and ancillary services. Yue et al. (2019) studied a multi-market-driven microgrid energy schedule including distributed and centralized market participation, which closed the gap between the internal ancillary services market and external wholesale market. An evaluation method for large-scale PEV V2G capacity and a heuristic smart charging strategy is proposed by Zhang et al. (2016) to improve the ability of electric vehicles to provide power reserve. A multimarket optimization model is proposed by Gao et al. (2022) for minimizing the net operation cost of EV charging to determine optimal operation strategies of aggregations and the charging power of each individual EV. The aggregation model of electric vehicles based on the operating constraints of electric vehicles is studied by Sarker et al. (2018) and a scheme is proposed for electric vehicles to participate in grid scheduling to meet spinning reserve requirements to improve the stability and economy of the system. In the literature (DeForest et al., 2018), a model is proposed that optimizes daily EV charging and regulation capacity bids strategies to minimize operation costs and maximize ancillary service revenue. In the literature (Chen and Leung, 2019), aiming at the optimal social welfare V2G system and smoothing the power fluctuation of the power grid, a game theory method is proposed to motivate electric vehicles to provide frequency regulation services for the power grid. An optimization strategy to implement V2G features in a microgrid was presented by Mortaz et al. (2019); this model aimed to improve the EV’s benefits acting in the electricity market, taking advantage of the EV’s capabilities to exchange energy with the grid when arbitrarily requested by the electricity market. However, most of the aforementioned studies are oriented to the market economy (Cheng et al., 2022) and do not consider the willingness of users to participate in V2G, so the research models are difficult to apply in practice.
Multi-objective meta-heuristic optimizations provide a new thought to solve complex large-scale problems. At present, many multi-objective meta-heuristic algorithms, such as multi-objective particle swarm optimization (MOPSO) (Wang et al., 2021a), strength Pareto evolutionary algorithm (SPEA) (Zeynali et al., 2020), non-dominated sorting genetic algorithm II (NSGA-II) (Li et al., 2014; Wang et al., 2021b), multi-objective evolutionary algorithm based on decomposition (MOEA-D) (Qu et al., 2017), non-dominated sorting gravitational search algorithm (NSGSA) (Rashedi et al., 2018), and non-dominated sorting genetic algorithm III (NSGA-III) (Chacko and Sachidanandam, 2021; Li et al., 2022), have been applied to the optimization of electric vehicle charging and discharging and achieved good results. Das et al. (2020) proposed an augmented non-dominated ɛ-constraint (ANEC) algorithm to solve the multi-objective EV charging problem. A multi-objective evolutionary algorithm based on decomposition (MOEA/D) using the localized penalty-based boundary intersection (LPBI) method is proposed by Ming et al. (2017), denoted as MOEA/D-LPBI, designed to minimize hybrid renewable energy system (HRES) costs and fuel emissions in island and grid-connected modes and maximize system reliability. A multi-objective particle swarm optimization (MOPSO) algorithm and a fuzzy decision maker are put forward for the simultaneous optimization of grid operating cost, CO2 emissions, wind curtailment, and EV users’ cost by Liu et al. (2016). An improved particle swarm optimization algorithm is proposed by Lu et al. (2017) to solve the microgrid model considering the integration of electric vehicles into the power grid. Hou et al. (2020) adopted a multi-objective searcher optimization algorithm (MSOA) to optimize the multi-objective optimization model of electric vehicle charging and discharging, aiming at the comprehensive operation cost of the microgrid, photovoltaic energy utilization rate and power fluctuation between the microgrid and main grid. Morais et al. (2020) used a deterministic and elite non-dominated sorting genetic algorithm (NSGA-II) to solve EV scheduling problems, and the main goal is to minimize costs and greenhouse gas emissions. However, many studies are out of reality. With the increase of the research scale, the dimension of the optimization object and the complexity of the problem will increase exponentially. The ordinary heuristic algorithm can no longer satisfy the optimization scheduling problem. It is necessary to design improved optimization algorithms for specific problem models.
In the current literature, researchers mostly focus on economic factors when electric vehicles are used as energy storage to participate in power system scheduling and rarely take into account the willingness of vehicle owners and their satisfaction with the scheduling results. The selection of optimization methods is more inclined to heuristic algorithms; of course, there are also CPLEX solvers, which are often difficult to apply in real situations when the scale of the scheduling problem is increasing. As a bridge between the power grid and users, electricity collectors can more comprehensively analyze how to effectively use electric vehicles, a decentralized and controllable resource, to achieve a benign interaction between users and the power grid in the market environment. Therefore, from the perspective of electricity collectors, this study coordinates and dispatches electric vehicles in a certain area to participate in V2G to provide reserve services for the power grid. In addition to the economy of electricity collectors, the fluctuation of grid load and the satisfaction of users participating in vehicle–network interactions are also considered to establish a multi-objective optimization model, and an improved NSGA-III algorithm is designed to solve the proposed problem. According to the aforementioned expression, the main contributions of this study can be highlighted as follows:
1) A multi-objective optimal dispatch model based on the economy of electricity collectors, the microgrid power fluctuation, and user satisfaction is established for the situation in which electric vehicles participate in grid interaction and provide reserve services for the grid.
2) An adaptive T-crossover operator and an adaptive crossover mutation mechanism are introduced into the NSGA-III algorithm to better solve the scheduling problem of the proposed model.
3) The improved NSGA-III algorithm and the proposed multi-objective optimization model are analyzed and validated in different vehicle scale scenarios. Experiments show that the proposed method can effectively achieve the effect of cutting peaks and filling valleys and promote the economic benefits of electricity collectors and the willingness of electric vehicle users to participate in V2G.
The rest of this study is distributed as follows: the second section mainly introduced the objective function and constraints of the proposed problem model. Section 3 introduced NSGA-III improvement strategies. The experimental results and analyses were presented in Section 4. Finally, the study was summarized in the fifth section.
2 Problem formulation
2.1 Data sources for trusted reserve capacity
Electric vehicles have the characteristics of adjustable load and energy storage and can quickly switch between charging and discharging states to provide an instantaneous response, which is an important potential backup measure on the demand side. The power of the electric vehicle is theoretically adjustable in two directions, and its reserve capacity can be divided into two types: upper reserve capacity and lower reserve capacity according to the adjustment direction. The current method for modeling the charging load of electric vehicles mainly assumes that the initial state of charge (SOC) of the user follows a certain normal distribution based on the private car travel data published in the United States, then, the travel and arrival time, mileage, and initial SOC samples of electric vehicles are plotted by the Monte Carlo method to calculate the daily charging load curve (Zheng et al., 2018; Calearo et al., 2019). The travel chain theory based on Markov stochastic processes can also be used to describe the spatiotemporal randomness of user travel behavior (Shun et al., 2016). However, the travel information of electric vehicle owners is affected by various factors such as the convenience of travel, user preferences, and economy, so the travel data of American households are not necessarily suitable for existing actual scenarios. To characterize the credible reserve capacity of electric vehicle users in each period, the problem model is designed based on the research of the literature (Wu et al., 2018): first, the knowledge extraction of the travel information of electric vehicle owners and their willingness to participate in V2G is carried out in the form of a questionnaire, and a multi-agent model that reflects the statistical distribution of the uncertainty of users’ willingness is constructed. Then, the collected electric vehicle travel data are analyzed, and the Monte Carlo method is used to sample the electric vehicle state parameters corresponding to the multi-agent individuals. Finally, the corresponding relationship between the influencing factors of user willingness and the status information of electric vehicles is constructed, and the willingness of users to participate in the interaction of the vehicle network is analyzed. This study extracts electric vehicle information of a certain scale and compares it with multi-agent individual psychological thresholds to classify electric vehicle users who are willing/unwilling to participate in regulation. It is assumed that the electric vehicle users determined by this method have reached their psychological threshold for participating in scheduling, and the decision-making information will not change until the next day. Taking the microgrid system of a community as an example, the upper and lower trusted reserve capacity of 200 electric vehicles is obtained according to the user decision model, where, the trusted reserve capacity is the upper and lower trusted reserve capacity that can be scheduled per hour based on the premise that the charging demand of electric vehicle users is met.
2.2 Objective function
In this study, a multi-objective optimization model of electric vehicle reserve capacity is established by taking the economic benefits of the electricity collectors, the load fluctuation of the microgrid, and the satisfaction of electric vehicle users as objective functions. The interests of electricity collectors, microgrids, and electric vehicle users should be taken into account to achieve a positive interaction among the three parties.
where, F1 represents the economic benefits of electricity collectors; CR represents the revenue of electric vehicles participating in V2G to provide reserve capacity; CU is the cost of purchasing electricity for the interaction between electricity collectors and the microgrid; CG is the retail revenue between the electricity collectors and the electric vehicle users; the units of the aforementioned are all $.
In the formula, T represents the dispatching period of 24 h, and its value is 24; M is 200, which represents the total number of electric vehicles in the area under the responsibility of electricity collectors; Δt is the dispatching time period, and its value is 1 h; Pue,i,t , Pde,i,t are the upper and lower trusted reserve capacity of each electric vehicle per hour, and the unit is kW; Vu,t and Vd,t are the upper and lower trusted reserve capacity prices, respectively, of the electric vehicle participating in the reserve service, and the unit is $/(kW ⋅h); u and v are a pair of decision-making factors about the upper and lower reserve power of electric vehicles, which means that charging and discharging of electric vehicles cannot be performed at the same time in actual scenarios. Pue,i,t is the upper reserve power provided by discharging to the microgrid when each electric vehicle actually participates in dispatching per hour, and the unit is kW; Vb is the loss price of the state switching between the charging and discharging of the electric vehicle, its value is set to 0.04375 (White and Zhang, 2011), and the unit is $/(kW ⋅h).
The electricity purchase cost paid to the microgrid by the electricity collector is the charging cost of electric vehicles. Among them, Pde,i,t is the lower reserve power provided by charging when each electric vehicle actually participates in the dispatching per hour, and the unit is kW; Vbat represents the average price of long-term transactions between the electricity collector and the microgrid, its value is set to 0.6 times of the commercial electricity price, and the unit is $/(kW ⋅h).
The retail revenue of the electricity collector is the actual 24-h daily charging cost of all electric vehicles in the area under its responsibility. Among them, Vde,t is the charging price per hour after the electric vehicle user provides the reserve service for participating in the microgrid interaction, and the unit is $/(kW ⋅h).
F2 represents the power fluctuation of the microgrid, expressed as the mean square deviation of the equivalent load on the demand side, and the unit is kW2. Among them, Peq,t is the equivalent load on the demand side; Pl,t represents the predicted value of load demand in the day, and the unit is kW. The smaller F2 is, the more beneficial to the economy and security of the microgrid.
F3 represents the satisfaction of electric vehicle users with the dispatching results, and its expression means the similarity between the upper and lower reserve capacity of each electric vehicle participating in V2G in the dispatching period and the actual declaration. Among them, G is the number of electric vehicles with the upper reserve capacity, and H is the number of electric vehicles with the lower reserve capacity. Only when electric vehicle users maintain a certain degree of satisfaction with the dispatch results for a long time does it make sense for electric vehicles to participate in V2G to provide reserve capacity to the grid.
2.3 Constraints
1) Charge and discharge state of electric vehicles constraints: in the actual scene, the upper and lower reserve power cannot be dispatched at the same time. Therefore, a pair of decision factors u and v for the reserve power of electric vehicles is introduced, which satisfies the following conditions:
2) System power balance constraints: the basic requirement of power system scheduling is to maintain a balance between the power generation of the system and load power. When the power generation of the system is less than the demand of the load, the upper reserve capacity needs to be dispatched. On the contrary, when the power generation of the system is greater than the demand of the load, the lower reserve capacity needs to be dispatched. Therefore, the power balance constraint for the overall system can be expressed as
In the aforementioned formula, Pg,t represents the generated power of the microgrid in each time period t and the unit is kW.
3) Charging and discharging power of electric vehicle constraints: the charging and discharging power of an electric vehicle in each time period shall not exceed its rated charging and discharging power.
Pu,i, max and Pd,i, max, respectively, represent the maximum charging and discharging power of each electric vehicle; Pu,i, min and Pd,i, min, respectively, represent the minimum charging and discharging power of each electric vehicle, and the units of the aforementioned are all kW.
4) Reserve capacity constraints: the dispatchable reserve capacity of an electric vehicle is premised on the user’s wishes, which cannot be ignored in the scheduling process. When it actually participates in the dispatch, the upper and lower reserve power should not exceed its upper and lower trusted reserve capacity.
3 Methods
This section mainly introduces the improved adaptive NSGA-III algorithm (NSGA-III-W) designed for the proposed problem model in detail, mainly including the adaptive T-crossover operator and the adaptive crossover mutation mechanism.
3.1 Adaptive T-crossover operator
In the original NSGA-III algorithm, as the optimization object dimension in the problem model keeps increasing, the number of non-dominated solutions increases exponentially, which is very disadvantageous for optimization scheduling. In the proposed model, the dimension of the optimization object is 9,600, and the scale is very large. The original NSGA-III algorithm is easy to fall into the local optimum in the later stage. The crossover operator in the NSGA-III algorithm plays a crucial role in the global search of the algorithm. After the chromosome population is selected by the selection operator, the entire population develops in a better direction by exchanging their excellent genes. In the traditional NSGA-III algorithm, the simulated binary crossover operator is used for the crossover operation, which has great randomness and subjectivity due to the artificial setting of parameters. Therefore, the crossover effect of the algorithm cannot be guaranteed. To enhance the diversity and the convergence performance of the population to ensure the crossover quality of the algorithm, an adaptive crossover operator based on T distribution is proposed. This crossover strategy can guide the algorithm to converge to a better solution.
The simulated binary cross is expressed as
Among them, C1 and C2 are the offspring individuals generated after the crossover operation; u1 and u2 are the parent individuals; βSBX is a random variable generated by the simulated binary operator.
In the formula, u is a random number uniformly distributed in the interval (0, 1); n is a self-defined non-negative number. The adaptive T-crossover is expressed as
where |t(n)| represents a random variable that conforms to the standard T distribution. The T-distribution curve is similar to the normal distribution, and the shape of the curve is directly related to the degree of freedom n. The smaller the degree of freedom n is, the smaller the peak value of the T distribution curve will be and the higher the two ends are. The larger the degree of freedom n is, the more similar the T distribution will be to the normal distribution. Based on this characteristic, the degree of freedom n that adaptively changes with the number of iterations is designed as
In the formula, gen represents the current iteration number of the algorithm; genmax represents the maximum iteration number of the algorithm. In the initial stage of the algorithm, the degree of freedom n is small, so that the T distribution will be relatively scattered and the value of the crossover operator will be relatively large, which is more conducive to the crossover operation, thereby increasing the global search ability of the algorithm. In the later stage of the algorithm, the degree of freedom n is relatively large, which can make the T distribution more concentrated, and the value of the crossover operator is relatively small, which is more conducive to the local search of the algorithm. So the adaptive T-crossover operator can be expressed as
The TDX operator has a wider search capability than the SBX operator, and the value of βTDX can be adaptively changed with the number of iterations. In the initial exploration stage of the algorithm, the degree of freedom n is small, the T distribution is relatively scattered, and the β value is likely to take a larger value to promote the crossover operation to generate new genes. In the later stage of the algorithm, the degree of freedom n is larger, the T distribution is more concentrated, the β value is more likely to take a smaller value, and the crossover effect is weakened, which can prevent the destruction of excellent genes. Through the aforementioned operations, the TDX operator achieves an adaptive change with the number of iterations.
3.2 The adaptive crossover mutation mechanism
To improve the speed of NSGA-III to find the optimal solution and accelerate the convergence performance of the algorithm, an adaptive crossover mutation mechanism is proposed. In the iterative process, the algorithm can adaptively select cross-mutation mechanisms with different search capabilities according to the current solution situation. the specific operation of the algorithm is expressed in the following pseudocode Algorithm 1.
Fidea represents the ideal solution of the current population. Considering that in the multi-objective optimization model of electric vehicle reserve capacity, all objectives have the same effect on the evaluation system, and there is no situation where a certain objective function has a greater impact, so the three objectives are equally important. The individual with the smallest FPi, index value is set as the optimal solution for the current population. FPi, index is expressed as follows:
In the formula, FPi, index represents the overall fitness of Pi individuals in the current population; ∂ is the number of optimization goals; β is the type of optimization objective; FPi,β represents the fitness value of the individual Pi in the current population on the target β; Favg,β represents the average fitness value of the current population on the target β. At the beginning of the algorithm, the first crossover mutation method is selected to generate offspring. When Fidea of three successive iterations of the population is smaller than Fset, method 2 with stronger searching ability is selected. Through this adaptive crossover mutation mechanism, the performance of the algorithm to find the optimal solution is improved. The overall flow chart of the improved NSGA-III algorithm is shown in Figure 1.
Algorithm 1. Adaptive crossover mutation mechanism.
1: SelectParameters = 1;
2: Set the initial Fidea value
3: for gen = 1; gen ≤ genmax; gen + + do
4: Evaluate the Fidea value of the current population;
5: Fidea (1, gen) ← Fidea;
6: if Fidea (1, gen)<6 ‖ (Fidea (1, gen)<Fidea && Fidea (1, gen − 1)<Fidea && Fidea (1, gen − 2)<Fidea) then
7: for i = 1; i ≤ N; i + + do
8: U1, U2 ← two parents were selected from the parent population Pt;
9: r1i = rand(0, 1), r2i = rand(0, 1), r3i = rand(0, 1);
10: if r1i ≤ 0.5 then
11: if r2i ≤ Pac then
12: C1, C2 ← Execute T-Crossover on U1, U2;
13: else
14: C1, C2 ← U1, U2;
15: end if
16: else
17: if r3i ≤ Pmu then
18: C1, C2 ← execute mutations on U1, U2;
19: else
20: C1, C2 ← U1, U2;
21: end if
22: end if
23: Pt+1 ← C1, C2
24: end for
25: else
26: for i = 1; i ≤ N; i + + do
27: U1, U2 ← two parents were selected from the parent population Pt;
28: r1i = rand(0, 1), r2i = rand(0, 1);
29: if r1i ≤ Pac then
30: C1, C2 ← execute T-crossover on U1, U2;
31: else
32: C1, C2 ← U1, U2;
33: end if
34: Take C1, C2 as the parent
35: if r2i ≤ Pmu then
36: C3, C4 ← execute mutations on C1, C2;
37: else
38: C3, C4 ← C1, C2;
39: end if
40: Pt+1 ← C3, C4
41: end for
42: end if
43: end for

FIGURE 1. Overall flow chart of NSGA-III algorithm improvement.
3.3 TOPSIS decision method
The basic process of TOPSIS is to normalize the decision matrix, select the positive and negative ideal solutions, compute the distances between each solution and ideal solutions, and then determine the optimal solution based on the close degree to the positive ideal solution. Since this method does not have strict restrictions on the amount of data and sample distribution, it is often used in multi-objective decision-making. When the problem model is optimized by the multi-objective optimization algorithm, multiple Pareto solutions are obtained. At this time, the TOPSIS method can be used to select a compromise solution from the multiple Pareto solutions as the optimal solution. The specific implementation steps of TOPSIS are as follows.
1) Build a decision matrix. It is assumed that there are n schemes and m targets. This corresponds to the number of Pareto solutions and the number of optimization objectives in this study, respectively. The decision matrix is as follows.
2) Forwardization of the original matrix. That is to convert all indicators into extremely small indicators, and the extremely small indicators mean that the smaller the indicator value, the better will be the effect. The conversion method for extremely large indicators to extremely small indicators is as follows:
3) Standardization of the forward matrix. The matrix after the forward transformation is standardized according to the following formula.
4) Calculate the distance between the solution of the individuals in the population and the ideal solution. The optimal value of each column is found as
In the formula, omegaj is the weight of each indicator. The default weight is the same. In the actual calculation, different weights can be assigned to each indicator according to the actual situation.
5) Calculate the relative closeness of each scheme and sort schemes.
6) The larger δi is, the better will be the scheme, and the best scheme can be selected according to this index.
4 Experimental results and analysis
In this section, the overall framework of the proposed model and improved method is first given in Figure 2. Then, this section is divided into three parts. In the first part, the parameter information of the algorithm and model is given, and the second part mainly verifies the effectiveness of the proposed algorithm through the comparative analysis of different algorithms. The third part designs two cases for electric vehicles of different scales to analyze their influence on the optimal scheduling of the model.
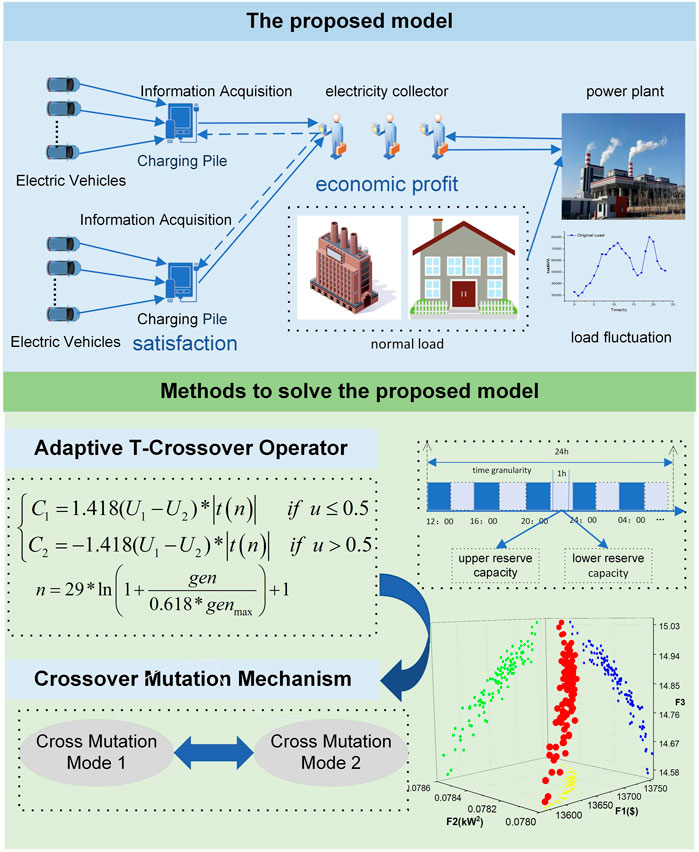
FIGURE 2. Overall framework of the proposed model and improved method.
4.1 Parameter setting
In this study, the NSGA-II algorithm, MOEA/D algorithm, and NSGA-III algorithm are first used for comparative experiments to illustrate the necessity of improving the NSGA-III algorithm. Then, the NSGA-III-W algorithm proposed in Section 3 is used to optimize and analyze the model. In the model, the trusted reserve capacity of 200 electric vehicles and the price information related to electric vehicles participating in V2G to provide reserve services are shown in Figure 3 and Figure 4, respectively. The parameter information of different algorithms is listed in Table 1. In addition, the load requirements of the microgrid system except for electric vehicle users are shown in Table 2.
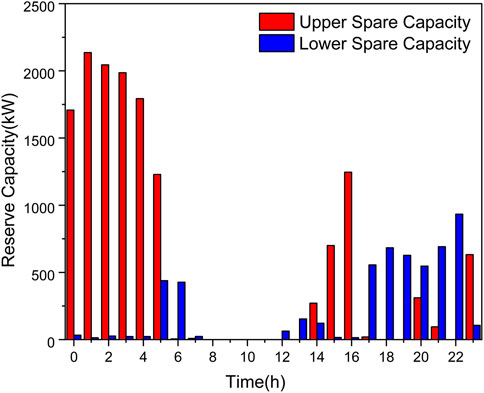
FIGURE 3. Trusted spare capacity distribution.
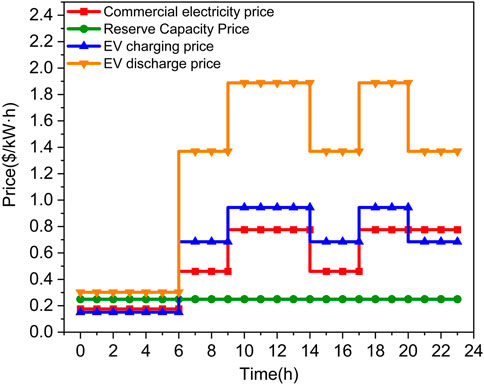
FIGURE 4. Time-of-use electricity price.
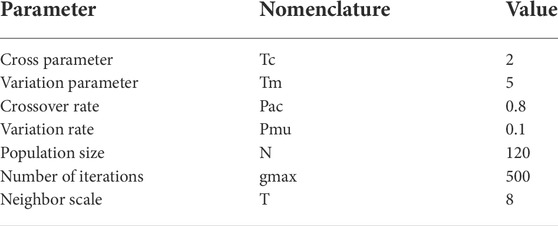
TABLE 1. Parameters of the algorithm.
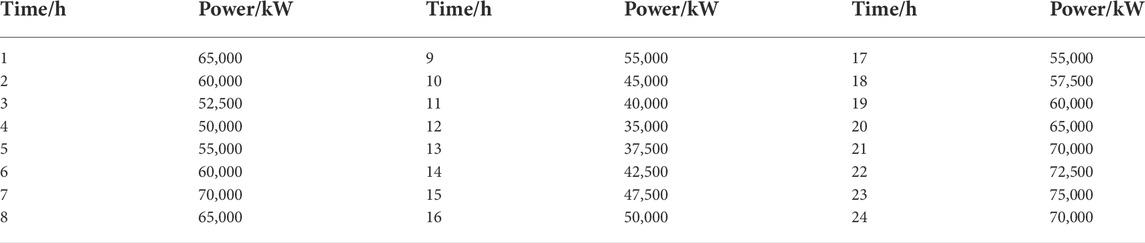
TABLE 2. Daily load demand for the microgrid.
4.2 Effectiveness of the proposed algorithm
Based on the research ideas in the literature (Wu et al., 2018), this study obtained the trusted reserve capacity of 200 electric vehicles and applied it to the multi-objective optimization model of the reserve capacity of electric vehicles proposed. Taking the microgrid system of a certain community as an example, the proposed model mainly considers three objectives: the economy of electricity collectors, the load fluctuation of the microgrid, and the satisfaction of electric vehicle users. First, according to the multi-objective characteristics of the proposed model, the mainstream multi-objective intelligent optimization algorithms, the NSGA-II algorithm, MOEA\D algorithm, and NSGA-III algorithm are used to solve and analyze the model, and the optimization results are shown in Figure 5.
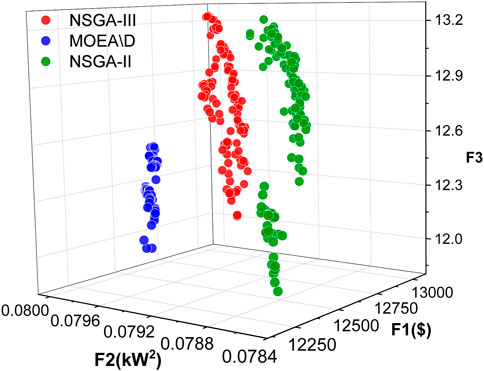
FIGURE 5. Optimization results of the three algorithms.
From the figure, it can be clearly observed that the Pareto front of the NSGA-III algorithm is at the back and top, which shows that the NSGA-III algorithm has advantages in improving the economic benefits of electricity collectors and the satisfaction of electric vehicle users. Specifically, in terms of the economic benefits of electricity collectors, the scheduling results of the NSGA-III algorithm are obviously superior to the other two algorithms. The Pareto front of the NSGA-III algorithm is generally concentrated at around 13,000 $, followed by the MOEA\D algorithm and NSGA-II algorithm. For the load fluctuation of the microgrid, the NSGA-II algorithm has the best scheduling result, followed by the NSGA-III algorithm and MOEA\D algorithm. The scheduling result of the NSGA-III algorithm is slightly better than that of the NSGA-II algorithm, but the maximum user satisfaction in the optimization result of the MOEA\D algorithm cannot reach the average user satisfaction optimized by the NSGA-III algorithm and NSGA-II algorithm. In general, the NSGA-III algorithm has certain advantages for solving the multi-objective optimization model of electric vehicles, but it is not optimal for the load fluctuation of the microgrid. To make the algorithm perform better in each target, we adopt the improvement measures proposed in Section 3 for the NSGA-III algorithm and express it as the NSGA-III-W algorithm, and the validity and rationality of the NSGA-III-W algorithm are shown in Figure 6.
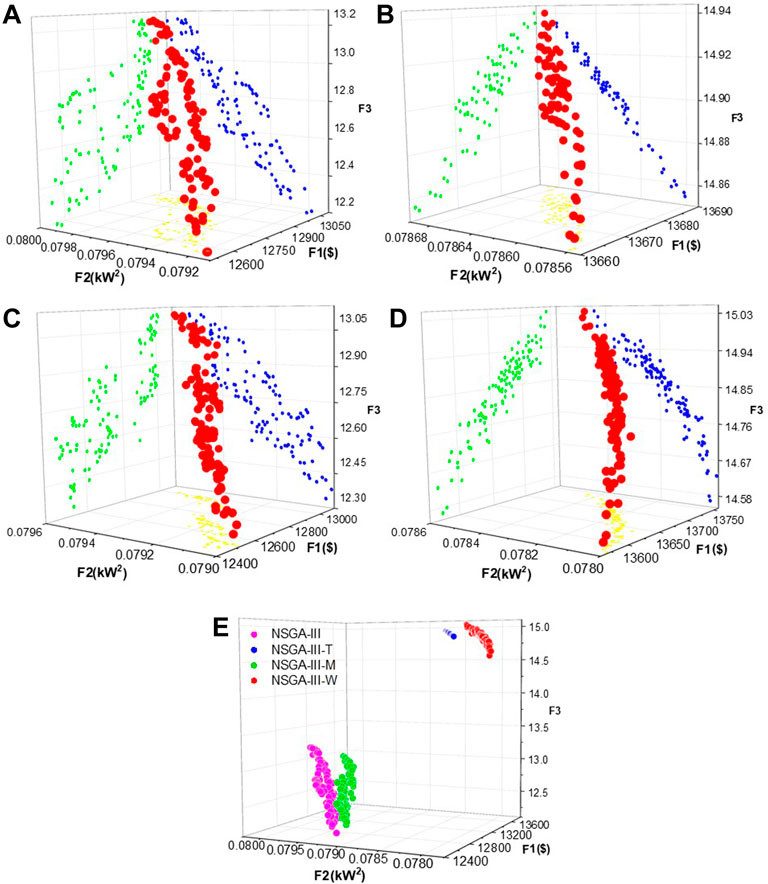
FIGURE 6. Improvement effect of the NSGA-III algorithm: (A) NSGA-III without any improvement; (B) improved NSGA-III with adaptive T-crossover; (C) improved NSGA-III with an adaptive crossover mutation mechanism; (D) NSGA-III-W algorithm with adaptive T cross-crossing operators and adaptive cross-mutation mechanisms; (E) Comparison of all algorithms above.
This study made two improvements to the NSGA-III algorithm, named as NSGA-III-T and NSGA-III-M, respectively, and all the improvement methods are applied to the model. When introducing the adaptive T-crossover operator (NSGA-III-T) into NSGA-III, its optimization effect on the three objectives is greatly improved compared with the unimproved NSGA-III. However, the adaptive crossover mutation mechanism (NSGA-III-M) can only achieve a little improvement to objective 2, and the performance on other objectives is not much different from that of the NSGA-III algorithm before the improvement. When the two improved methods of NSGA-III-T and NSGA-III-M are combined, their processing effect on the model is optimal. At the same time, considering the speed of improving the algorithm, the effect of the number of iterations is tested. The improved parts of the NSGA-III algorithm and the optimized values of the NSGA-II algorithm and the MOEA\D algorithm on the three objectives are shown in Figure 7. The NSGA-III-T algorithm reaches convergence when the number of iterations is 350, which greatly improves the convergence speed compared with the NSGA-III algorithm. The NSGA-III-M algorithm has obvious advantages in improving F2, and its optimization performance is significantly better than that of NSGA-II, NSGA-III, and MOEA\D algorithms. The advantages of NSGA-III-T and NSGA-III-M are combined in NSGA-III-W, which not only improves the optimization results but also improves the convergence performance of the algorithm. Therefore, the NSGA-III-W algorithm is suitable for the multi-objective optimization model of electric vehicle reserve capacity.
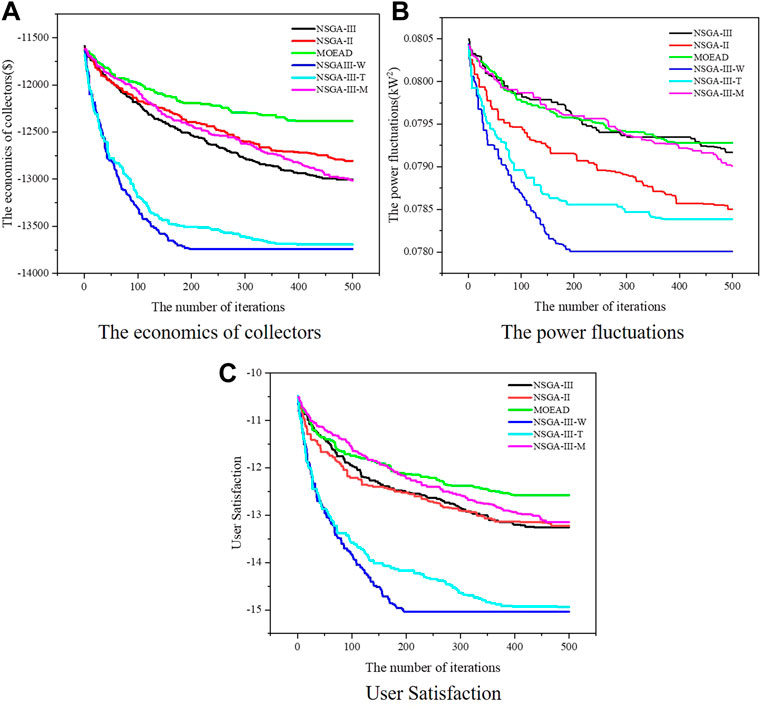
FIGURE 7. Convergence performance of all algorithms on different targets. (A) The convergence curve of e-commerce economy; (B) The convergence curve of the load fluctuation of the power grid; (C) the convergence curve of user satisfaction.
4.3 Model optimization result analysis
To evaluate the influence of different numbers of electric vehicles on optimal scheduling results, this study takes a microgrid system in a community in Shenzhen as an example; in case 1 and case 2, respectively, the models of 200 and 1,000 electric vehicles participating in V2G to provide reserve capacity are analyzed and discussed. In addition, since it is unable to judge the importance of the three objectives, namely the economic benefits of electricity collectors, the microgrid power fluctuations, and user satisfaction, Table 3 shows the optimal value of each objective, and decision-makers can choose according to the actual situation. This study uses the TOPSIS decision method to select a compromise solution from the Pareto front optimized by the NSGA-III-W algorithm as the optimal solution.
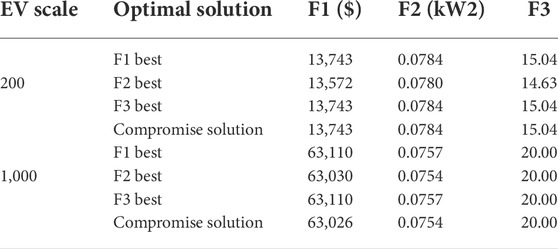
TABLE 3. Optimal target values.
4.3.1 CASE 1
The purpose of this case is to analyze the optimal scheduling scenario of 200 electric vehicles in the problem model. It can be seen from Table 3 that when F1 reaches the maximum value, F3 also achieves the maximum value. However, when F2 gets the optimal value, F1 and F3 are relatively lower. This shows that the changing trends of the three objectives are inconsistent in the multi-objective optimization process. When F1 and F3 reach the relative optimum, the value of F2 must be sacrificed. Since the economic benefits of electricity collectors and the satisfaction of users can be intuitively represented by numbers, here we mainly consider the power fluctuation of the microgrid.
In the problem design, the power fluctuation of the microgrid represents the effect of peak shaving and valley filling to a certain extent. The smaller the peak–valley difference is, the smaller the power fluctuation of the microgrid is, that is, the value of F2. In Figure 8, load curves before and after optimization in the model are compared to observe the effect of peak cutting and valley filling. As shown in the figure, the peak hours of the original load curve are mainly 11:00 and 19:00, and the valley hours at 16:00. The trusted upper reserve capacity of electric vehicles is mainly concentrated in 0 : 00 ∼ 5 : 00 and 15 : 00 ∼ 16 : 00, and the lower trusted reserve capacity is mainly 5 : 00 ∼ 6 : 00,12 : 00 ∼ 14 : 00, and 17 : 00 ∼ 23 : 00. The second peak moment of the original load curve is within the coverage area of the upper trusted reserve capacity of the electric vehicle, and its peak value is reduced from 72020 kW to 70428 kW after optimization. The purpose of peak shaving is effectively achieved within the allowable range of the trusted reserve capacity.
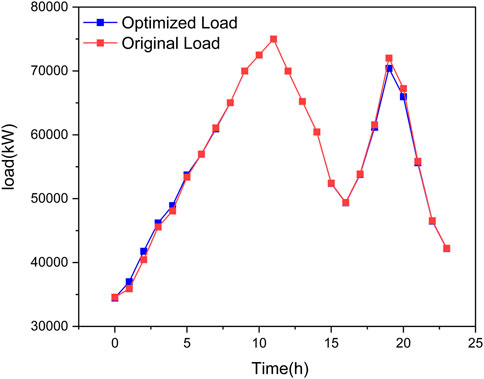
FIGURE 8. Microgrid load curve before and after optimization when there are 200 electric vehicles.
The electric vehicle reserve capacity after the optimization of the problem model is shown in the heat map in Figure 9, taking 20 electric vehicles as an example. It can be seen from the figure that the upper reserve capacity of electric vehicles is concentrated at 0 : 00 ∼ 5 : 00 and 16 : 00 ∼ 18 : 00, which is the off-peak period of electric vehicle use. In addition, 17 : 00 ∼ 18 : 00 is also the peak period of electric discharge price, and electric vehicle users can earn certain economic benefits without affecting their daily life. The scheduling of the lower reserve capacity is concentrated in 6 : 00 ∼ 7 : 00, 12 : 00 ∼ 14 : 00, and 17 : 00 ∼ 23 : 00, that is, before going to work and after getting off work, which can effectively use the spare time for charging. 20 : 00 ∼ 23 : 00 also is the low period of charging electricity price. Under the premise of not affecting the daily life of electric vehicle users, the reserve capacity can be sold to the power grid to provide backup services for the power grid, which can meet the reserve demand of the power grid, and users and electricity collectors can also obtain certain economic benefits.
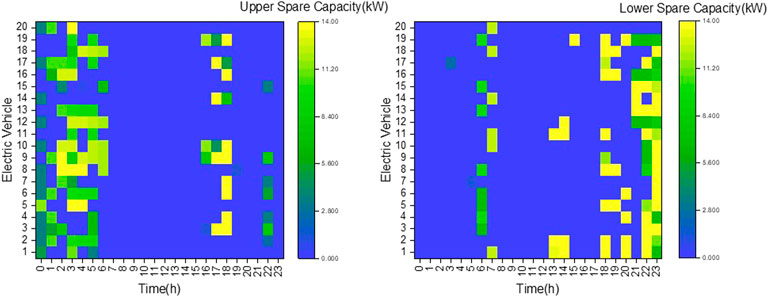
FIGURE 9. Optimization results for electric vehicle reserve capacity when there are 200 electric vehicles.
4.3.2 CASE 2
When the number of electric vehicles increases to 1,000, it is sufficient for the distributed power supply for the microgrid system, but for the multi-objective optimization algorithm, the dimension of the optimization variables is very large, which is not beneficial. It can be seen from the compromise solution in Table 3 that the maximum value of F1 and F3 is 63,026 $ and 20, respectively, and the optimal value of F2 is 0.0754 kW2. Comparing the aforementioned results with the scene of 200 electric vehicles, F1 and F3 are 13,743 $ and 15.04, respectively, F2 is 0.0784 kW2, the values of F1 and F3 have been greatly improved, and the value of F2 has also been improved to a certain extent. The specific situation of the load fluctuation of the microgrid system is shown in Figure 10. Comparing the scenario of 200 electric vehicles, it can be clearly observed that the load curve after optimization is much smoother than the load curve before optimization. Not only was the peak value at 19:00 reduced from 80101 kW to 78205 kW, but also the value of the “valley time” at 16:00 was filled from 47071 to 47473 kW.
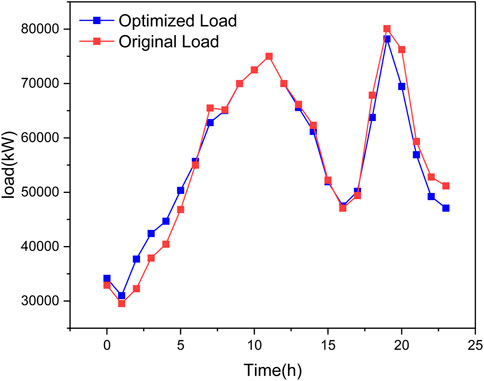
FIGURE 10. Microgrid load curve before and after optimization when there are 1,000 electric vehicles.
The optimized reserve capacity of electric vehicles is shown in Figure 11. Similarly, we select the scheduling results of 20 electric vehicles as a display. Compared with the scene of 200 electric vehicles, the yellow area of the upper reserve capacity is changed from 17 : 00 ∼ 18 : 00 to 16 : 00 ∼ 17 : 00, and the yellow area of the lower reserve capacity is shifted from 18 : 00 ∼ 23 : 00 to 19 : 00 ∼ 23 : 00. Looking at Figure 10, it can be seen that the transfer of this part of the spare capacity is to better smooth the load curve.
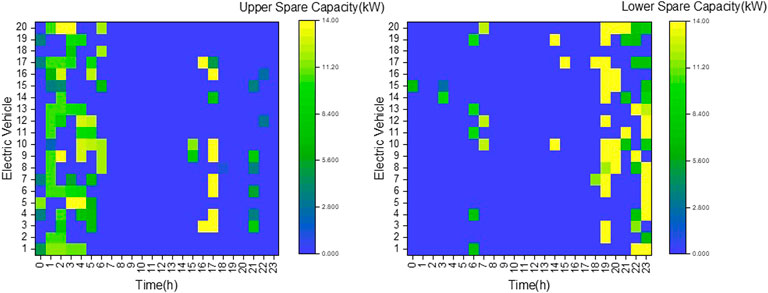
FIGURE 11. Optimization results for electric vehicle reserve capacity when there are 1,000 electric vehicles.
In summary, we can conclude that the increase in the number of electric vehicles is more beneficial to the microgrid system because it means that more electric vehicles can participate in dispatching, and decision makers have more choice space to make dispatching plans according to the actual situation. According to the needs and wishes of electric vehicle users, through V2G technology, the electricity in the non-use stage of electric vehicles is sold to the grid as a reliable reserve capacity to provide backup services for the grid. According to the established multi-objective optimization model of electric vehicle reserve capacity, the optimal scheduling of EV is carried out, which can not only make the electricity collectors and users profit from it but also achieve the purpose of smoothing the power fluctuation of the microgrid and effectively promote the good interaction between the electricity collectors, microgrid, and electric vehicles users. For the algorithm itself, some improvement measures may be needed to increase the effectiveness of the algorithm.
5 Conclusion
This study builds a multi-objective optimization model for electric vehicle reserve capacity based on electric vehicle user wishes. Aiming at the economics of electricity collectors, the load fluctuation of the microgrid, and the satisfaction of electric vehicle users, this study achieves a benign interaction between electricity collectors, the microgrid, and electric vehicle users. In addition, an improved NSGA-III algorithm named NSGA-III-W was proposed for the proposed multi-objective optimization model of electric vehicle reserve capacity. The diversity and convergence of the algorithm are effectively improved by introducing an adaptive T-crossover operator and adaptive crossover mutation mechanism. Experimental results show that the proposed algorithm can achieve the best results compared with other algorithms.
In short, this study has carried on the practical innovation from the model and algorithm, making it closer to reality. Extensive experimental results in this study demonstrate the effectiveness of the algorithmic improvements. In the future, the model needs to be further expanded to adapt to complex grid scenarios and consider the dispatching of electric vehicles under the power system including wind energy photovoltaics and other new energy sources. Second, it can be considered to further improve the algorithm for the future expanded model to adapt to the characteristics of the specific model, to deal with the optimal scheduling problem of electric vehicles participating in V2G in practical applications.
Data availability statement
The original contributions presented in the study are included in the article/Supplementary Material; further inquiries can be directed to the corresponding author.
Author contributions
SZ and PS put forward research ideas and design research plans. ZY and PS were responsible for the drafting of the manuscript and conducting of experiments. ZY, YG, and XZ were responsible for the revision of the final version of the manuscript.
Funding
National Science Foundation of China under grants 52077213 and 62003332. State Key Laboratory of Power System and Generation Equipment-Tsinghua University (SKLD20M22). Shenzhen Science and Technology Research and Development Fund JCYJ20200109114839874.
Conflict of interest
The authors declare that the research was conducted in the absence of any commercial or financial relationships that could be construed as a potential conflict of interest.
Publisher’s note
All claims expressed in this article are solely those of the authors and do not necessarily represent those of their affiliated organizations, or those of the publisher, the editors, and the reviewers. Any product that may be evaluated in this article, or claim that may be made by its manufacturer, is not guaranteed or endorsed by the publisher.
References
Alam, M. J. E., Muttaqi, K. M., and Sutanto, D. (2014). A controllable local peak-shaving strategy for effective utilization of pev battery capacity for distribution network support. IEEE Trans. Ind. Appl. 51 (3), 2030–2037. doi:10.1109/tia.2014.2369823
Barcellona, S., De Simone, D., and Piegari, L. (2019). Control strategy to improve ev range by exploiting hybrid storage units. IET Electr. Syst. Transp. 9 (4), 237–243. doi:10.1049/iet-est.2019.0038
Calearo, L., Thingvad, A., Suzuki, K., and Marinelli, M. (2019). Grid loading due to ev charging profiles based on pseudo-real driving pattern and user behavior. IEEE Trans. Transp. Electrific. 5 (3), 683–694. doi:10.1109/tte.2019.2921854
Chacko, P. J., and Sachidanandam, M. (2021). An optimized energy management system for vehicle to vehicle power transfer using micro grid charging station integrated gridable electric vehicles. Sustain. Energy, Grids Netw. 26, 100474. doi:10.1016/j.segan.2021.100474
Chen, X., and Leung, K.-C. (2019). Non-cooperative and cooperative optimization of scheduling with vehicle-to-grid regulation services. IEEE Trans. Veh. Technol. 69 (1), 114–130. doi:10.1109/tvt.2019.2952712
Cheng, L., Chen, Y., Liu, G., and 2pns-eg, (2022). 2PnS-EG: A general two-population n-strategy evolutionary game for strategic long-term bidding in a deregulated market under different market clearing mechanisms. Int. J. Electr. Power & Energy Syst. 142, 108182. doi:10.1016/j.ijepes.2022.108182
Cheng, L., Yin, L., Wang, J., Shen, T., Chen, Y., Liu, G., et al. (2021). Behavioral decision-making in power demand-side response management: A multi-population evolutionary game dynamics perspective. Int. J. Electr. Power & Energy Syst. 129, 106743. doi:10.1016/j.ijepes.2020.106743
Cheng, L., and Yu, T. (2019). A new generation of ai: A review and perspective on machine learning technologies applied to smart energy and electric power systems. Int. J. Energy Res. 43, 1928–1973. doi:10.1002/er.4333
Clement-Nyns, K., Haesen, E., and Driesen, J. (2009). The impact of charging plug-in hybrid electric vehicles on a residential distribution grid. IEEE Trans. Power Syst. 25 (1), 371–380. doi:10.1109/tpwrs.2009.2036481
Das, R., Wang, Y., Putrus, G., Kotter, R., Marzband, M., Herteleer, B., et al. (2020). Multi-objective techno-economic-environmental optimisation of electric vehicle for energy services. Appl. Energy 257, 113965. doi:10.1016/j.apenergy.2019.113965
DeForest, N., MacDonald, J. S., and Black, D. R. (2018). Day ahead optimization of an electric vehicle fleet providing ancillary services in the los angeles air force base vehicle-to-grid demonstration. Appl. energy 210, 987–1001. doi:10.1016/j.apenergy.2017.07.069
Flah, A., Alowaidi, M., Bajaj, M., Sharma, N. K., and Sharma, S. K. (2021). Electric vehicle model based on multiple recharge system and a particular traction motor conception. IEEE Access 9 (99), 49308–49324. doi:10.1109/access.2021.3068262
Gao, S., Li, H., Jurasz, J., and Dai, R. (2022). Optimal charging of electric vehicle aggregations participating in energy and ancillary service markets. IEEE J. Emerg. Sel. Top. Ind. Electron. 3, 270–278. doi:10.1109/jestie.2021.3102417
Ghosh, A. (2020). Possibilities and challenges for the inclusion of the electric vehicle (ev) to reduce the carbon footprint in the transport sector: A review. Energies 13 (10), 2602. doi:10.3390/en13102602
Gong, W., Wang, C., Fan, Z., and Xu, Y. (2022). Drivers of the peaking and decoupling between co2 emissions and economic growth around 2030 in China. Environ. Sci. Pollut. Res. 29, 3864–3878. doi:10.1007/s11356-021-15518-6
Han, R., Li, J., and Guo, Z. (2022). Optimal quota in China’s energy capping policy in 2030 with renewable targets and sectoral heterogeneity. Energy 239, 121971. doi:10.1016/j.energy.2021.121971
Hou, H., Xue, M., Xu, Y., Xiao, Z., Deng, X., Xu, T., et al. (2020). Multi-objective economic dispatch of a microgrid considering electric vehicle and transferable load. Appl. Energy 262, 114489. doi:10.1016/j.apenergy.2020.114489
Huang, H., Zhou, M., Zhang, S., Zhang, L., Li, G., and Sun, Y. (2020). Exploiting the operational flexibility of wind integrated hybrid ac/dc power systems. IEEE Trans. Power Syst. 36 (1), 818–826. doi:10.1109/tpwrs.2020.3014906
Kempton, W., and Letendre, S. E. (1997). Electric vehicles as a new power source for electric utilities. Transp. Res. Part D Transp. Environ. 2 (3), 157–175. doi:10.1016/s1361-9209(97)00001-1
Li, Y., Cai, Y., Zhao, T., Liu, Y., Wang, J., Wu, L., et al. (2022). Multi-objective optimal operation of centralized battery swap charging system with photovoltaic. J. Mod. Power Syst. Clean Energy 10, 149–162. doi:10.35833/mpce.2020.000109
Li, Y., and Hu, B. (2021). A consortium blockchain-enabled secure and privacy-preserving optimized charging and discharging trading scheme for electric vehicles. IEEE Trans. Ind. Inf. 17 (3), 1968-1977. doi:10.1109/tii.2020.2990732
Li, Y., Lu, X., and Kar, N. C. (2014). Rule-based control strategy with novel parameters optimization using nsga-ii for power-split phev operation cost minimization. IEEE Trans. Veh. Technol. 63 (7), 3051–3061. doi:10.1109/tvt.2014.2316644
Liang, H., Liu, Y., Li, F., and Shen, Y. (2018). Dynamic economic/emission dispatch including pevs for peak shaving and valley filling. IEEE Trans. Ind. Electron. 66 (4), 2880–2890. doi:10.1109/tie.2018.2850030
Liu, D., Wang, Y., and Shen, Y. (2016). Electric vehicle charging and discharging coordination on distribution network using multi-objective particle swarm optimization and fuzzy decision making. Energies 9 (3), 186. doi:10.3390/en9030186
Lu, X., Zhou, K., and Yang, S. (2017). Multi-objective optimal dispatch of microgrid containing electric vehicles. J. Clean. Prod. 165, 1572–1581. doi:10.1016/j.jclepro.2017.07.221
Ming, M., Wang, R., Zha, Y., and Zhang, T. (2017). Multi-objective optimization of hybrid renewable energy system using an enhanced multi-objective evolutionary algorithm. Energies 10 (5), 674. doi:10.3390/en10050674
Mohamed, N., Aymen, F., Alharbi, T. E., El-Bayeh, C. Z., Lassaad, S., Ghoneim, S. S., et al. (2022). A comprehensive analysis of wireless charging systems for electric vehicles. IEEE Access 10, 43865–43881. doi:10.1109/access.2022.3168727
Morais, H., Sousa, T., Castro, R., and Vale, Z. (2020). Multi-objective electric vehicles scheduling using elitist non-dominated sorting genetic algorithm. Appl. Sci. 10 (22), 7978. doi:10.3390/app10227978
Mortaz, E., Vinel, A., and Dvorkin, Y. (2019). An optimization model for siting and sizing of vehicle-to-grid facilities in a microgrid. Appl. energy 242, 1649–1660. doi:10.1016/j.apenergy.2019.03.131
Pavić, I., Capuder, T., and Kuzle, I. (2017). A comprehensive approach for maximizing flexibility benefits of electric vehicles. IEEE Syst. J. 12 (3), 2882–2893. doi:10.1109/jsyst.2017.2730234
Qu, B., Qiao, B., Zhu, Y., Liang, J., and Wang, L. (2017). Dynamic power dispatch considering electric vehicles and wind power using decomposition based multi-objective evolutionary algorithm. Energies 10 (12), 1991. doi:10.3390/en10121991
Rashedi, E., Rashedi, E., and Nezamabadi-Pour, H. (2018). A comprehensive survey on gravitational search algorithm. Swarm Evol. Comput. 41, 141–158. doi:10.1016/j.swevo.2018.02.018
Sarker, M. R., Pandžić, H., Sun, K., and Ortega-Vazquez, M. A. (2018). Optimal operation of aggregated electric vehicle charging stations coupled with energy storage. IET Gener. Transm. Distrib. 12 (5), 1127–1136. doi:10.1049/iet-gtd.2017.0134
Shafiee, S., Fotuhi-Firuzabad, M., and Rastegar, M. (2013). Investigating the impacts of plug-in hybrid electric vehicles on power distribution systems. IEEE Trans. Smart Grid 4 (3), 1351–1360. doi:10.1109/tsg.2013.2251483
Shun, T., Kunyu, L., Xiangning, X., Jianfeng, W., Yang, Y., and Jian, Z. (2016). Charging demand for electric vehicle based on stochastic analysis of trip chain. IET Gener. Transm. &. Distrib. 10 (11), 2689–2698. doi:10.1049/iet-gtd.2015.0995
Singh, J., and Tiwari, R. (2020). Cost benefit analysis for v2g implementation of electric vehicles in distribution system. IEEE Trans. Ind. Appl. 56 (5), 5963–5973. doi:10.1109/tia.2020.2986185
Sortomme, E., and El-Sharkawi, M. A. (2011). Optimal scheduling of vehicle-to-grid energy and ancillary services. IEEE Trans. Smart Grid 3 (1), 351–359. doi:10.1109/tsg.2011.2164099
Wang, N., Li, B., Duan, Y., and Jia, S. (2021). A multi-energy scheduling strategy for orderly charging and discharging of electric vehicles based on multi-objective particle swarm optimization. Sustain. Energy Technol. Assessments 44, 101037. doi:10.1016/j.seta.2021.101037
Wang, R., Mu, J., Sun, Z., Wang, J., and Hu, A. (2021). Nsga-ii multi-objective optimization regional electricity price model for electric vehicle charging based on travel law. Energy Rep. 7, 1495–1503. doi:10.1016/j.egyr.2021.09.093
Wang, Z., and Wang, S. (2013). Grid power peak shaving and valley filling using vehicle-to-grid systems. IEEE Trans. Power Deliv. 28 (3), 1822–1829. doi:10.1109/tpwrd.2013.2264497
Wei, C., Xu, J., Liao, S., and Sun, Y. (2020). Aggregation and scheduling models for electric vehicles in distribution networks considering power fluctuations and load rebound. IEEE Trans. Sustain. Energy 11 (4), 2755–2764. doi:10.1109/tste.2020.2975040
White, C. D., and Zhang, K. M. (2011). Using vehicle-to-grid technology for frequency regulation and peak-load reduction. J. Power Sources 196 (8), 3972–3980. doi:10.1016/j.jpowsour.2010.11.010
Wu, J., Xue, Y., Xie, D., Li, K., Wen, F., Zhao, J., et al. (2018). Multi-agent modeling and analysis of ev users’ travel willingness based on an integrated causal/statistical/behavioral model. J. Mod. Power Syst. Clean. Energy 6 (6), 1255–1263. doi:10.1007/s40565-018-0408-2
Yue, J., Hu, Z., Anvari-Moghaddam, A., and Guerrero, J. M. (2019). A multi-market-driven approach to energy scheduling of smart microgrids in distribution networks. Sustainability 11 (2), 301. doi:10.3390/su11020301
Zeynali, S., Rostami, N., Feyzi, M., and Mohammadi-Ivatloo, B. (2020). Multi-objective optimal planning of wind distributed generation considering uncertainty and different penetration level of plug-in electric vehicles. Sustain. Cities Soc. 62, 102401. doi:10.1016/j.scs.2020.102401
Zhang, H., Hu, Z., Xu, Z., and Song, Y. (2016). Evaluation of achievable vehicle-to-grid capacity using aggregate pev model. IEEE Trans. Power Syst. 32 (1), 784–794. doi:10.1109/tpwrs.2016.2561296
Zhao, S., Li, K., Yang, Z., Xu, X., and Zhang, N. (2022). A new power system active rescheduling method considering the dispatchable plug-in electric vehicles and intermittent renewable energies. Appl. Energy 314, 118715. doi:10.1016/j.apenergy.2022.118715
Zheng, Y., Song, Y., Hill, D. J., and Meng, K. (2018). Online distributed mpc-based optimal scheduling for ev charging stations in distribution systems. IEEE Trans. Ind. Inf. 15 (2), 638–649. doi:10.1109/tii.2018.2812755
Nomenclature
EV Electric vehicle
V2G Vehicle to grid
CR Revenue of electric vehicles to provide reserve capacity
CU Cost of purchasing electricity
CG Retail revenue from electric vehicle users
T Dispatching period
M Number of electric vehicles
Δt Dispatching time
u, v dDcision factor for upper and lower spare capacity
Pu,i,t, Pd,i,t Upper and lower trusted reserve capacity of each electric vehicle per hour
Pue,i,t, Pde,i,t Upper and lower reserve capacity of each electric vehicle per hour
Vu,t, Vd,t Upper and lower trusted reserve capacity prices
Vue,t, Vde,t Price of upper and lower reserve capacity
Vb Loss price
Vbat Average price of long-term electricity purchases by the electricity collector
G, H Number of electric vehicles with upper and lower reserve capacity
Pl,t Predicted value of load demand in t
Peq,t Equivalent load in t
Pg,t Generated power of the microgrid in t
Pu,i,max, Pu,i,min Maximum and minimum charging power of each electric vehicle
Pd,i,max, Pd,i,min Maximum and minimum discharging power of each electric vehicle
βSBX Simulate binary crossover operator
βTDX T-cross operator
u1, u2 Parent individuals
C1, C2 Offspring individuals
gen Current iteration count
genmax Maximum number of iterations
n Degrees of freedom
FPi,β Fitness value of the individual Pi in the current population on the target β
FPi, index Overall fitness of Pi individual
Favg,β Average fitness value of the current population on the target β
β Type of optimization objective
∂ Number of optimization goals
Keywords: electric vehicles, reserve capacity, user willingness, multi-objective, NSGA-III-W
Citation: Shao P, Yang Z, Guo Y, Zhao S and Zhu X (2022) Multi-objective optimal scheduling of reserve capacity of electric vehicles based on user wishes. Front. Energy Res. 10:977013. doi: 10.3389/fenrg.2022.977013
Received: 24 June 2022; Accepted: 01 September 2022;
Published: 06 October 2022.
Edited by:
Chi-Man Vong, University of Macau, ChinaReviewed by:
Flah Aymen, École Nationale d'Ingénieurs de Gabès, TunisiaLefeng Cheng, Guangzhou University, China
Ali Jabbary, Urmia University, Iran
Copyright © 2022 Shao, Yang, Guo, Zhao and Zhu. This is an open-access article distributed under the terms of the Creative Commons Attribution License (CC BY). The use, distribution or reproduction in other forums is permitted, provided the original author(s) and the copyright owner(s) are credited and that the original publication in this journal is cited, in accordance with accepted academic practice. No use, distribution or reproduction is permitted which does not comply with these terms.
*Correspondence: Zhile Yang, emwueWFuZ0BzaWF0LmFjLmNu