 Yiming Zhong
 Paul Norman
 Wenbin Wu
95% of researchers rate our articles as excellent or good
Learn more about the work of our research integrity team to safeguard the quality of each article we publish.
Find out more
ORIGINAL RESEARCH article
Front. Energy Res. , 30 August 2022
Sec. Nuclear Energy
Volume 10 - 2022 | https://doi.org/10.3389/fenrg.2022.976602
This article is part of the Research Topic Advanced Modeling and Simulation of Nuclear Reactors View all 14 articles
SMART is an integral small pressurized water nuclear reactor design with a rated power output of 100 MWe from 330 MWth, but it needs a higher power output for the United Kingdom energy market. This study applies Monte Carlo code OpenMC to build a full-core model and innovatively adjust the simulation coefficients to approach the reactor operating conditions. The analysis results point out the reasonable optimization’s technical direction. The model’s sensitivity to ENDF and JEFF nuclear data libraries and spatial division is tested and verified. Then it performs a series of simulations to obtain the core’s neutronic parameters, such as neutron energy and spatial distributions, effective neutron multiplication factor keff and its variation versus depletion. The analysis found that the initially designed core’s keff is 1.22906, and the temperature reactivity defect is 11612 pcm. In 1129 full-power operating days, the keff will decrease to 0.99126, and the reactor depletes 8.524 × 1026 235U atoms. However, the outermost fuel assemblies’ 235U depletion rate is lower than 45% in this extended refuelling cycle, and their ending enrichment is higher than 2.4%. That means the fuel economy of the original design’s two-batch refuelling scheme core layout is insufficient. Improving the thermal neutron fluence in these assemblies may optimize the SMART power performance effectively.
Clean and affordable energy is a basic necessity for comprehensive social development. The non-fossil energy sources fraction is continuously rising in many countries’ power supply systems (IAEA, 2018). However, the development of nuclear power remains uncertain due to multi reasons (Stoutenborough et al., 2013; Bisconti, 2018). According to the international atomic energy agency (IAEA) definitions, the small modular reactor has less than 300 MW electrical power output and adopts the modular design concept. The primary components can be mounted within the reactor pressure vessel. The fabricated reactor unit would be shipped for on-site installation. This approach has several advantages, such as the standardization of components and shortening construction schedules.
The Korean system-integrated modular advanced reactor (SMART) (IAEA, 2011; Choi, 2015) is a small integral pressurized water reactor. This technology was licensed for standard design approval (SDA) in July 2012. The SMART reactor core contains 57 fuel assemblies (FA). Each FA has 2 m active height and united into a standard 17 × 17 square assembly of UO2 ceramic fuel rods with the enrichment of less than 5%. An assembly also has several lumped burnable poison rods made of the mixture of gadolinium oxide Gd2O3 and UO2, and poison rods enrichment is 1.8%. From study works and light water reactor operating experience (Driscoll and Lanning, 1978; Kim et al., 1993; Sadighi et al., 2002), a two-batch refuelling scheme was established to return a cycle of 990 low power density, effective full-power days (EFPD).
Green Frog (GF) Nuclear is a United Kingdom independent power company that is participating in the development of SMART. They noted a higher power output SMART might better satisfy the demand for the United Kingdom market. This study has built a SMART core model by Monte Carlo method code OpenMC and has performed the simulations with the validated settings and conditions. The desired neutronic parameters would be tallied and then reasonably visualized. The results can determine which aspect has the most potential for improving power output. Due to the similarity of core design, the optimizations on SMART have the possibility of being extended to other integral PWR technologies.
OpenMC is a community-developed MC neutron and photon transport simulation code. A hybrid shared-memory parallelism (MP) (Dagum and Menon, 1998) and distributed-memory parallelism (MPI) (Graham et al., 2005) programming model is applied to support code parallelism. The OpenMC depletion function with multiple time integration methods is launched in the update at the late of 2019 (Romano et al., 2015; Paul K; Romano et al., 2021). The functions of OpenMC have been well verified by the developers with other MC method codes, such as MCNP and Serpent (Leppänen et al., 2015; Paul K.; Romano et al., 2021).
A 3D SMART reactor core model has been established. The dimensions of an assembly lattice box are 20.4 cm × 20.4 cm × 200.0 cm. Each assembly has 25 guide tubes for control rods and instrument tubes. The slice plots of the model are given in Figure 1.
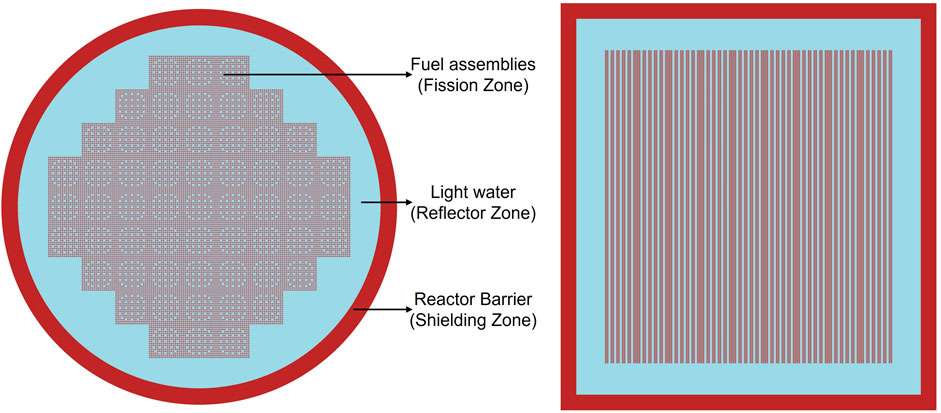
FIGURE 1. Radial and axial view of the OpenMC SMART core.
The material definition in OpenMC can set the specified material’ densities and compositions. Furthermore, OpenMC can use internally stored isotopes’ atomic mass and abundance data to determine a kind of material. The enrichment argument could add the isotopes at a specified enrichment in the material. In this case, the enrichment of 235U is set as 4.8% to simulate the enriched uranium oxide fuel.
This study has employed hybrid OpenMP and MPI parallelism methods on the BlueBEAR supercomputer. Both parallelism models could significantly improve the OpenMC simulation speed. The calculation rates within different parallelism models are given in Table 1.
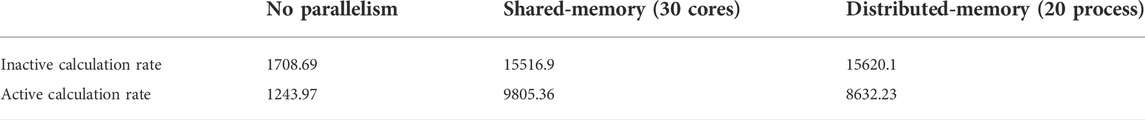
TABLE 1. OpenMC calculation speeds with different parallelism models (Unit: Particles/second).
The intrinsic errors of nuclear cross-section libraries will fundamentally affect the accuracy of MC simulation results. The uncertainty analysis of the nuclear database to the continuous-energy MC code is called a sensitivity study. ENDF/B-VII.1, ENDF/B-VIII.0 (Brown et al., 2018), and JEFF 3.3 (Plompen et al., 2020) have been individually employed in the simulations. In the preparing stage, the cited cross-section files are converted from their original format to the OpenMC readable HDF5. The keff eigenvalue calculation results are 1.29306 ± 7 × 10⁻⁵, 1.28870 ± 8 × 10⁻⁵, and 1.26958 ± 7 × 10⁻⁵. Each simulation would run 250 generations with 100 active ones and a million neutrons.
The result from ENDF/B-VII.1 is the highest. The reactivity is 436 pcm and 2348 pcm higher than its newer version ENDF/B-VIII.0 and JEFF 3.3. ENDF/B-VII.1 was selected to perform the rest of the studies because it was already widely used in multiple mature reactor physics codes. Moreover, OpenMC officially provides a depletion chain based on the ENDF/B-VII.1 libraries. Databases used in neutron transport calculations should keep consistent with the depletion analysis.
The selected ENDF/B-VII.1 library provides the incident neutron data at multi temperatures. A series of OpenMC simulations with various temperature settings have been done to observe the fuel temperature coefficient (FTC) and moderator temperature coefficient (MTC). OpenMC default material temperature is 293.6 K.
The keff decreases with the temperatures of fuel and moderator going up. For the testing model, all 57 FAs in the core have 4.8% enrichment. When the fuel heats up from 293.6 to 1200 K, the value of keff decreases from 1.41601 to 1.38364. Furthermore, when the temperature of the moderator is 600 K and water density is 0.7 g/cm3, the keff is 1.29312, 12289 pcm lower than the result with the default material temperature.
To run a spatially based depletion estimation, it is necessary to manually divide the initial reactor core model into many burn-up zones. Then a series of copied fuel materials would be created specifically to fill their corresponding burn-up zones. Hence, the depletion solver will calculate each burn-up zone’s characteristic flux and reaction rate, estimating the latest material compositions for the following period.
A series of burn-up calculations have been done to find the reasonable burn-up zone dividing method in both the radial and axial directions. Figure 2 presents an example of burn-up zone spatial positions.
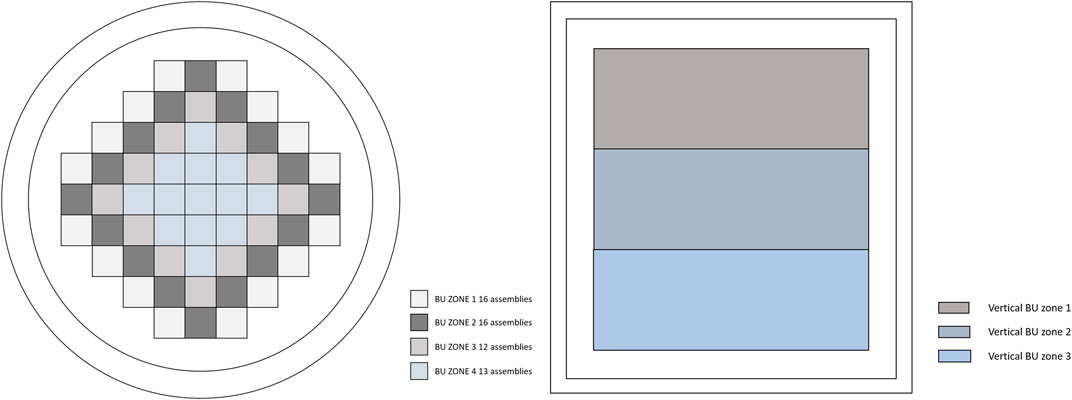
FIGURE 2. 4 × 3 Burn-up zone spatial location diagram.
Spatial zones were labelled as burn-up zone 1-4 from the edge to the center in the radial direction. Burn-up zone 1 and 2 respectively occupy 16 FAs, zone3 has 12 FAs, and 13 FAs are loaded in the center area zone 4. In the axial direction, 200 cm height FAs are evenly separated into three zones, labelled as burn-up zone 1–3 from top to bottom. Each burn-up zone was filled with a specially defined fuel material.
Assuming full power operating time for each calculation is 1129 days, longer than 36 months. The entire depletion period was divided into 58 steps with nonuniform step lengths. In the beginning, the step sizes are very short, like an hour, for building the equilibrium of fission product nuclides with large absorption cross-sections. The length of the burn-up step gradually increases with the depletion level as it goes deeper, from an hour to half a year. Figure 3 gives the calculation results.
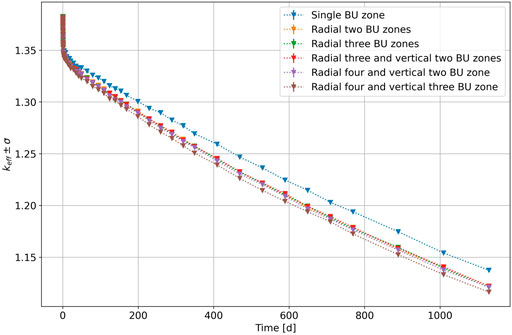
FIGURE 3. The keff variations in several burn-up calculations with the different number of spatial zones.
In this figure, the initial keff values are very close, about 1.38267. The difference becomes significant as the depletion going deeper. When the model is spatially separated, even though it only has two zones in the radial direction, the difference is 1525 pcm at the ending step. When there are three zones in the axial direction, the keff value is decreased to around 1.116 at the ending step. The model will adopt 0.7 g/cm3 water density and 4 × 3 burn-up zone partitions to approach the reactor’s full-power operation state.
The above sections have presented the validations and tests for the OpenMC SMART full-core model. This model now should demonstrate credible simulation results and reflect the neutron physics variations due to reactor operations or material usage. The model has been modified to the initially designed fuel layout, as shown in Figure 4.

FIGURE 4. Updated OpenMC model of the SMART reactor core to have two enrichment levels (2.4 and 4.8%) for fuel shifting.
The enrichment of 21 FAs in the center area has been redefined as 2.4% to reflect the two-batch refuelling scheme. White pins represent the 2.4% enrichment rods, and the 36 FAs’ grey rods contain 4.8% enriched UO2. Meanwhile, fifteen repeating defined fuel materials are in the burn-up calculation model. The neutron transport simulation results, such as the neutron’s energy spectrum, neutron flux and power distributions, will be presented first. Then, burn-up calculation results in one refuelling cycle are used to analyze the reactor uranium economics.
However, the temperature reactivity coefficients or fuel composition changes eventually affect the reactor performance through neutron flux. Therefore, once the core model has been tested and verified, the first goal of this study is to determine the neutron flux distribution in the whole core range.
In OpenMC code, a filter can identify the region in the phase space or set multiple series of energy bins. Two MeshFilters were created to define the regular Cartesian mesh grids to cover the model geometry and score the events. Meanwhile, an EnergyFilter is defined to score events based on incident particle energy, classified into 0–0.625 eV and 0.625–20.0 × 10⁶ eV. They represent the thermal and fast energy neutrons.
Figure 5 presents the normalized thermal and fast neutron flux distribution in cold and hot conditions. The cold state means that the moderator and fuel pins are at default temperatures, 293.6 K. The hot state represents the materials at operating temperatures, and water density decrease to 0.7 g/cm3. The keff for cold state simulation is 1.34518, for the hot state is 1.22906, and the temperature reactivity defect is 11612 pcm.
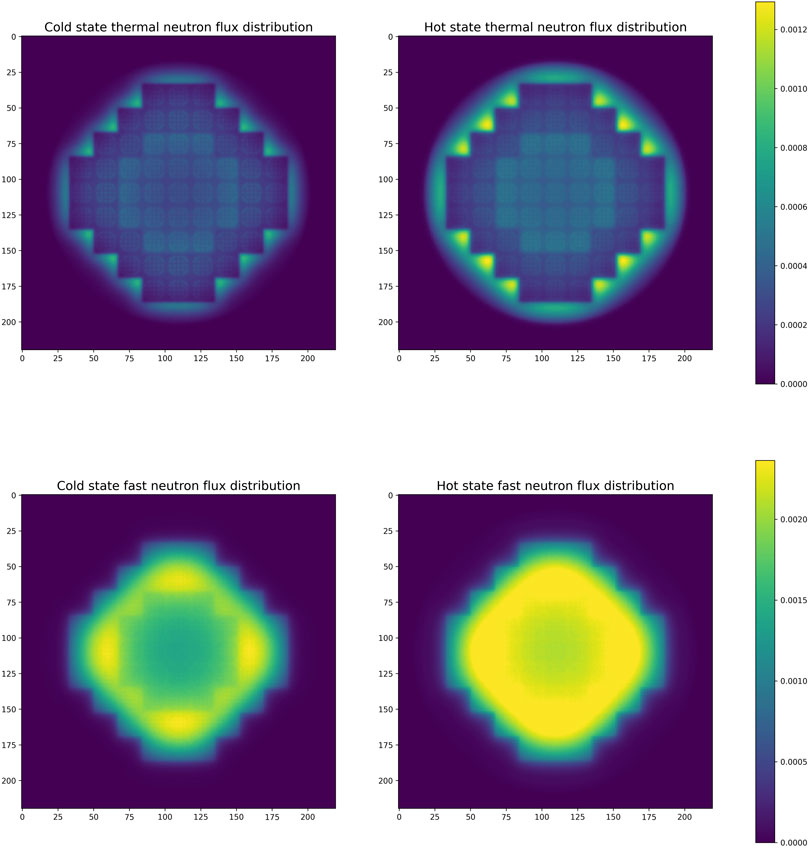
FIGURE 5. The thermal and fast neutron flux distributions in the two-batch refuelling scheme core.
The material temperature significantly affects the neutron multiplication, and the spatial distributions of the neutron flux also vary greatly. Thermal neutron flux peaks are outside of the fission zone. A large number of hydrogen atoms can effectively moderate the high-energy neutrons in this area. Conversely, the intensive fast neutron density area is inside the fission zone, surrounding the reloading FAs. When the fission chain reaction is successfully established, the thermal peaks become higher in the reflector area. The data was taken from Figure 5 along the X-axis direction diameter and plotted in Figure 6 to observe the variation. The higher material temperature hardens the neutron spectrum due to the broadened absorption cross-section and lack of moderation. A fraction of leaking thermalized neutrons scatter back to the fission zone.
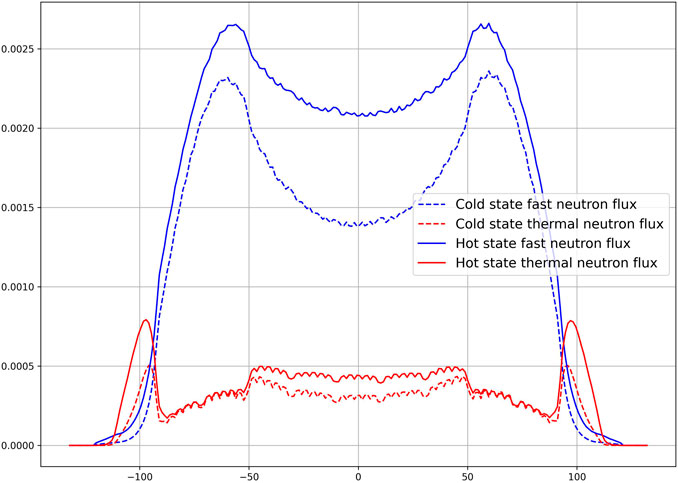
FIGURE 6. Cold and hot state neutron flux distribution viewed along a diameter in the X-axis direction.
When the reactor operates, the primary cycle coolant is pumped through the core from the bottom to the top, taking the fission heat and transferring it to the steam generator. Therefore, it is necessary to investigate the spatial neutron distribution inside the core. Figure 7 gives the results.
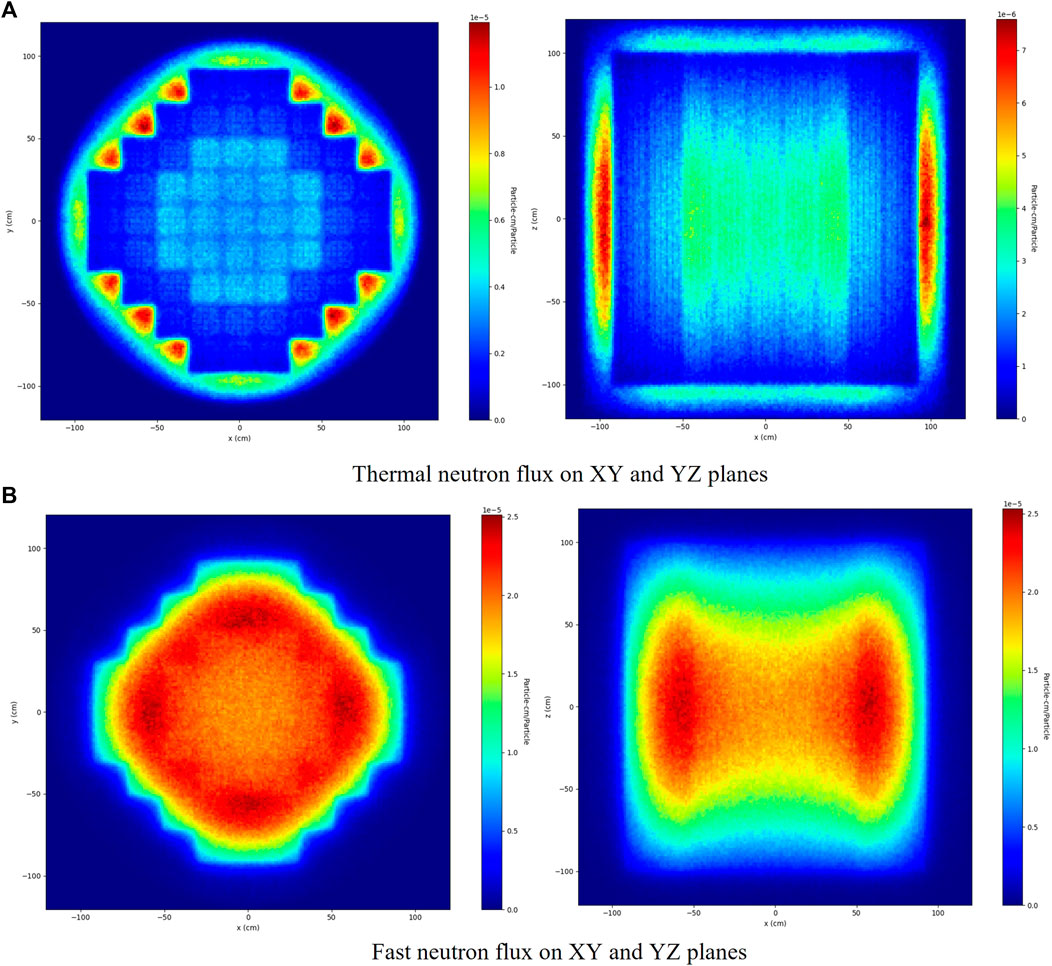
FIGURE 7. The slices of 3D mesh (A) thermal and (B) fast neutron flux tallying results.
The entire 3D array tallying results are sliced by XY and YZ planes and then plotted out. Figure 7 also shows the colour bars and scales since each sub-plotting process is independent. Another colour map presents the 3D mesh filter results to distinguish from 2D mesh plots.
The thermal neutron flux density is significant at the water zone’s half-height point and decreases in the axial direction. The fast neutron flux density is high at the same axial position. The enriched fuel assemblies produce a more significant amount of fast neutrons than the 2.4% enrichment ones. However, the neutron flux densities at the top and bottom of fuel assemblies are relatively low.
In addition to neutron spatial distributions, another important issue that should be determined in the simulation is the neutron energy distribution. The incident neutron’s energy would directly affect the occurrence rate of a series of nuclear reactions, not only for fission itself. Figure 8 gives the neutron energy simulation results, where the energy range from 1 × 10⁻⁵—20 × 106 eV is logarithmically divided into 500 spaces.
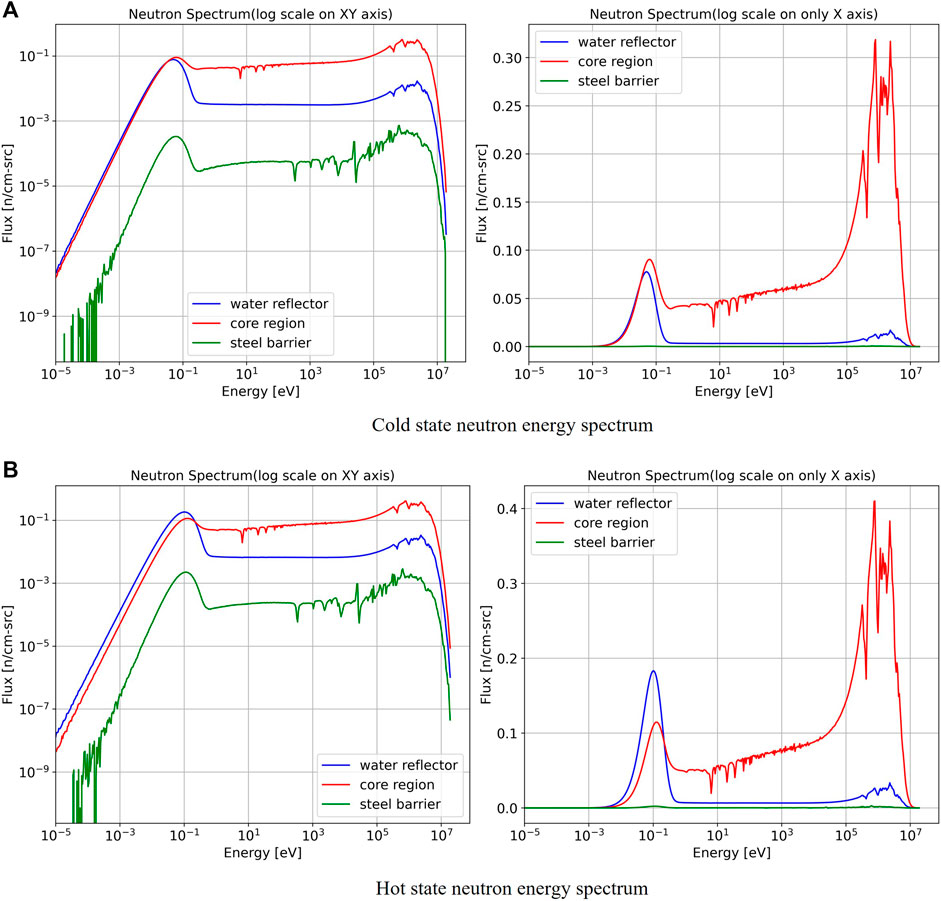
FIGURE 8. The steel barrier, reflector, and core’s neutron energy spectrums in the (A) cold and (B) hot states.
In Figure 8, the left-side spectrum has log scales on both X and Y-axis to observe the results with relatively small values, especially in the low energy range. The right-side spectrum is different on the Y-axis that is linearly scaled to conveniently observe the peak height difference and oscillations in all energy ranges.
The diagrams represent the neutron energy spectrum in different parts of the model, including the core, the reflector area and the steel barrier. The tallied spectrum has a peak at the thermal energy range, around 10–1 eV, and it also has a series of spikes in the fast energy range, from 105–107 eV. A continuous rising fluctuation links the peaks of the thermal and fast energy range. When the reactor starts up, the entire spectrum rises to a higher level. Moreover, its thermal peak is trending to higher energy due to loss of moderation. The migration of the thermal peak is more evident in the spectrum of the water reflector. In the hot state, a few leakage neutrons will travel through the water reflector and arrive at the steel barrier.
Figure 9 gives a series of spectra in the assemblies located at different burn-up zones. Their variations synchronize with the range of the entire core cell. The higher material temperature would amplify the radial neutron flux density heterogeneity.
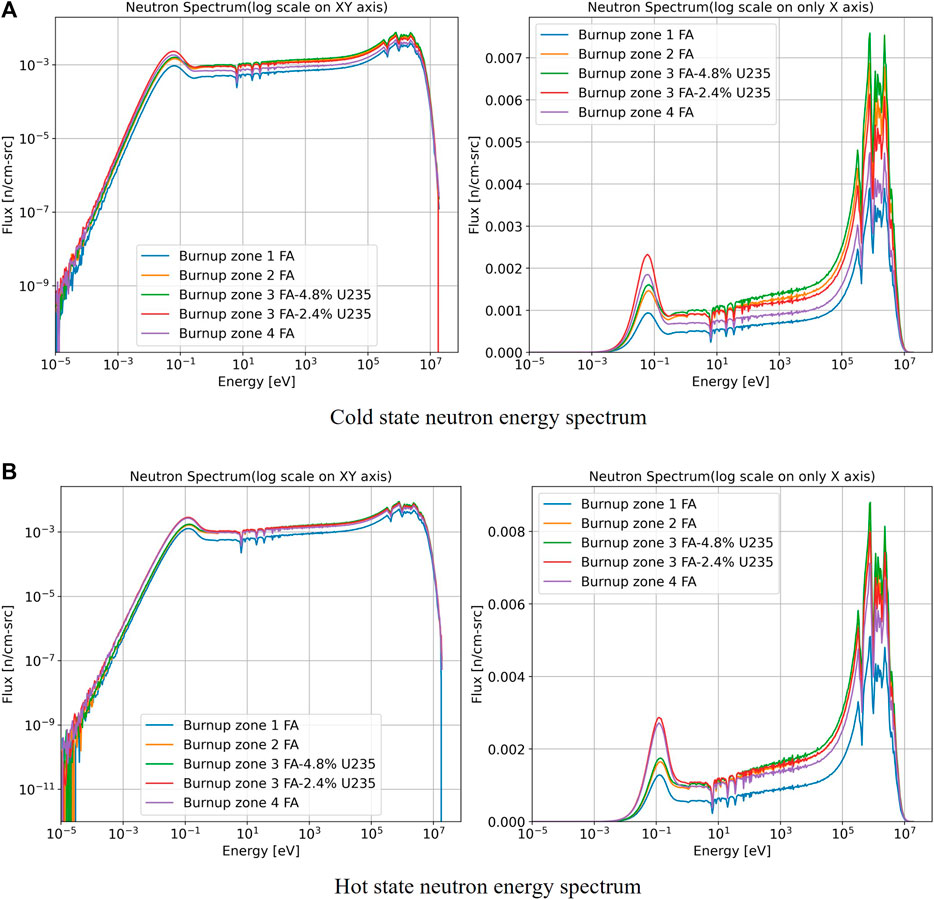
FIGURE 9. The neutron energy spectrums of different position fuel assemblies in the (A) cold and (B) hot states.
The fission rate is coupled with a 3D mesh filter in the hot state simulation, and the unit is reactions per source particle. Figure 10 presents the fission rate distribution. The highlighted area of the fission reaction rate is highly coincident with the high fast neutron flux density area around the reloading FA zone. The fuel rods do not uniformly produce heat when the reactor is operating. A bright belt surrounds the core edge. The large number of thermal neutrons produced in the water is scattered back and induces an intensive fission reaction in this area.
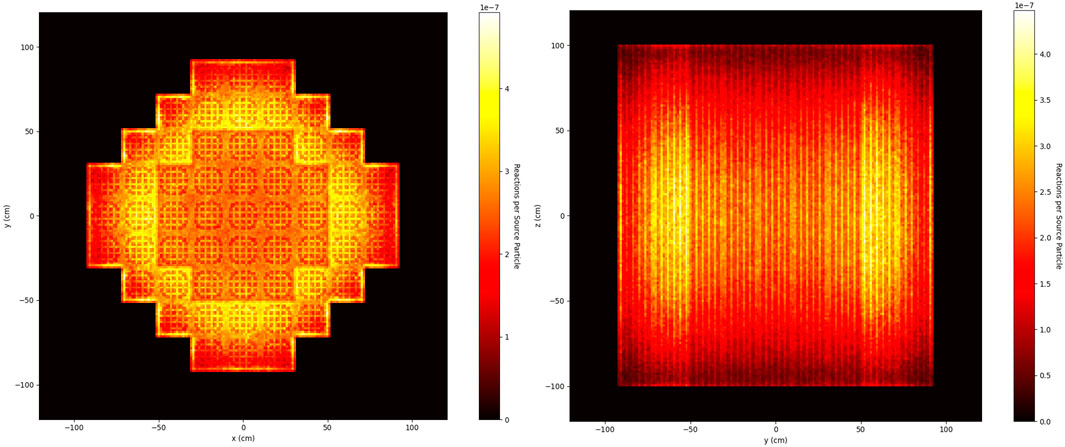
FIGURE 10. The fission rate distributions on the XY and YZ planes.
An OpenMC burn-up calculation is a coupling process of a neutron transport operator and a time integration scheme. OpenMC also provides several implementations of different higher-order time-integration algorithms. To further validate the accuracy, another two higher-order algorithms, CE/CM and CE/LI (Isotalo and Sahlberg, 2015), were used to run the same depletion calculation. The calculation results have been presented in Figure 11.
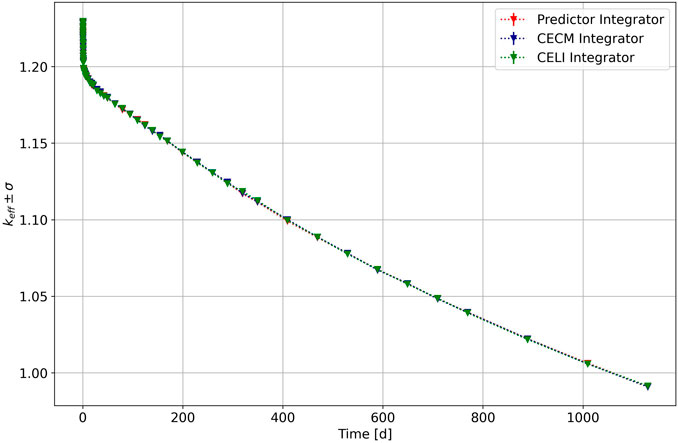
FIGURE 11. Predictor and higher-order integrators depletion results of two batch-scheme core: keff variations.
The calculation results show that with the predictor integrator, the value of keff is 1.22913 at the beginning of the cycle (BOC). Here the result has a 7 pcm improvement from the previous hot state calculation due to the lower neutron histories in the depletions.
After 1129 days of full-power operation, keff values decrease to 0.99126. The higher order integrators give BOC keff values are 1.22957. After the same length depletion period, the keff decreased to 0.99089 and 0.99155 with CE/CB and CE/LI integrators, respectively. This finding explains that the predictor integrator can give reasonable results with a shorter calculating time.
Once the depletion process begins, the fission product 135Xe equilibrium will be built relatively soon, in about 12 h. According to the calculation results, this simulated core can provide more than 990 full power (330 MWth) operating days, just as the original designer stated. However, the keff of this fuel layout will be lower than one, which means the system is sub-critical after 1129 depletion days. Therefore, the current core design cannot support the cycle length to be 20–30% extended. To further analyze the change in fuel composition and uranium utilization condition, the variations in fission rate and the number of 235U have been plotted.
Before describing the results, a feature must be pointed out first. In the simulations of two batch refuelling schemes core, the depletion results of two types of FAs in zone3 have been plotted separately. But they are still labelled as radial zone 3 for further comparison.
In Figure 12, the same radial zone diagrams have the same colour to present the data and use a specific marker to represent zones’ results at the same height. The fission rate and induced 235U depleting speeds differ in the axial direction. The middle height zone has a more significant fission rate in any radial position. Due to the neutron sampling always being isotropic, the fission rate values are close at all steps in the top and bottom zones. Even though existing oscillations are at a few steps, their mean value still can be fitted in the smoothly decreasing curve.
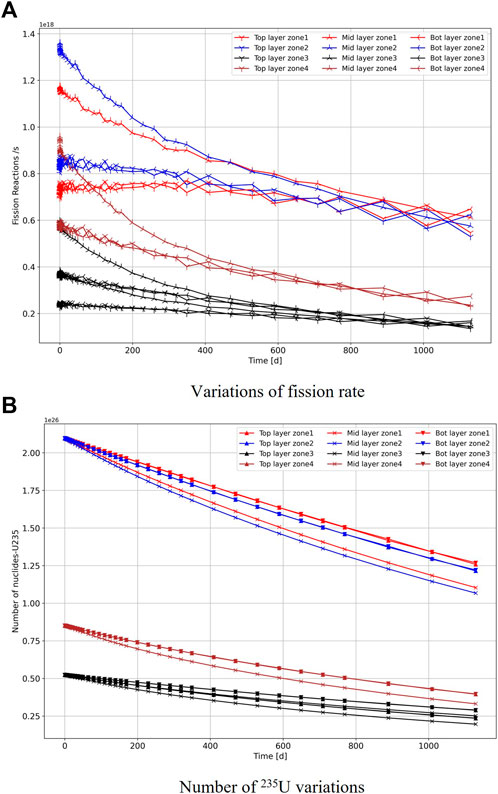
FIGURE 12. Burn-up results of 4 × 3 zones two batch refuelling scheme core, (A) fission rate, (B) the number of 235U.
Table 2 gives the burn-up results for the radial direction. In this table, the amount of burned 235U in a radial zone is the summation of its three corresponding axial zones results.
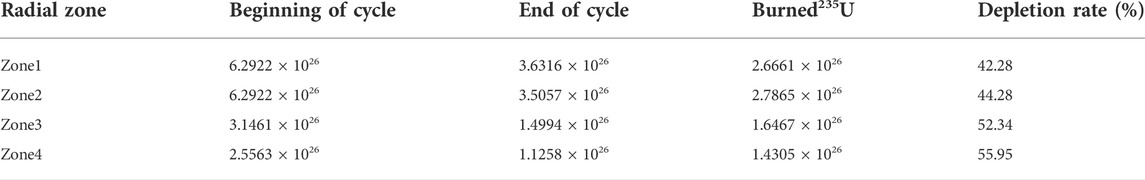
TABLE 2. The change of235U number in one refuelling cycle.
A total of 8.524 × 1026 235U atoms have been depleted in one refuelling cycle. The depletion rate is the fraction of burned 235U amount in each radial zone. Central zone 4 has the highest depletion rate, 55.95%, even though the FAs here only have 2.4% enrichment. The utilization of edge area fresh FAs is limited. The depletion rates of zone 1 and 2 are 42.3 and 44.3%. Since the number of FAs in each burn-up zone is not uniform, only studying the number of 235U could lead to misunderstanding results.
In Figure 13, the enrichment of reloading FAs drops to a low level, slightly higher than 1.0%. For the high initial enrichment FAs in the radial zone3, its enrichment significantly drops about 2.53% at the EOC. On the other hand, the high initial enrichment FAs in the rest radial burn-up zones have not been sufficiently depleted. The ending enrichment levels are 2.77 and 2.67% for radial zone 1 and 2. That is still higher than the initial enrichment for the reloading fuels. Figure 13
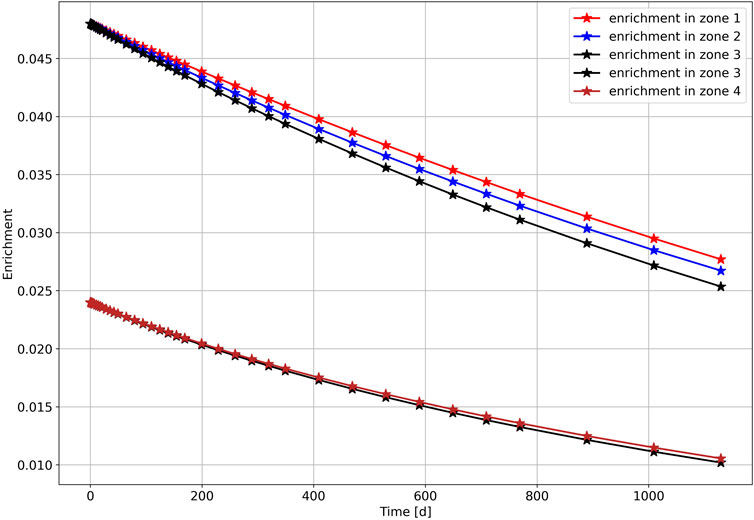
FIGURE 13. The enrichment variations in the radial burn-up zones.
This study has adjusted a full SMART core OpenMC model with operating material temperatures and twelve spatial burn-up zones to approach the operating state reactor core. This model then performed a series of simulations and obtained the reasonable neutronic parameters of the original SMART design. The maximum keff during reactor operation is 1.22906, and the temperature reactivity defect is 11612 pcm. The keff decreases to 0.99126 in 1129 full-power operation days. Moreover, the uranium utilization rates are low because the high enrichment fuel assemblies are in the low neutron flux region. The burn-up calculation results show the core outer burn-up zone 3 and 4 have 42.28 and 44.28% 235U depletion rates. These two zones’ EOC fuel enrichments are 2.77 and 2.67%. The fuel assemblies surrounding the reloading fuel zone have the most significant fission rate. However, a high fission rate belt surrounding the core edge means that the water can scatter part of thermalized neutrons back to the core. A more reflective material perhaps scatters more thermal neutrons. This update may get extra power output. Future studies will test a set of selected reflector materials in the simulations and try to determine a suitable one for SMART.
The raw data supporting the conclusion of this article will be made available by the authors, without undue reservation.
All authors contributed to the writing and reviewing of the manuscript. YZ contributed to the modelling and data analysis. All studies are under the guidance and supervised by PN. Wu organized the paper publication process.
The authors declare that the research was conducted in the absence of any commercial or financial relationships that could be construed as a potential conflict of interest.
All claims expressed in this article are solely those of the authors and do not necessarily represent those of their affiliated organizations, or those of the publisher, the editors and the reviewers. Any product that may be evaluated in this article, or claim that may be made by its manufacturer, is not guaranteed or endorsed by the publisher.
Bisconti, A. S. (2018). Changing public attitudes toward nuclear energy. Prog. Nucl. Energy 102, 103–113. doi:10.1016/j.pnucene.2017.07.002
Brown, D. A., Chadwick, M., Capote, R., Kahler, A., Trkov, A., Herman, M., et al. (2018). ENDF/B-VIII.0: The 8th major release of the nuclear reaction data library with CIELO-project cross sections, new standards and thermal scattering data. Nucl. Data Sheets 148, 1–142. doi:10.1016/j.nds.2018.02.001
Choi, S. (2015). “Small modular reactors (SMRs): The case of the Republic of Korea,” in Handbook of small modular nuclear reactors (Sawston, United Kingdom: Woodhead Publishing Limited), 425–465. doi:10.1533/9780857098535.4.379
Dagum, L., and Menon, R. (1998). OpenMP: An industry standard API for shared-memory programming. IEEE Comput. Sci. Eng. 5 (1), 46–55. doi:10.1109/99.660313
Fujita, E. K., Driscoll, M. J., and Lanning, D. D. (1978). Design and fuel management of PWR cores to optimize the once-through fuel cycle. United States, Chap. 3. doi:10.2172/6670045
Graham, R. L., Woodall, T. S., and Squyres, J. M. (2005). “Open MPI: A flexible high performance MPI,” in International conference on parallel processing and applied mathematics, 228–239.
IAEA (2011) System-integrated modular advanced reactor (SMART). Available at: https://aris.iaea.org/PDF/SMART.pdf. (Accessed April 04 2011).
Isotalo, A., and Sahlberg, V. (2015). Comparison of neutronics-depletion coupling schemes for burnup calculations. Nucl. Sci. Eng. 179 (4), 434–459. doi:10.13182/nse14-35
Kim, H. G., Chang, S. H., and Lee, B. H. (1993). Pressurized water reactor core parameter prediction using an artificial neural network. Nucl. Sci. Eng. 113 (1), 70–76. doi:10.13182/nse93-a23994
Leppänen, J., Pusa, M., Viitanen, T., Valtavirta, V., and Kaltiaisenaho, T. (2015). The Serpent Monte Carlo code: Status, development and applications in 2013. Ann. Nucl. Energy 82, 142–150. doi:10.1016/j.anucene.2014.08.024
Plompen, A. J. M., Cabellos, O., De Saint Jean, C., Fleming, M., Algora, A., Angelone, M., et al. (2020). The joint evaluated fission and fusion nuclear data library, JEFF-3.3. Eur. Phys. J. A 56 (7), 1–108.
Romano, Paul K., Josey, C. J., Johnson, A. E., and Liang, J. (2021). Depletion capabilities in the OpenMC Monte Carlo particle transport code. Ann. Nucl. Energy 152, 107989. doi:10.1016/j.anucene.2020.107989
Romano, P. K., Horelik, N. E., Herman, B. R., Nelson, A. G., Forget, B., and Smith, K. (2015). OpenMC: A state-of-the-art Monte Carlo code for research and development. Ann. Nucl. Energy 82, 90–97. doi:10.1016/j.anucene.2014.07.048
Sadighi, M., Setayeshi, S., and Salehi, A. A. (2002). PWR fuel management optimization using neural networks. Ann. Nucl. Energy 29 (1), 41–51. doi:10.1016/S0306-4549(01)00024-X
Keywords: small modular reactor, Monte Carlo, sensitivity study, power distribution, burn-up
Citation: Zhong Y, Norman P and Wu W (2022) A feasibility study of SMART reactor power performance optimizations-part 1: Steady-state and burn-up analysis. Front. Energy Res. 10:976602. doi: 10.3389/fenrg.2022.976602
Received: 23 June 2022; Accepted: 01 August 2022;
Published: 30 August 2022.
Edited by:
Jiankai Yu, Massachusetts Institute of Technology, United StatesReviewed by:
Yugao Ma, Nuclear Power Institute of China (NPIC), ChinaCopyright © 2022 Zhong, Norman and Wu. This is an open-access article distributed under the terms of the Creative Commons Attribution License (CC BY). The use, distribution or reproduction in other forums is permitted, provided the original author(s) and the copyright owner(s) are credited and that the original publication in this journal is cited, in accordance with accepted academic practice. No use, distribution or reproduction is permitted which does not comply with these terms.
*Correspondence: Wenbin Wu, d3V3YjI4QG1haWwuc3lzdS5lZHUuY24=
Disclaimer: All claims expressed in this article are solely those of the authors and do not necessarily represent those of their affiliated organizations, or those of the publisher, the editors and the reviewers. Any product that may be evaluated in this article or claim that may be made by its manufacturer is not guaranteed or endorsed by the publisher.
Research integrity at Frontiers
Learn more about the work of our research integrity team to safeguard the quality of each article we publish.