 HongYing He
 FangYu Fu
 DianSheng Luo
- College of Electrical and Information Engineering, Hunan University, Changsha, China
In order to improve the accuracy of wind power output forecasting and ensure reliability of the power grid, multiplex parallel GAT-ALSTM, a spatial-temporal learning model for multi-sites wind power collaborative forecasting is proposed in this study. Topography was generated by using geographic information (longitude and latitude) obtained from the wind power generation sites. The GAT layer was used to capture the spatial correlation characteristics of multi-sites wind power. Feature dimension enhancement of each wind power generation site was achieved by aggregating the information from the adjacent sites. The ALSTM layer was used to capture the temporal correlation of each power output time series. The multiplex parallel structure of the model is designed to provide fast prediction of large-scale distributed wind power generation. The validity of the proposed multiplex parallel GAT-ALSTM was confirmed by comparison with the forecast results obtained by RNN, LSTM, ALSTM, and GNN-ALSTM. The testing results showed that, compared to RNN, LSTM, ALSTM, and GNN-ALSTM, the forecast results of the multiplex parallel GAT-ALSTM had the lowest mean absolute value error and the highest accuracy.
1 Introduction
With the sharp increase in wind farms and installed capacity, the proportion of wind power in the total power grid capacity is also increasing. However, due to the intermittence and volatility of wind power, it will bring challenges to the safety and stable operation of the power grid (Yan et al., 2018; Li, 2022). Accurate forecasting of wind power can relieve the pressure of peak shaving and frequency modulation and effectively improve wind power accommodation capability on the power grid (Li et al., 2022; Liu et al., 2022).
Wind power prediction has been widely used and extensively researched recently. Wind power prediction algorithms are mainly divided into two categories: one based on a statistical model and the other on a deep learning algorithm. Tan et al. (2021) proposed a method to use an improved LSTM network with a new gating mechanism to build a prediction model for ultra-short-term wind power. González-Sopeña et al. (2020) introduced a multi-step wind power prediction model using variational mode decomposition and an extreme learning machine. Verma et al. (2018) proposed a short-term wind power model enhanced by support vector machines. Cao and Gui (2018) combined an LSTM algorithm based on deep learning with a LighTGBM algorithm based on a statistical model for wind power prediction. Yatiyana et al. (2017) established wind power generation prediction technology based on an ARIMA statistical model. Peng et al. (2016) proposed a new ultra-short-term wind power prediction method based on numerical weather forecasting and an error correction method. These methods have advantages and applicability in different wind power forecasting situations; however, most of them only focus on the data of a single site, and ignore the correlation of data between adjacent sites. At the same time, if it is necessary to predict the wind power of a large-scale station, model training should be carried out separately, which is inefficient.
A graph neural network is a deep learning algorithm based on the topological relationships of nodes to extract their spatial correlation. In the field of traffic, Tang et al. (2020) proposed the use of a GAGCN network to predict traffic flow speed. In the field of communication, He and Zhao (2020) proposed a fault diagnosis scheme for a telecommunication network based on a graph neural network. At present, the most widely used and effective graph neural network is the graph attention network (GAT) (Hu et al., 2021; Tian et al., 2022). The GAT introduces an attention mechanism in the process of the graph neural network, which makes the net pay more attention to neighboring nodes with large correlations and can achieve better results (Dong et al., 2022; Xu et al., 2022).
In this study, we propose a collaborative forecasting model for multi-sites wind power forecasting with strong generalization ability and greater accuracy. The proposed model was termed the multiplex parallel GAT-ALSTM, which aimed to simultaneously capture the spatial-temporal correlations in multi-sites wind power systems and achieve multi-sites wind power multiplex parallel forecasts. In this model, the spatial correlation feature of wind power was extracted by a multi-channel parallel graph attention network. After that, the temporal features of multi-sites wind power were extracted by a multi-channel parallel ALSTM network. The efficiency and accuracy of the forecast were improved by the aforementioned method. The rest of this article is organized as follows: Section 2 describes the prerequisite knowledge for the graph attention network and attention-based short- and long-term networks; Section 3 introduces the concrete realization scheme of multiplex parallel GAT-ALSTM; Section 4 provides experimental simulation and results analysis; and, Section 5 discusses the experimental conclusions.
2 Preliminaries
To interpret the multiplex parallel GAT-ALSTM model, some basic knowledge of GAT and ALSTM is essential.
2.1 Graph attention network
The graph attention network is a variant and improvement of the traditional graph neural network, which considers the topological relationship between the target node and the neighbor node from spatial dimension, and can adaptively assign different weight coefficients to the surrounding nodes in the aggregation process, which improves the learning and expression ability of the graph neural network for non-Euclidean data.
The key of GAT lies in the attention mechanism, and the attention mechanism is defined as follows:
where
To make attention coefficients easily comparable among different nodes, we normalized them with the softmax function, and obtained the normalized attention coefficient
Figure 1 shows the process of computing the attention coefficients of the nodes in a graph attention network. In order to simplify the calculation, we only compute
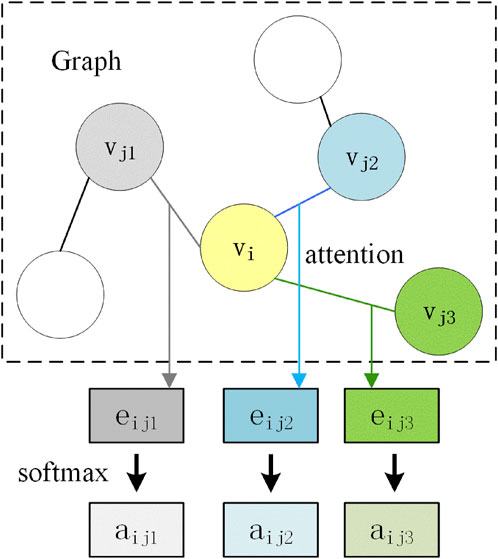
FIGURE 1. GAT network attention coefficient calculation diagram.
After the attention coefficients have been calculated, the features of all neighboring nodes are weighted and summed up to obtain the new feature vector of node
The features of first-order neighbor nodes can be extracted by a single layer network, while the features of second-order or multi-order neighbor nodes can be extracted by stacking multiple GATs. The attention mechanism is introduced in the graph attention network when updating the node information, which makes the graph neural network focus more on the useful feature information of the neighbor node to easily capture the spatial correlations of the neighboring node according to the topology structure, which largely improves the generalization and learning ability of the network.
2.2 Attention-based long short-term memory network
A long short-term memory network (LSTM) is a popular and effective deep learning model for processing time series data. The gating mechanism introduced in LSTM solves the problem of gradient disappearance in the training process of a recurrent neural network. The LSTM model is shown in Figure 2A, and the transfer function of each unit is given by:
where,
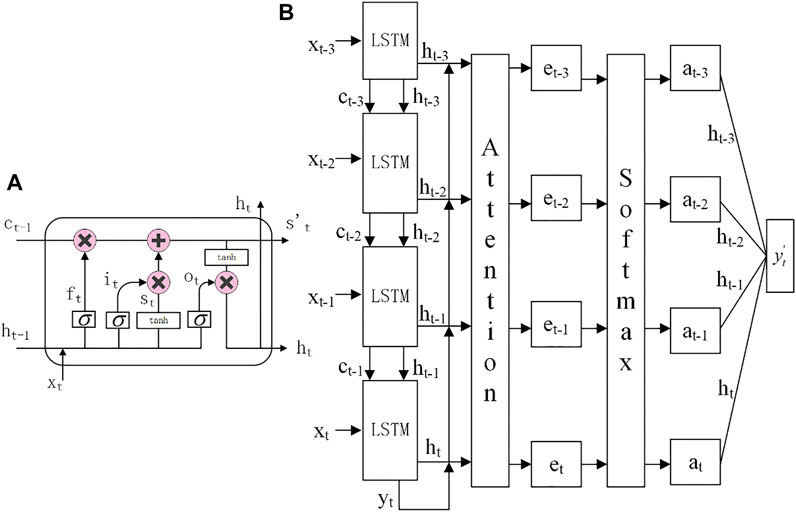
FIGURE 2. Single LSTM model diagram and ALSTM model diagram. (A) Single LSTM model. (B) ALSTM model.
When LSTM processes a time series, there is a problem that the input information in front of the time series will be diluted by the later input information. The longer the input time series is, the more obvious this phenomenon becomes. Therefore, in order to solve this problem, an attention mechanism is added to the LSTM model. The attention mechanism makes the LSTM network focus on the more important part of the time series, so as to improve the accuracy and efficiency of the network. The attention mechanism is given by:
where,
3 Implementation of multi-sites wind power collaborative forecasting based on a multiplex parallel GAT-ALSTM model
3.1 Model design
Figure 3 shows the structure of the multiplex parallel GAT-ALSTM model. It consists of an input layer, a multiplex parallel GAT layer, a multiplex parallel ALSTM layer, and an output layer.
(1) Input layer: Using the geographic information (longitude and latitude) of the wind sites, a topology graph G with N nodes is generated. Each node corresponds to a wind site. The input of the GAT-ALSTM model is the wind power generation of N sites at T slots before the prediction time,
(2) Multiplex parallel GAT layer: T parallel GAT networks are used to simultaneously learn the correlation of wind power between different sites at T slots from the spatial dimension. GAT uses different weights to aggregate the information of neighbor nodes according to the learned correlation among sites. The features of each site are dynamically updated.
(3) Multiplex parallel ALSTM layer: A multiplex parallel ALSTM layer is used to capture the temporal correlation of time series.
(4) Output layer: uses a linear transform layer to predict wind power at all sites at time,
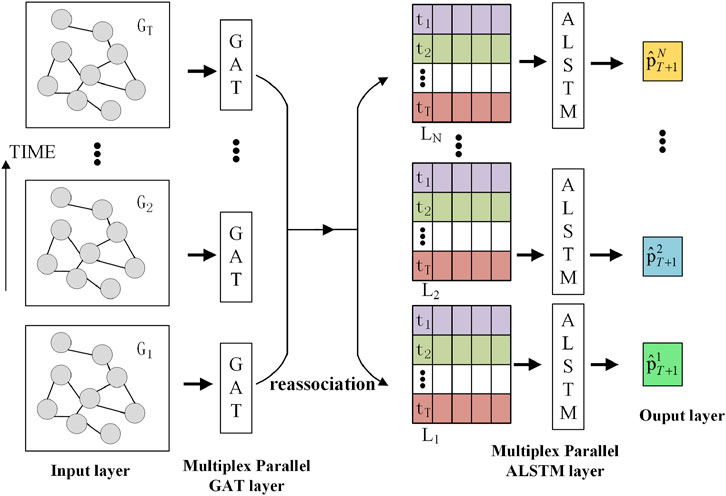
FIGURE 3. GAT—ALSTM model diagram.
3.2 Prediction based on a multi-channel parallel GAT-ALSTM model
A set of wind power data of model input is denoted as:
where,
The model input matrix is denoted as:
A one-step ahead forecast is applied in the model, which inputs the content sequences of N wind sites from time 1 to time T, and outputs the predicted wind power of N wind sites at time (T + 1), which is denoted as:
The prediction model can be described as follows:
where, θ is the parameter set and F is the multiplex parallel GAT-ALSTM model.
In order to achieve wind power prediction at multiple sites based on the multiplex parallel GAT-ALSTM model, the specific steps are as follows:
Step 1: Data preprocessing, such as data cleaning and normalization, is performed first, then the history power data of the selected N wind turbines are divided into training sets and test sets for model training and testing.
Step 2: Generate topography by using the geographic information (longitude and dimension) of the sites. The history power data of the selected N wind turbines and the wind power of N stations at the same time are used as features of nodes in each topological structure graph. T GAT networks are used for parallel computation. Finally, the characteristic matrix of n sites of T moments that aggregate the information of neighbor node is output by the GAT.
Step 3: Use the output of the GAT network as the input to the ALSTM. After processing by the GAT network, the initial features of the n sites at each time are increased from one dimension to high dimensions. Finally, the ALSTM uses enhanced feature data to output the wind power at N sites.
Step 4: Train the neural network.
Step 5: Use the model obtained by the aforementioned steps to make predictions on the test set sample and analyze the results.
4 Application and results
The wind power of seven adjacent sites from January to March 2013 was collected from NREL West. The training data set was from January 1 to March 20. The test data set was from March 21 to March 31. The data is in the form of csv files containing power values at 10-min resolution for seven wind sites.
4.1 Data preprocessing
Due to measurement errors or data storage errors in the data sampling equipment, there may be random errors in the original sampling data. These erroneous values will interfere with the efficacy of the model in wind power forecasting. In order to improve the speed of the machine learning model gradient descent to find the optimal solution, it is also necessary to preprocess the original data. The formula is as follows, where
For wind power generators with a capacity of 1.5 MW, the reasonable range of power outputs is 0–1.5 MW. Data beyond this range are regarded as abnormal and are eliminated and replaced with interpolated data. Lastly, all data are normalized.
4.2 Evaluation methods
To evaluate the accuracy of the prediction results, the mean absolute error (MAE) is used to evaluate the forecast results accuracy and the correlation coefficient (CC) is used to evaluate the time lag. The formula is as follows:
where T represents the number of consecutive one-step-ahead forecasts from time t1,
4.3 Experimental results
To verify the validity of the proposed model in an actual wind power forecasting task, the multiplex parallel GAT-ALSTM model and other associated models were used for wind power forecast experiments. The RNN and LSTM networks are common time series prediction models, and the ALSTM and GNN-ALSTM networks are used to verify the effectiveness of the attention mechanism. The experiment consists of one-step ahead forecasting of wind power. Figure 4A shows the location of each site. Figure 4B shows the topology graph of the seven wind sites. Figure 4C shows the attention weight coefficient between the wind sites learned by the GAT layer. It can be seen that the attention coefficient basically conforms to the rule of “near large and far small” in the spatial dimension. Figure 4D–J shows a comparison diagram of wind power forecasts at wind sites 1 to site 7 using five network models. Table 1 shows the evaluation index values of five network models for wind power forecast at sites 1 to 5.
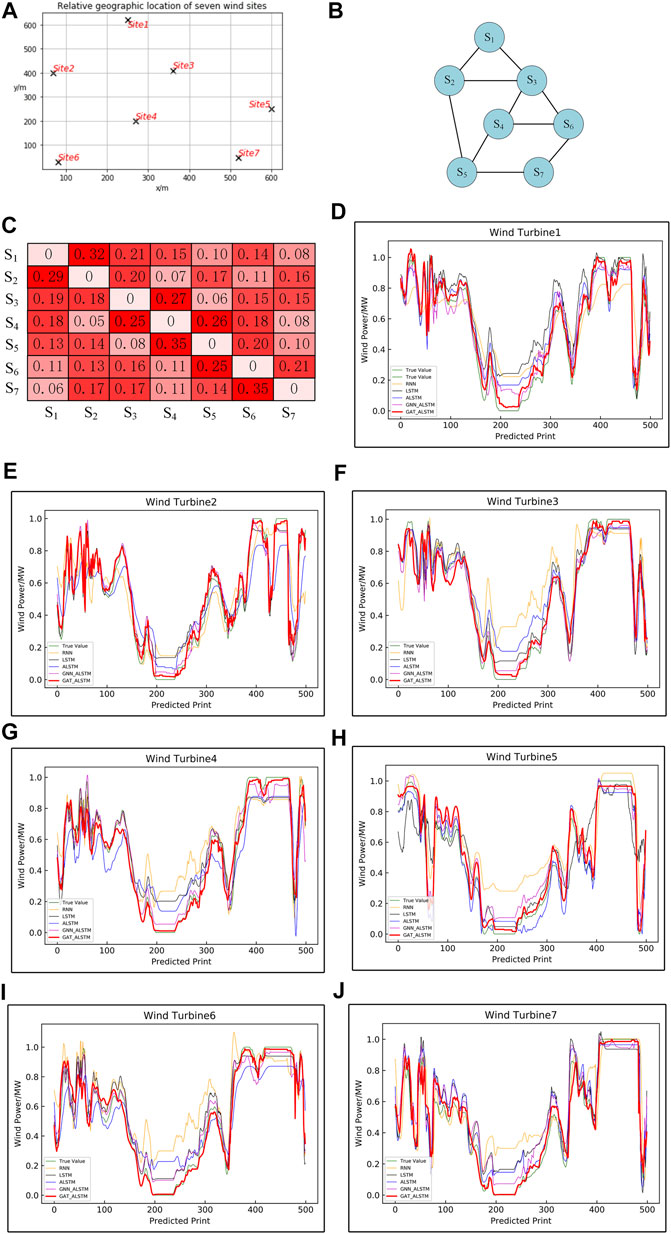
FIGURE 4. Experimental result diagram. (A) Relative geographical locations of seven wind sites. (B) Topology graph of seven wind sites. (C) Site weight coefficient diagram learned by the GAT layer. (D) Wind power forecast chart of Site 1. (E) Wind power forecast chart of Site 2. (F) Wind power forecast chart of Site 3. (G) Wind power forecast chart of Site 4. (H) Wind power forecast chart of Site 5. (I) Wind power forecast chart of Site 6. (J) Wind power forecast chart of Site 7.
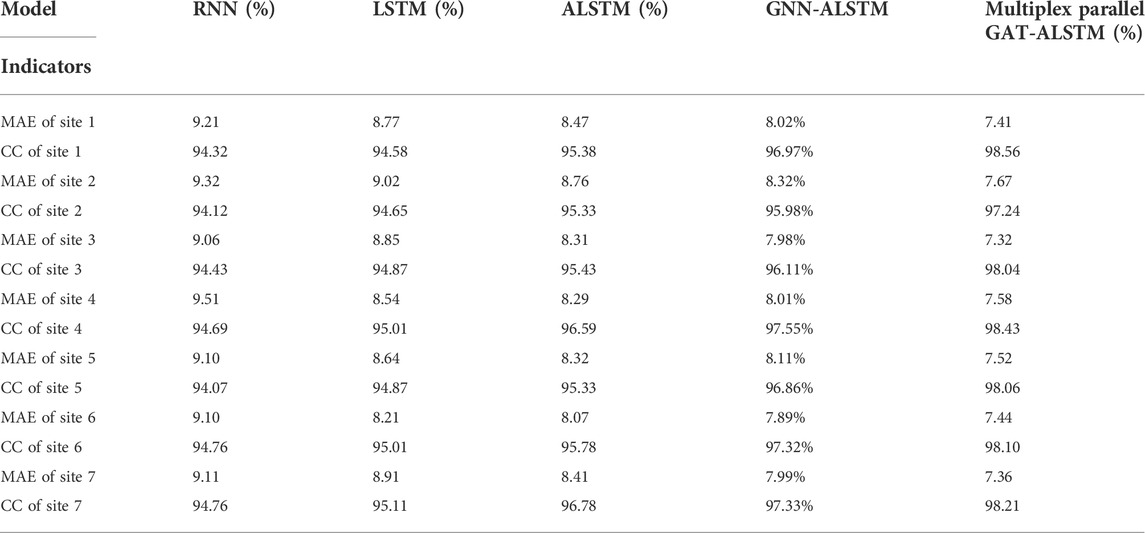
TABLE 1. Performance comparisons of five models for predicting wind power generation at sites 1 and 5.
It can be seen from the experimental results that, compared to the RNN network, the
5 Conclusion
This study has proposed multiplex parallel GAT-ALSTM, a spatial-temporal learning model for multi-sites wind power collaborative forecasting. Leveraging the geographical information and historical power output data of adjacent wind sites, the model simultaneously captured the spatial-temporal correlation in multi-sites wind power by two attention mechanisms. Based on the learned spatial-temporal correlation, it improved the accuracy of the forecast. The multiplex parallel structure of the model is suitable for fast prediction of large-scale distributed wind power generation. The validity of the proposed multiplex parallel GAT-ALSTM is confirmed by comparing its forecast results with those obtained from RNN, LSTM, ALSTM, and GNN-ALSTM. It was found that forecast errors were minimized by the proposed model; hence, the proposed model shows good performance in forecasting wind power.
In potential future work, we plan to incorporate atmospheric factors such as wind speed and temperature as exogenous variables in the learning process to further enhance the forecasting ability.
Data availability statement
The original contributions presented in the study are included in the article/supplementary material. Further inquiries can be directed to the corresponding authors.
Author contributions
HH: conceptualization, methodology, validation, and writing—review. FF: software, visualization, and writing—original draft. DL: methodology and experimental verification.
Funding
This work was supported by the National Key Research and Development Plan, China, 2017, under Grant 2017YFB0903403.
Conflict of interest
The authors declare that the research was conducted in the absence of any commercial or financial relationships that could be construed as a potential conflict of interest.
Publisher’s note
All claims expressed in this article are solely those of the authors and do not necessarily represent those of their affiliated organizations, or those of the publisher, the editors, and the reviewers. Any product that may be evaluated in this article, or claim that may be made by its manufacturer, is not guaranteed or endorsed by the publisher.
References
Cao, Y., and Gui, L. (2018). “Multi-step wind power forecasting model using LSTM networks, similar time series and LightGBM,” in 2018 5th International Conference on Systems and Informatics (ICSAI), 10-12 Nov. 2018 (Nanjing, China: IEEE), 192–197. doi:10.1109/ICSAI.2018.8599498
Dong, Y., Liu, Q., Du, B., and Zhang, L. (2022). Weighted feature fusion of convolutional neural network and graph attention network for hyperspectral image classification. IEEE Trans. Image Process. 31, 1559–1572. doi:10.1109/TIP.2022.3144017
González-Sopeña, J. M., Pakrashi, V., and Ghosh, B. (2020). “Multi-step ahead wind power forecasting for Ireland using an ensemble of VMD-ELM models,” in 2020 31st Irish Signals and Systems Conference (ISSC), 11-12 June 2020 (Letterkenny, Ireland: IEEE), 1–5. doi:10.1109/ISSC49989.2020.9180155
He, J., and Zhao, H. (2020). “fault diagnosis and location based on graph neural network in telecom networks,” in 2020 International Conference on Networking and Network Applications (NaNA), 10-13 Dec. 2020 (Haikou City, China: IEEE), 304–309. doi:10.1109/NaNA51271.2020.00059
Hu, B., Guo, K., Wang, X., Zhang, J., and Zhou, D. (2022). RRL-GAT: Graph attention network-driven multilabel image robust representation learning. IEEE Internet Things J. 9, 9167–9178. doi:10.1109/JIOT.2021.3089180
Li, H. (2022). Short-term wind power prediction via spatial temporal analysis and deep residual networks. Front. Energy Res. 10. doi:10.3389/fenrg.2022.920407
Li, Y., Tang, F., Gao, X., Zhang, T., Qi, J., Xie, J., et al. (2022). Numerical weather prediction correction strategy for short-term wind power forecasting based on bidirectional gated recurrent unit and XGBoost. Front. Energy Res. 9. doi:10.3389/fenrg.2021.836144
Liu, S., Wang, L., Jiang, H., Liu, Y., and You, H. (2022). Wind farm Energy storage system based on cat swarm optimization-backpropagation neural network wind power prediction. Front. Energy Res. 10. doi:10.3389/fenrg.2022.850295
Peng, X., Deng, D., Wen, J., Xiong, L., Feng, S., and Wang, B. (2016). “A very short term wind power forecasting approach based on numerical weather prediction and error correction method,” in 2016 China International Conference on Electricity Distribution (CICED), 10-13 Aug. 2016 (Xi'an, Chinadio: IEEE), 1–4. doi:10.1109/CICED.2016.7576362
Tan, B., Ma, X., Shi, Q., Guo, M., Zhao, H., and Shen, X. (2021). “Ultra-short-term wind power forecasting based on improved LSTM,” in 2021 6th International Conference on Power and Renewable Energy (ICPRE), 17-20 Sept. 2021 (Shanghai, China: IEEE), 1029–1033. doi:10.1109/icpre52634.2021.9635314
Tang, C., Sun, J., Sun, Y., Peng, M., and Gan, N. (2020). A general traffic flow prediction approach based on spatial-temporal graph attention. IEEE Access 8, 153731–153741. doi:10.1109/ACCESS.2020.3018452
Tian, Y., Zhang, C., Metoyer, R., and Chawla, N. V. (2022). Recipe recommendation with hierarchical graph attention network. Front. Big Data 4, 778417. doi:10.3389/fdata.2021.778417
Verma, S. M., Reddy, V., Verma, K., and Kumar, R. (2018). “Markov models based short term forecasting of wind speed for estimating day-ahead wind power,” in 2018 International Conference on Power, Energy, Control and Transmission Systems (ICPECTS), 22-23 Feb. 2018 (Chennai, India: IEEE), 31–35. doi:10.1109/ICPECTS.2018.8521645
Xu, X., Gao, T., Wang, Y., and Xuan, X. (2022). Event temporal relation extraction with attention mechanism and graph neural network. Tsinghua Sci. Technol. 27, 79–90. doi:10.26599/TST.2020.9010063
Yan, J., Zhang, H., Liu, Y., Han, S., Li, L., Lu, Z., et al. (2018). Forecasting the high penetration of wind power on multiple scales using multi-to-multi mapping. IEEE Trans. Power Syst. 33, 3276–3284. doi:10.1109/TPWRS.2017.2787667
Keywords: wind power forecast, multi-sites, multiplex parallel, graph attention network, attention-based LSTM
Citation: He H, Fu F and Luo D (2022) Multiplex parallel GAT-ALSTM: A novel spatial-temporal learning model for multi-sites wind power collaborative forecasting. Front. Energy Res. 10:974682. doi: 10.3389/fenrg.2022.974682
Received: 21 June 2022; Accepted: 13 July 2022;
Published: 17 August 2022.
Edited by:
Tianguang Lu, Shandong University, ChinaReviewed by:
Zhenyuan Zhang, University of Electronic Science and Technology of China, ChinaZhaohao Ding, North China Electric Power University, China
Copyright © 2022 He, Fu and Luo. This is an open-access article distributed under the terms of the Creative Commons Attribution License (CC BY). The use, distribution or reproduction in other forums is permitted, provided the original author(s) and the copyright owner(s) are credited and that the original publication in this journal is cited, in accordance with accepted academic practice. No use, distribution or reproduction is permitted which does not comply with these terms.
*Correspondence: HongYing He, bGh4MjAwNzAzMjJAc2luYS5jb20=; FangYu Fu, ZmFuZ3l1ZnVAaG51LmVkdS5jbg==