 Tonglou Guo1
 Dongyu Fu
- 1Southwest Oil and Gas Company, SINOPEC, Chengdu, China
- 2Exploration and Development Research Institute, Southwest Oil and Gas Company, SINOPEC, Chengdu, China
Tight sandstone reservoir is characterized by ultra-low porosity, complex microporous structure and water residues, which shows different gas storage and transport mechanism from conventional reservoirs. Therefore, effective development of tight sandstone gas reservoirs is faced with technical challenges. Microporous structures, distribution mechanism of fluid is a basic issue in gas reservoir evaluation. In this work, we take gas reservoir in the 2nd member of Xujiahe Formation in Yuanba area as an example to analyze the microscopic feature of pore structure and fluid distribution. The three-dimensional digital core has been applied to represent the real microporous structure. Specifically, a digital core reconstruction method based on SEM and casting slice images has been proposed. Ultimately, the mechanism of distribution, mode of occurrence of water residues in tight sandstone reservoirs has been simulated and quantitatively analyzed. The results show that the water residues could been visualized and categorized into three modes, water mass in corner, water film on surface, and water column in throat. The water residues could cause dramatic influence on pore structures, active pore size could be decreased with rising residual water saturation, the magnitude falls by over 50%. In addition, grain size would affect the distribution of water residues, which shows different percentage in medium and fine sand. Pore connectivity is another characteristic factor to describe the microporous structures. In this study, cluster marking algorithm has been applied to obtain the pore connectivity in tight sandstone with different grain size. In medium sand, the pore connectivity is dramatically decreased with rising water saturation, the downward trend become slower when water saturation reaches to 60%. Compared to fine sand, the tendency variation appears when water saturation reaches to 40%. This paper provides an applicable method to reveal the micro-scale reservoir properties and fluid distribution mechanisms in tight sandstone gas reservoirs.
Introduction
China has large amount of unconventional oil and gas resources represented by tight gas, shale oil and gas reservoirs. In recent years, with the continuously in-depth oil & gas exploration and development, the unconventional resources have become increasingly important in China’s petroleum industry system (Tong et al., 2018; Zou et al., 2018; Li et al., 2019a; Ji et al., 2019; Jiao, 2019; Li et al., 2020). After the successful development of marine reef and shoal facies reservoirs in Yuanba area of northeastern Sichuan, the tight sandstone gas reservoirs of the upper triassic Xujiahe formation also showed a great potential of resource (Zhang et al., 2016; Long et al., 2020). Different from the conventional gas reservoirs, the tight sandstone gas reservoirs in Yuanba area are characterized by ultra-low porosity and permeability, complex porous structures and high initial water saturation resulting from complicated sedimentation and diagenesis (Guo, 2013), which brings challenges to the efficient development of the gas reservoirs. Matrix pores are the main fluid storage and transport space, the microstructures and physical properties directly affect the gas productivity (Li et al., 2019b). Therefore, it is necessary to study the micro pore structures and fluid distribution mechanisms of tight sandstone gas reservoir to clarify the influence on gas storage and flow.
The microporous structure is an umbrella term for pore throat distribution, size, morphology, connectivity and configuration (Qiao et al., 2019; Song et al., 2019; Zhu et al., 2019). These parameters are usually obtained by scanning electron microscopy (SEM), Nano/Micro-CT imaging, mercury injection, nitrogen adsorption and other experimental methods (Guo et al., 2018; Sui et al., 2018; Gou et al., 2019; Viktorovich et al., 2021). Micro/nano pores and fractures have been well developed and serious heterogeneity has been noticed in the tight sandstone reservoirs of the 2nd member of Xujiahe formation in Yuanba area. Consequently, the detailed investigation of the tight gas reservoirs was limited by the quality of coring and the experiment cost in present technical condition. The accurate characterization of microscopic pore structure and research of fluid distribution mechanism has been faced with technical challenges. As an emerging numerical simulation technique, digital core technology was featured by low requirements for core samples, adjustable parameters and repeatable experiment, leading to the large-scale application in research of unconventional reservoirs. H.K. Hasnan et al. (2020) applied X-ray Mico-CT scanner to obtain the microstructure of the sandstone layers at millimeter-to-centimeter scale, and digital core has been constructed to estimate the reservoir propertied and characterize the connectivity of sandstone layers in cooperation with core plug data. Lv et al. (2019) established the nanoscale 3-D pore network model considering the stress sensitivity by Scanning Electron Microscopy and nano-CT scanning. Sui et al. (2020) simplified the real pore structure to prolate ellipsoids, oblate ellipsoids and spheroids, and an elliptical-pore model of digital core has been proposed. To sum up, the method of pore structure characterization using digital core technology can be divided into two categories, experimental test method and numerical reconstruction method. The experimental testing method is to scan and observe the real core through physical experiment and get the digital core directly. Although this kind of method can get the real structure of core, the modeling quality is limited by the core quality and resolution of experimental equipment. The numerical reconstruction method can be achieved based on a small amount of real core information. Besides, this method showed strong repeatability, the reconstruction process can be modified whenever necessary.
In this paper, a modified numerical reconstruction method of digital core has been proposed. On the basis of SEM images in the second member of Yuanba Xujiahe gas reservoir, a digital tight sandstone core with micro pore structure and natural microfractures has been reconstructed. Furthermore, the digital core model has been verified by using some experimental data. In second part, the reconstructed digital core would be applied to quantitatively investigate the pore structure and physical properties of the reservoir fluid. In this study, a new insight for the microporous structure and reservoir fluid distribution mechanism of tight sandstone reservoir has been proposed which might provide theoretical support for the effective development of Xujiahe formation gas reservoir in Yuanba area.
Methods
In this study, a low-cost digital reconstruction method has been proposed. According to the method, we only used the SEM and casting slice images to obtain the structural properties. Firstly, the core samples acquired during drilling was evaluated by means of scanning electron microscopy. And the rock debris has been collected to make casting slice. Secondly, the SEM and casting slice images has been numerically analyzed to obtain the statistical characterization of the multi-scale porous structure. Thirdly, a modified model has been deduced to reconstruct the digital core based on the data from the second step.
Digital core reconstruction
To obtain the applicable information in the SEM and casting slice images, the images should be pretreated. The SEM images and casting slice images was displayed in Figure 1, Figure 2, respectively. Due to the different resolution, we use SEM images to obtain microporous structure of nano/microscale pores. And the casting slice images could be used to obtain the microfractures. Then, the numeralization process has been proposed to make connections between real pore structures and digital core models. As shown in Figure 3, it can be divided into three main steps. In step 1, the greyscale images have been manipulated by OTSU method to identify the pores and matrix (Ostu, 1979). In step 2, choose the optimized threshold value to binarize those images. In step 3, to extract the pore contours and count. Finally, we could obtain these parameters, the distribution of pores and throats, pore size, surface porosity and morphological factors, etc.
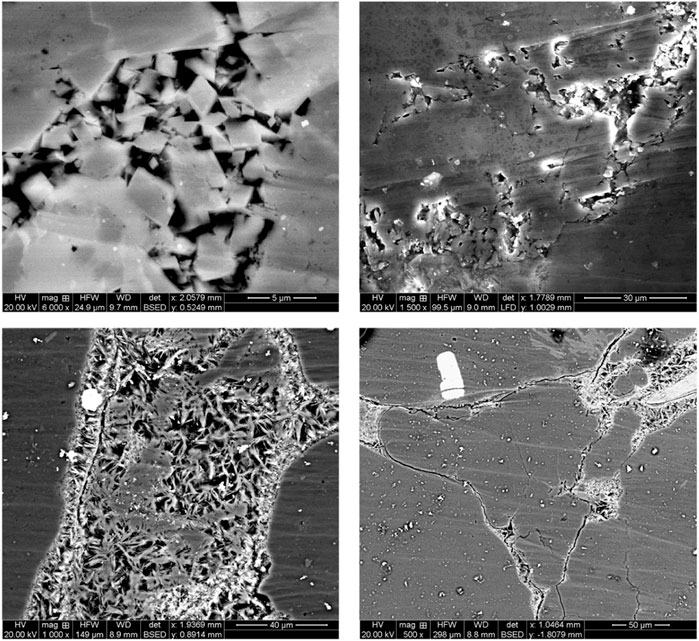
FIGURE 1. The SEM images of the second member of Yuanba Xujiahe gas reservoir.
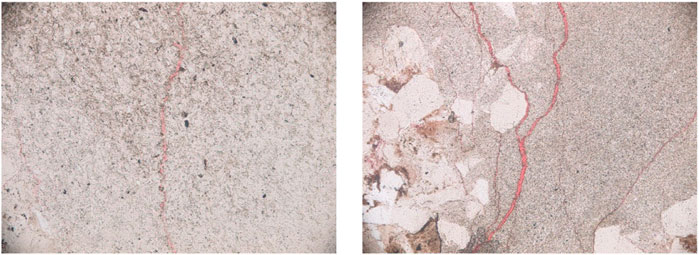
FIGURE 2. The casting slice images of rock debris from the second member of Yuanba Xujiahe gas reservoir.
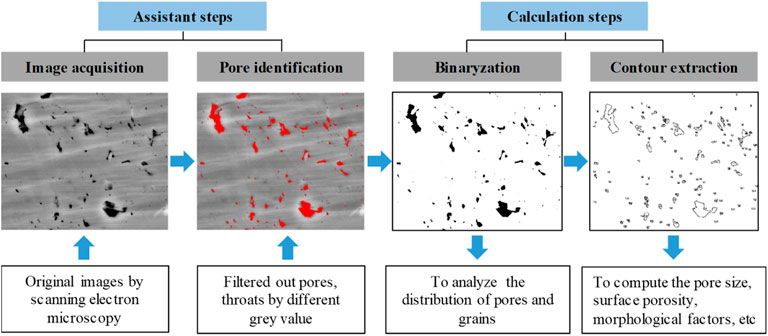
FIGURE 3. The workflow for numeralization process of core images (take SEM images as an example).
In this study, the Pearson coefficient was applied to quantitatively characterize the statistical distribution of congeners in porous media (Zhao et al., 2018). Pearson coefficient can be calculated by Eq. 1.
Among them:
z(x)-the definition of the particles in binarized images, dimensionless.
cov [z(x), z (x + h)]- the spatial covariance of z(x) and z (x + h), dimensionless.
D [z(x)], D [z (x + h)]-the spatial variance of z(x) and z (x + h), respectively, dimensionless.
In this work, the definition of Pearson coefficient can be simplified. According to Shen et al. (2015), the Pearson coefficient in 0–1 matrix could be obtained by Eq. 2.
Amang them:
E [z(x) z (x + h)]- mathematical expectation of z(x), z (x + h), dimensionless.
The Pearson coefficient of core samples has been obtained by using the procedures displayed in Figure 3. Firstly, pores could be identified by analyzing grey values of SEM images in assistant steps, then pore area has been remarked for the next steps. The following step is calculation step, including binaryzation and contour extraction. In the step of binaryzation, OSTU method has been applied to get pores and throats, so that the distribution of pores and grains could be analyzed. In step of contour extraction, the contour of pores and throats has been extracted for calculating the pore size, morphology factor, etc. After finishing all the procedures in Figure 3, the Pearson coefficient can be calculated. In this study, all the calculation steps has beem programmed, and results are displayed in Figure 4. As shown in Figure 4, all the Pearson coefficient shared a same distribution pattern. The magnitude of Pearson coefficient decreased with the rising h, and the reduction rate changed in descending order from 1 to maximum mesh grids. At this point, the relationship between real pore structures and digital core has been established, which was the important preparatory step for digital core reconstruction.
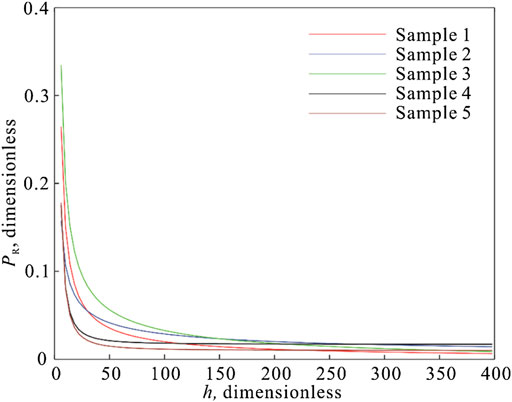
FIGURE 4. The magnitude of Pearson coefficient of core samples.
A specific numerical model has been applied to perform the digital core reconstruction after the preparatory step. In this study, we choose quartet structure generation set (QSGS) model to reconstruct digital cores (Wang et al., 2007). In this model, the porous media reconstruction can be performed by four parameters, probability of growth phase distribution Pcd, probability of particle growth Pdi, probability density Iim,n and porosity φ. However, the traditional QSGS model cannot control the randomness during modeling, which may cause large deviation from the real reservoir characteristics. Therefore, this model should be modified to control the randomness in order to ensuring the representativeness of reconstructed digital cores.
In this work, referring to Shen et al. (2015), a modified numerical model has been deduced by designing constraints for the modeling process. There has been two differentia compared to Shen’s model. Firstly, two parameters are set to control the modeling process, including Pearson coefficient and morphology factor. Secondly, the Constraint procedures has been upgraded from two steps to several necessary steps. In this modified model, Pearson coefficient is used to control the particle distribution, morphology factor is used to control the pore-throats shape. Pearson coefficient and morphology factor could be obtained by Eqs 2, 3, respectively.
Among them:
S-pore area, m2.
c-pore perimeter, m.
Specifically, the procedures of digital core reconstruction in this model are displayed in Figure 5. In the process, we set Pearson coefficient and morphology factor at two particles as objective function in each calculation step, the reference values are obtained by the analysis of core images. Moreover, the cut-and-try procedure has been used to guarantee against unacceptable deviation. Finally, the spacing h should be constantly increased until arriving the presupposed volume fraction. In summary, a modified digital core reconstruction model with multi-stage constrains. As shown in Figure 6, the digital core has been reconstructed with the 400 × 400 × 400 grid.
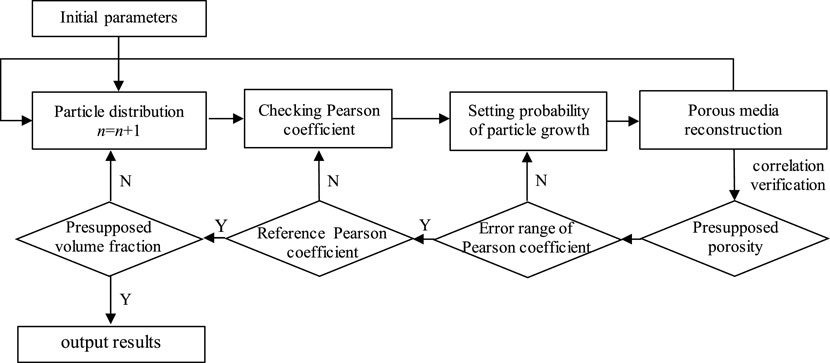
FIGURE 5. The flowcharts of digital core reconstruction.
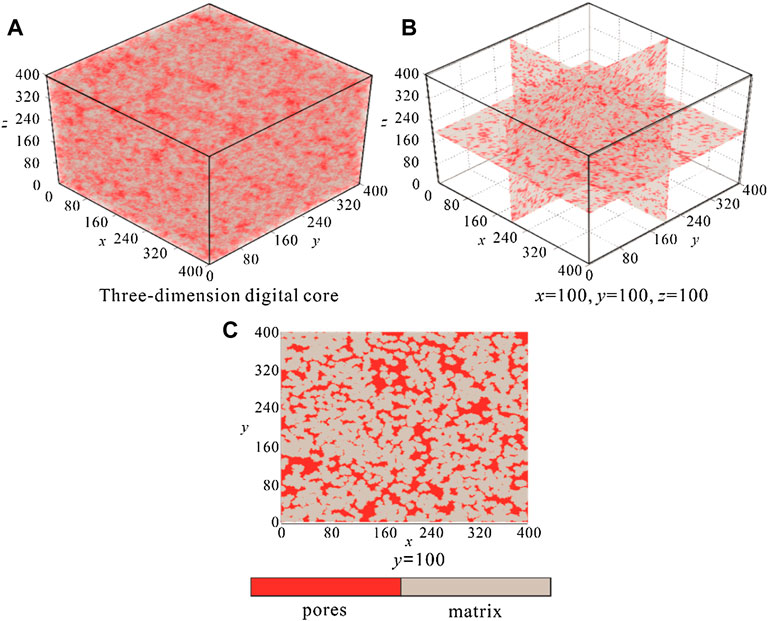
FIGURE 6. The three-dimensional reconstructed digital core by modified model (A); The slices (x, y, z = 100, respectively) of the three-dimensional reconstructed digital core (B); an exemplary profile map (y = 100) of the three-dimensional reconstructed digital core (C).
Validation
After reconstruction process, it is necessary to validate the accuracy of reconstructed digital core to ensure that it can effectively characterize the real microscopic pore-throat structure of the second member of Xujiahe reservoir in Yuanba area. In this work, we used two factors to validate the reconstructed digital core, including the spatial distribution of pores and the pore size. Firstly, the comparison of Pearson coefficient of two grid points between reconstructed digital cores and core samples has been displayed in Figure 7. In Figure 7, the Pearson coefficient in digital core is in good agreement with it in core samples, the maximum deviation is less than 5%.
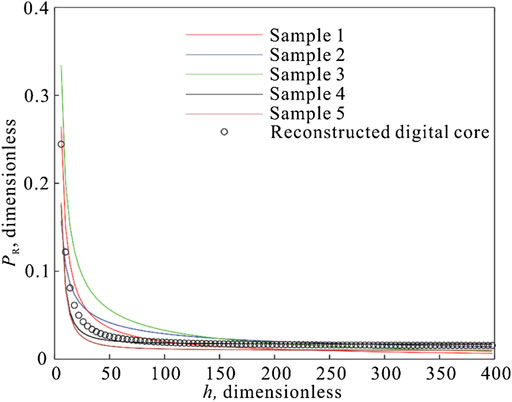
FIGURE 7. Comparison of Pearson coefficient of two grid points between reconstructed digital cores and core samples.
In this study, the pore size of core samples has been obtained by mercury injection experiment. And the magnitude of pore size in reconstructed digital core can be calculated by mathematical method called thirteen-directional average distance algorithm. As shown in Eq. 4, the pore size can be obtained by counting the distance among homogeneous grids in digital core.
Among them,
d (x0, y0, z0)-The average diameter of pores in digital core, μm;
Ni-The distance of a grid in pore space from the nearest matrix, μm.
The calculated magnitude of pore size of digital core and mercury injection data has been shown in Figure 8. It is found that the pore size of digital core shares the similar distribution pattern with mercury injection data. Specifically, the pore size of reconstructed digital core distributes mainly in 2–8.5 μm. Besides, the morphology features of reconstructed digital core has been testified. As shown in Figure 9, the morphology fators between digital core and core samples has been compared. Noteworthily, the only 3D CT results has been used to obtain the morphology factor of the core samples. The different morohology factor curves shows the similar distribution tendency, and the relative error value is less than 4.7%. Therefore, the reconstructed digital core is able to represent morphology features of the real cores.
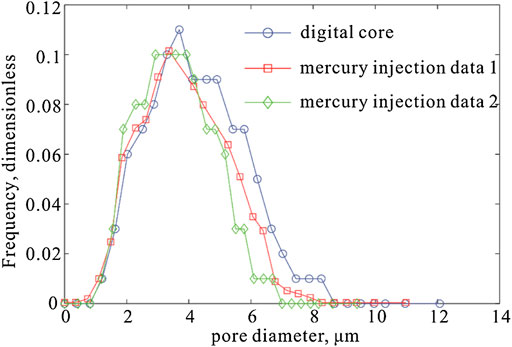
FIGURE 8. Comparison of pore diameter between reconstructed digital core and mercury injection data.
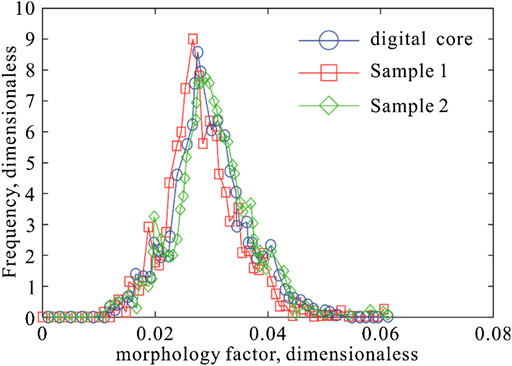
FIGURE 9. Comparison of pore diameter between reconstructed digital core and core samples.
In summary, according to the three-factor validation, the validity of our digital core model has been confirmed. That is to say, the reconstructed digital cores are applicable to characterize the real microporous structures in our target sandstone gas reservoirs.
Results and discussion
Pores and throats are the main space for formation fluid to store and transport. Consequently, pore structures and physical properties have a direct effect on gas productivity. In this section, the reconstructed digital cores would be applied to investigate the microporous structure and fluid distribution mechanism in tight sandstone reservoirs.
The mode of water storage in tight sandstone gas reservoirs
The water phase in gas reservoirs can be categorized to two types, mobile water and residual water (Zhong et al., 2020). The mobile water is a kind of liquid phase which could be driven to flow under certain conditions. The driving force can be the pressure difference, capillary force, etc. Correspondingly, residual water is not able to transport in any reservoir conditions, leading to the strong impacts on active porosity and pore-throat connectivity. According to the well logging data, the residual water saturation in 2nd member of Xujiahe reservoir in Yuanba area reaches up to 60%–80%, which poses great challenges to the further exploration and exploitation. Therefore, to quantitatively investigate the existing state of residual water and analyze the influences on pore-throat structure plays a key role in reservoir evaluation.
In this work, residual water would be located in digital cores referring to the core concepts of QSGS model. Initially, all grids in digital core would be traversed and checked, the void area could be found out. Secondly, the growing particles of water phase would be set in void area. Significantly, the solid boundary should be set as the stop point of growing step in the procedure code. Once arriving the presupposed saturation, the reconstructed digital core considering residual water could be carried out. As shown in Figure 10, the presupposed residual water saturation is 45%, and water phase randomly distributes in the pores and throats.
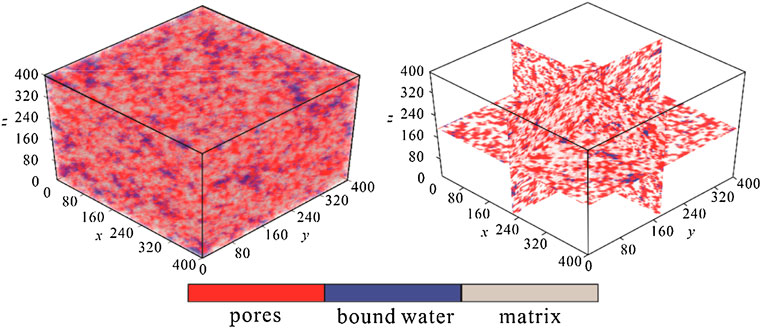
FIGURE 10. Reconstructed digital core considering residual water (residual water saturation is 45%).
To be more specific, the residual water can be classified to three categories by different mode of occurrence: water mass in corner, water film on surface, and water column in throat. As shown in Figure 11, the schematic diagram of different category of residual water has been displayed. Water mass in corner is a kind of water phase has stuck in blind holes or the corner of pores; Water phase distributes along the surface of pores and fractures, this kind of water has been named water film on surface; In addition, the water transports from large channels to smaller channels, it may stuck in the joint and gradually accumulated. The typical example in gas reservoir is that water phase flows through the pore-throat, so it can be called water column in throat.
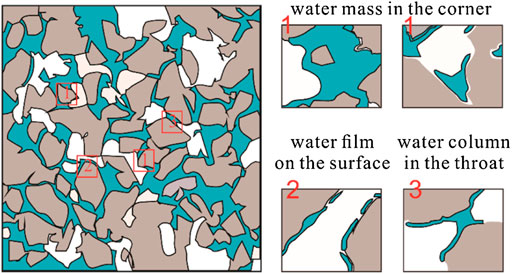
FIGURE 11. The schematic diagram of different category of residual water(revived according to He et al., 2020).
Different categories of residual water shows different mechanism. The amount of water mass in corner is mainly controlled by the surface tension, and pore morphology could be another important controlling factor. According to Hou et al. (He et al., 2020), the empirical equation of capillary force considering pore morphology can be obtained by Eq. 5. It indicated that pore morphology could pose impacts on capillary force, leading to the increasing water saturation. In our target reservoir, the morphology factor is 0.43, which means water phase could easily stuck in the intergranular-intercrystalline pores.
Among them,
r-The pore-throat radius, m;
F-The morphology factor, which can be calculated by Eq. 3, dimensionless;
As for water film on surface, the key mechanism is surface tension and adsorption. The capillary force is the dominant factor controlling the amount of water column in pore throat. In accumulation process, capillary force is regard as resistance to limit the gas alternating water (GAW). As shown in Eq. 5, the blocking effect could be increasingly serious with declining pore-throat radius. In fact, this phenomenon is known as Jamin effect.
Sensitive analysis
By the study above, it is cleared that residual water plays an important role on the pore-throats structure. In this part, the sensitive analysis has been performed to quantitatively investigate the influence of residual water on the pore structure.
Firstly, in order to reveal the pore size changes under different water saturation, the distribution of pore size with rising residual water saturation has been displayed in Figure 12. According to the tendency of pore size distribution shown in Figure 11, the active pore size decreases with rising residual water saturation, and the declining rate is growing. Statistically speaking, the magnitude of pore diameter ranges from 2 to 8.5 μm, the peak value is around 4.5 μm without considering residual water. In case that residual water saturation rises up to 80%, the magnitude of pore size reduces to 1.5–3.5 μm, which falls by over 50%. Secondly, we analyzed the percentage of different categories of residual water under given water saturation. Noteworthy, as for tight sand stone, varying grain size would have different pore-throat structures (Qi et al., 2021). In 2nd member of Xujiahe reservoir, the main lithology is defined as fine sand and medium sand. The percentage of different categories of residual water in fine and medium sands has been shown in Figure 13. According to this figure, in both of fine and medium sand, water mass in corner takes up the largest proportion, then water column in throat, water film on surface in descending order. It is noticeable that the percentage of all water residues has been changed with different grain size. The proportion of water mass in corner shows a decline trend compared between fine sand and medium sand. This phenomenon is resulting from the abundant blind holes and irregular pores in sand with smaller grain size. With rising grain size, the surface area of pore-throats is gradually increased. As a result, the water phase is more likely to adsorbed along the pore-throat surface. Compare to another water residue, the percentage of water column in throat changes little with the increasing grain size. The reason is that the variation of grain size cannot cause significant changes of pore-throat diameter. That is to say, the proportion of water column in throat remains almost the same.
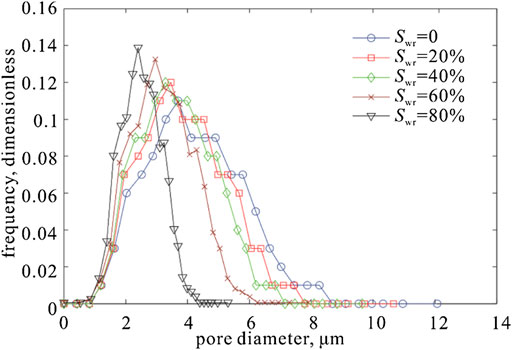
FIGURE 12. The distribution of pore size with different residual water saturation.
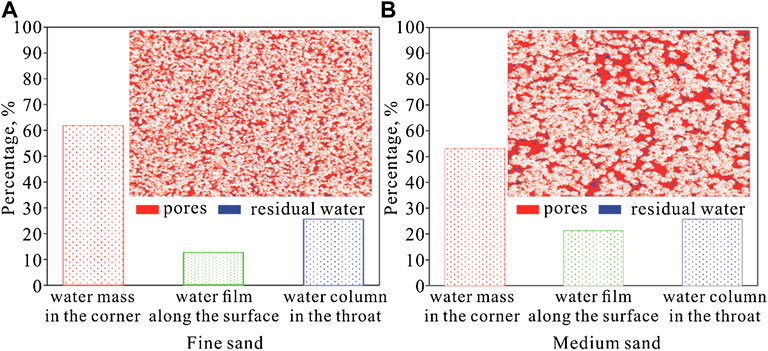
FIGURE 13. The percentage of various residual water in sandstones of different grain sizes (A) shows the percentage of various residual water in fine sand; (B) shows the percentage of various residual water in medium sand.
Pore connectivity is another important parameter affecting reservoir development. In fact, only the interconnected pores have a contribute to the gas transport. To count the magnitude of interconnected pores and obtain effective porosity is essential for the reservoir evaluation. In this study, we put emphasis on the variation trend of pore connectivity caused by residual water. The throat-to-pore coordination number has been applied to represent the degree of pore connectivity. In our digital core, cluster marking algorithm has been adopted to count the interconnected pores. The specific implementary procedures are shown in Figure 14. Firstly, all the grids in pore space would be coded sequentially. Once the adjacent grid changed in three-dimensional space, the coding procedure would be terminated, and then the new round of coding would start. Secondly, the isolated pores would be marked particularly. According to this method, the throat-to-pore coordination number of 2nd member of Xujiahe reservoir in Yuanba area ranges from 0 to 17, average value is 4.14.
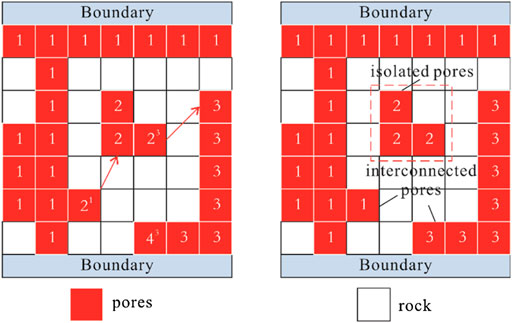
FIGURE 14. The schematic diagram of pore connectivity evaluation.
Furthermore, some interconnected pores would become clogging and even completely blocked by the residual water. As a result, the pore connectivity would be decreased to some degree. In this study, the variation of pore connectivity with changing water saturation in fine and medium sand has been analyzed. Figure 15 shows the variation of throat-to-pore coordination number with different residual water saturation. Specifically, the influence of grain size has been analyzed. In medium sand, the pore connectivity is dramatically decreased with rising water saturation. However, the downward trend become slower when water saturation reached to 60%. In fine sand, the curve shares almost the same trend with it in medium sand. But the tendency variation appears when water saturation reached to 45%. The results show that the influence of pore connectivity caused by residual water is more significant in fine sand.
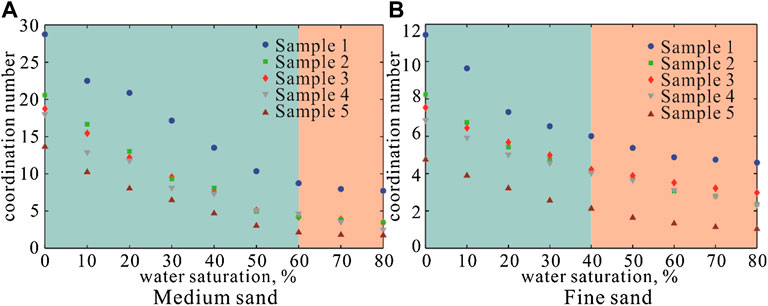
FIGURE 15. The variation of pore connectivity with increasing water saturation in sandstones of different grain sizes (A) shows the variation of pore connectivity with increasing water saturation in medium sand; (B) shows the variation of pore connectivity with increasing water saturation in fine sand.
Conclusions
In this study, a novel method to investigate microporous structure and fluid distribution has been proposed. Based on SEM and casting slice images of real cores, the traditional digital core reconstruction method has been modified by combining image processing techniques and geostatistics. Compared to the traditional algorithm, the proposed method can effectively avoid the randomness and increase the accuracy of simulation. Besides, aiming at the exploration and development of gas reservoir in 2nd member of Xujiahe reservoir in Yuanba area, the distribution of residual water has been visualized and categorized by simulating in the reconstructed digital core. Moreover, the influence on microporous structure caused by residual water has been quantificationally analyzed. Digital cores reconstructed by our method shared the similar statistical law with real reservoir characteristics, and the microporous structure could be precisely obtained. Based on the mode of residual water occurrence, residual water in 2nd member of Xujiahe reservoir could be divided into three categories, water mass in corner, water film on surface, and water column in throat. In both of fine and medium sand, water mass in corner takes up the largest proportion, then water column in throat, water film on surface in descending order. According to sensitive analysis, the active pore size decreased with rising residual water saturation, and the declining rate is growing. In case that residual water saturation raised up to 80%, the magnitude of pore size fell by over 50%. Varying grain size would have great influence on water residues, the percentage of water residues showed different features in medium and fine sand. Pore connectivity is another important parameter affecting reservoir development. In medium sand, the pore connectivity is dramatically decreased with rising water saturation, the downward trend become slower when water saturation reached to 60%. In comparison of fine sand, the variation curve shared almost the same trend with medium sand, but the tendency variation appeared when water saturation reached to 40%. This study provided an applicable method to reveal the micro-scale reservoir properties and fluid distribution mechanisms in tight sandstone gas reservoirs.
Data availability statement
The original contributions presented in the study are included in the article/supplementary material, further inquiries can be directed to the corresponding author.
Author contributions
TG: Conception and design of our study, Project administration, Supervision. DF: Methodoloty, Writting original Draft, Data curation, Validation. LX: Formal analysis, Coding, Software. YW: Data Curation, Review and Editing.
Funding
This study is supported by Sinopec. Specifically, the Sinopec Pilot Program Potential Evaluation of Xujiahe Formation Gas Reservoir in Northeast Sichuan (YTBXD-QTKF-2022-001-001).
Conflict of interest
TG, DF, LX, and YW were employed by the company Southwest Oil and Gas Company, SINOPEC.
Publisher’s note
All claims expressed in this article are solely those of the authors and do not necessarily represent those of their affiliated organizations, or those of the publisher, the editors and the reviewers. Any product that may be evaluated in this article, or claim that may be made by its manufacturer, is not guaranteed or endorsed by the publisher.
References
Gou, Q., Shang, X., Fang, H., Feng, Y., Zhang, B., Shu, Z., et al. (2019). Full-scale pores and micro-fractures characterization using FE-SEM, gas adsorption, nano-CT and micro-CT: A case study of the silurian longmaxi formation shale in the fuling area, sichuan basin, China. Fuel 253 (1), 167–179. doi:10.1016/j.fuel.2019.04.116
Guo, J., Li, Y., and Wang, S. (2018). Adsorption damage and control measures of slick-water fracturing fluid in shale reservoirs. Petroleum Explor. Dev. 45 (2), 320–325. doi:10.11698/PED.2018.02.15
Guo, T. (2013). Key controls on accumulation and high production of large non-marine gas fields in northern Sichuan Basin. Petroleum Explor. Dev. 40 (2), 150–160. doi:10.1016/s1876-3804(13)60018-x
Hasnan, H. K., Hassan, M., Wan, H. A., and Abdullah, W. H. (2020). Digital core analysis: Characterizing reservoir quality through thin sandstone layers in heterolithic rocks. J. Appl. Geophys. 182 (1), 104178. doi:10.1016/j.jappgeo.2020.104178
He, B., He, J., Zou, H., Lao, T., and Bi, E. (2020). Pore-scale identification of residual morphology and genetic mechanisms of nano emulsified vegetable oil in porous media using 3D X-ray microtomography. Sci. Total Environ. 763 (1), 143015. doi:10.1016/j.scitotenv.2020.143015
Ji, G., Jia, A., Meng, D., Guo, Z., Wang, G., Cheng, L., et al. (2019). Technical strategies for effective development and gas recovery enhancement of a large tight gas field: A case study of sulige gas field, ordos basin, NW China. Petroleum Explor. Dev. 46 (3), 602–612. doi:10.11698/PED.2019.03.19
Jiao, F. (2019). Re-recognition of “unconventional” in unconventional oil and gas. Petroleum Explor. Dev. 46 (5), 803–810. doi:10.1016/S1876-3804(19)60244-2
Li, T., Li, M., Jing, X., Xiao, W., and Cui, Q. (2019). Influence mechanism of pore-scale anisotropy and pore distribution heterogeneity on permeability of porous media. Petroleum Explor. Dev. 46 (3), 569–579. doi:10.1016/S1876-3804(19)60039-X
Li, Z., Duan, Y., Peng, Y., Wei, M., and Wang, R. (2020). A laboratory study of microcracks variations in shale induced by temperature change. Fuel 280, 118636. doi:10.1016/j.fuel.2020.118636
Li, Z., Duan, Y., Wei, M., Peng, Y., and Chen, Q. (2019). Pressure performance of interlaced fracture networks in shale gas reservoirs with consideration of induced fractures. J. Petroleum Sci. Eng. 178, 294–310. doi:10.1016/j.petrol.2019.03.048
Long, S., You, Y., Jiang, S., Liu, G., Feng, Q., Gao, Y., et al. (2020). Integrated characterization of ultradeep reef-shoal reservoir architecture: A case study of the upper permian changxing formation in the giant Yuanba gas field, sichuan basin, China. J. Petroleum Sci. Eng. 195 (6), 107842. doi:10.1016/j.petrol.2020.107842
Lv, W., Chen, S., Kong, C., Jia, N., He, L., Wang, R., et al. (2019). Evaluating seepage radius of tight oil reservoir using digital core modeling approach. J. Petroleum Sci. Eng. 178 (1), 609–615. doi:10.1016/j.petrol.2019.03.072
Ostu, N. (1979). A threshold selection method from gray-histogram. IEEE Trans. Syst. Man, Cybern. 9 (1), 62–66. doi:10.1109/TSMC.1979.4310076
Qi, Y., Ju, Y., Yu, K., Meng, S., and Qiao, P. (2021). The effect of grain size, porosity and mineralogy on the compressive strength of tight sandstones: A case study from the eastern ordos basin, China. J. Petroleum Sci. Eng. 208 (1), 109461. doi:10.1016/j.petrol.2021.109461
Qiao, J., Zeng, J., Jiang, S., Feng, S., Feng, X., Guo, Z., et al. (2019). Heterogeneity of reservoir quality and gas accumulation in tight sandstone reservoirs revealed by pore structure characterization and physical simulation. Fuel 253 (1), 1300–1316. doi:10.1016/j.fuel.2019.05.112
Shen, L., Wang, Z., and Li, S. (2015). Numerical simulation for seepage field of soil based on mesoscopic structure reconfiguration technology. J. Rock Soil Mech. 36 (11), 3307–3314. doi:10.16285/j.rsm.2015.11.036
Song, S., Liu, J., Yang, D., Hong, Y., Huang, B., Zhang, K., et al. (2019). Pore structure characterization and permeability prediction of coal samples based on SEM images. J. Nat. Gas Sci. Eng. 67 (1), 160–171. doi:10.1016/j.jngse.2019.05.003
Sui, W., Quan, Z., Hou, Y., and Cheng, H. (2020). Estimating pore volume compressibility by spheroidal pore modeling of digital rocks. Petroleum Explor. Dev. 47 (3), 564–572. doi:10.11698/PED.2020.03.12
Sui, W., Tian, Y., and Yao, C. (2018). Investigation of microscopic pore structure variations of shale due to hydration effects through SEM fixed-point observation experiments. Petroleum Explor. Dev. 45 (5), 894–901. doi:10.1016/S1876-3804(18)30099-5
Tong, X., Zhang, G., Wang, Z., Wen, Z., Tian, Z., Wang, H., et al. (2018). Distribution and potential of global oil and gas resources. Petroleum Explor. Dev. 45 (4), 727–736. doi:10.1016/S1876-3804(18)30081-8
Viktorovich, M. A., Viktorovich, G. D., Ivanovich, P. М., Anatol'yevich, F. S., and Olegovna, V. Y. (2021). 3D pore-scale modeling of nanofluids-enhanced oil recovery. Petroleum Explor. Dev. 48 (4), 825–834. doi:10.1016/S1876-3804(21)60080-0
Wang, M., Wang, J., Pan, N., and Chen, S. (2007). Mesoscopic predictions of the effective thermal conductivity for microscale random porous media. Phys. Rev. E 75 (3), 036702. doi:10.1103/physreve.75.036702
Zhang, L., Guo, X., Hao, F., Zou, H., and Li, P. (2016). Lithologic characteristics and diagenesis of the upper triassic Xujiahe formation, Yuanba area, northeastern sichuan basin. J. Nat. Gas. Sci. Eng. 35, 1320–1335. doi:10.1016/j.jngse.2016.09.067
Zhao, J., Fu, D., Li, Y., Jiang, Y., Xu, W., and Chen, X. (2018). REV-scale simulation of gas transport in shale matrix with lattice Boltzmann method. J. Nat. Gas Sci. Eng. 57 (1), 224–237. doi:10.1016/j.jngse.2018.07.008
Zhong, J., Yan, R., Zhang, H., Feng, Y., Li, N., and Liu, X. (2020). A decomposition method of nuclear magnetic resonance T2 spectrum for identifying fluid properties. Petroleum Explor. Dev. 47 (4), 691–702. doi:10.1016/S1876-3804(20)60089-1
Zhu, H., Zhang, T., Zhong, D., Li, Y., Zhang, J., and Chen, X. (2019). Binary pore structure characteristics of tight sandstone reservoirs. Petroleum Explor. Dev. 46 (6), 1220–1228. doi:10.1016/S1876-3804(19)60283-1
Keywords: tight sandstone gas reservoirs, digital core reconstruction, sandstone grain size, microporous structure, water residues
Citation: Guo T, Fu D, Xiong L and Wang Y (2022) The investigation of microporous structure and fluid distribution mechanism in tight sandstone gas reservoirs: A case study on the second member of Xujiahe gas reservoirs in Yuanba area. Front. Energy Res. 10:974655. doi: 10.3389/fenrg.2022.974655
Received: 21 June 2022; Accepted: 18 July 2022;
Published: 10 August 2022.
Edited by:
Yu Peng, Southwest Petroleum University, ChinaReviewed by:
Haiyan Zhu, Chengdu University of Technology, ChinaZhenglan Li, Southwest Petroleum University, China
Copyright © 2022 Guo, Fu, Xiong and Wang. This is an open-access article distributed under the terms of the Creative Commons Attribution License (CC BY). The use, distribution or reproduction in other forums is permitted, provided the original author(s) and the copyright owner(s) are credited and that the original publication in this journal is cited, in accordance with accepted academic practice. No use, distribution or reproduction is permitted which does not comply with these terms.
*Correspondence: Dongyu Fu, c3dwdWZ1ZG9uZ3l1QGhvdG1haWwuY29t