 Zhiheng Shen1
 Linjuehao Mei
95% of researchers rate our articles as excellent or good
Learn more about the work of our research integrity team to safeguard the quality of each article we publish.
Find out more
METHODS article
Front. Energy Res. , 25 August 2022
Sec. Smart Grids
Volume 10 - 2022 | https://doi.org/10.3389/fenrg.2022.974365
This article is part of the Research Topic Key Technologies, Markets, and Policies towards A Smart Renewables-Dominated Power System View all 13 articles
With the tightening restrictions on carbon emission globally, the carbon intensity of the economic is receiving more attention than ever, but the results obtained by conventional methods are not accurate enough for the responsibility division. To change this situation, a power flow tracking method aimed at the distribution networks and an electricity-consumption-based carbon intensity calculation framework are proposed in this paper. Firstly, to overcome the obstacles created by the three-phase asymmetries and the scale expansion of the networks while processing power flow tracing, a phase-split calculation regime and a high-efficiency power flow tracing method are proposed, respectively. On that basis, a whole-process carbon intensity calculation framework is reported. By adding simplified models about industrial production processes, this paper gives the calculation route from the energy consumption to the carbon intensity for each user in the distribution network. Finally, we emulated with the IEEE 34 bus and 123 bus test feeders and analyze the numerical results, to prove the efficiency and effectiveness of the framework proposed.
As the world pays more attention to the emissions of greenhouse gases, how to achieve the balance between carbon emission reduction and economic development has become a common concern of all social groups (Song and Xia, 2022; Yuan and Zheng, 2022). The carbon intensity of the economy (called carbon intensity, CI) refers to the carbon emission per unit GDP (U.S. Energy Information Administration, 2022), which represents the advanced level of low-carbon technology for a company or a group, comparing with peers. In order to make people more active in the low-carbon career, it is necessary to provide appropriate rewards and punishments for enterprises with different CI. The electricity carbon emissions account for nearly 50% of the total (Zhang et al., 2021), with the improving electrification in the production processes (Ciller et al., 2019; Wu et al., 2022), the carbon emissions related to the usage of the electricity should be taken into consideration when calculating CI. However, this type of carbon emission is unintuitive, so the tracking of the carbon emissions flow in the power system has become an integral part of CI calculations (Kang et al., 2015).
At present, two categories of methods are used to extract the corresponding relationship between electricity consumption and carbon emission, namely the statistical methods (Wang et al., 2013; Chen et al., 2018) and the carbon flow analysis methods (Sun et al., 2016; Cheng et al., 2020). On the one hand, the statistical methods calculate the total energy consumption in a long period of time. While being utilized in traditional distribution networks, the slight inaccuracy of these methods can be ignored considering the low penetration rate of renewable sources in the network, and its high-efficiency advantage is highlighted. However, for the active distribution networks with distributed renewable sources (Le et al., 2022; Ma et al., 2022), the calculation results of the statistical methods are too rough, to deduce the load users’ whole-process CI.
On the other hand, the carbon flow analysis methods are based on active power flow in the distribution network. The first step of these methods is to associate the electricity consumption of each load with the output electricity of the sources in the distribution network (power flow tracing, PFT). The second step is to calculate the carbon emissions efficiency of each power source in the distribution network, by dividing the gross carbon emission by the output active power of the source. Finally, calculate the carbon emission corresponding to all electricity consumption according to the above results. The utilization of these methods relies heavily on the amount and accuracy of data. As the distribution networks grow in size and operational complexity, the loss and the inaccuracy of required data are becoming inevitable (Deka et al., 2018; Huang et al., 2021), which causes difficulty in striking a balance between economy and accuracy when tracing the power flow by the conventional methods. Additionally, these PFT methods can only analyze the three-phase balanced power grids, which is unsuitable for the distribution networks with asymmetric loads and lines (Kwon et al., 2015; Tellez et al., 2015). However, the carbon flow analysis methods can achieve a fair division of carbon emission responsibilities in theory. Therefore, after correcting the deficiencies above, the carbon flow analysis methods can be utilized to calculate the CI of the distribution network’s users, efficiently and accurately.
After simplifying the power flowing model in the transformer with delta connections, this paper proposes a high-efficiency PFT method for the active distribution networks based on the radial nature (Arefi et al., 2020; Shaheen et al., 2021) of the networks. On that basis, a framework is proposed to calculate load users’ CI, which only needs the users’ electricity consumption and a small amount of the state information of the related distribution network. The innovations are as follows:
1) A method to separate the distribution network into three independent one-phase networks.
2) A subgraph selecting method for the selection of the required data, together with a high-efficiency PFT method for the selected data.
3) A CI calculation framework considering the carbon emissions related to the electricity consumption.
The remainder of this paper is organized as follows: Section II introduces the proposed PFT method for a three-phase unbalanced distribution network; Section III shows the CI calculation framework for the load users, and demonstrates the application mode of the framework with simplified models; Section IV verifies the efficiency and effectiveness of the proposed method and framework by analyzing the structures and numerical results of several IEEE test feeders; Section V concludes the paper and introduces the work plans in the future.
Due to the possible asymmetries in the loads, lines, and other equipment in the distribution networks, the power flow and the loads’ electricity consumption are relatively independent between phases. Therefore, for the accuracy of the final results, the proposed PFT method separates the three phases of the distribution network and calculates them independently. However, there are two major types of participants in the distribution networks that have power flow between phases, the loads and the transformers, and the solutions to these two obstacles are introduced respectively as follows.
For the loads. The active power input to each phase of all loads can be measured by the smart meters, and the values of the phase-wise loads are recorded as a matrix
As for the transformers. On the one hand, the transformers without delta connections can be directly regarded as the lines in the power-flow perspective, because there is no power flowing between phases. On the other hand, since the current in the delta circuit is not acceptable for the safety and stability of the distribution networks, the conditions that the asymmetric power flowing into the delta-connected transformers are extremely rare, and such situation will not be discussed in this paper. Additionally, the power flow in the transformer is distinct between different operation states, so further research about it is expensive and with limited benefits. Accordingly, we assume that the output power of each phase has the same power composition, that is, the output power of each phase is provided by all input phases, and each input phase accounts for 1/3. Figure 1 shows the power flow of a star-delta transformer. Assuming the transformers as the loads is good enough for the calculation process of the proposed PFT method, and the utilization of this power flow model is illustrated in Section 2.1.
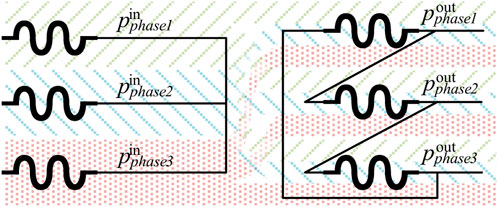
FIGURE 1. Power flow diagram of the star-delta transformer.
In practice, the first thing to do is to convert the other transformers into the lines firstly. At the same time, convert each transformer with delta connection into three loads, each load in a phase. Then, record the power flowing into each phase of the transformer as the related load in that phase. Considering that the load data is recorded phase by phase at the beginning, the distribution network has already divided into three independent networks after the above processes. Figure 2 shows the process of converting a three-phase asymmetric distribution network into three independent one-phase networks.
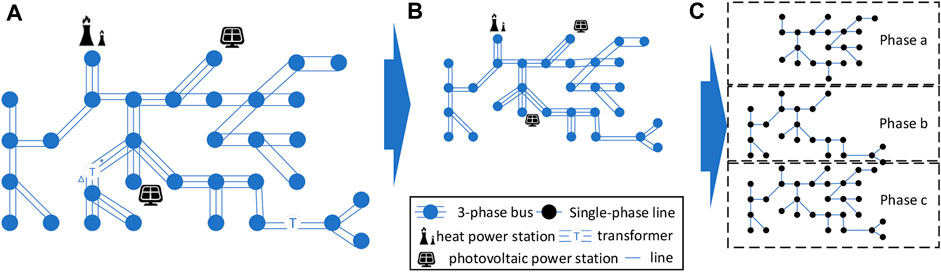
FIGURE 2. Flowchart of dividing the distribution network into three independent networks.
Due to the scale expansion of the distribution network, the cost for the data collection has risen sharply (Kaiyuan and Xueshun, 2018; Yahya et al., 2020). Thus, a PFT method that only utilizes minimal data is helpful to deal with this situation. To this end, we define the subnet in the distribution network with the following rules: all buses in the subnet can be connected to any bus in the subnet, and the connection route is composed of the buses and lines that belong to that subnet. At the same time, record the proportion of the power from different sources in the load as the power proportion (PP) of that load. It is obvious that in each one-phase network, the PP of the loads will be the same when the subnet’s power injection only happens in one bus. Based on the radial feature of the distribution network, this paper uses the above settings and proposes a PFT method that requires less data. The process of the method can be divided into three main steps, and the first step is to find the redundant data while processing PFT:
1) Converting the transformers with delta connections into three loads, each in a phase, the value of each load is the input power to the related phase of the transformer
2) Representing the distribution network as a graph, in which edges represent lines and nodes represent buses (Rusek et al., 2020), the features of each node is the same as those of the related bus.
3) Finding all nodes that are connected to power sources, and find the shortest path between each pair of these nodes (Krasnobayev et al., 2020).Then, recording all nodes on these paths as the minimum node set (MNS), and record the subgraph only including the nodes in the MNS as the minimum subgraph.
Clearly, for each subgraph obtained by the above processes, the quantity of the buses that has inflowing power is equal or less than 1. Therefore, the PP of the loads in the whole distribution network can be broadcasted by those in the minimum subgraphs. So, the second step is to analyzing the topology and power flow of the minimum subgraph, and calculate the PP of the loads in each phase of it. The specific method is as follows:
1) Generate three independent networks by the method in Section 2.2 and transform them into three one-phase graphs as in the first step.
2) For each graph, delete the nodes in the MNS, and divide the nodes and the lines remained into multiple subgraphs according to their connectivity.
3) Add the nodes in the MNS that are directly connected to each subgraph to that subgraph, if a node in the MNS is connected to multiple subgraphs, merge the node and the subgraphs into one subgraph. The subgraphs created in this step are denoted as remained subgraphs (RS), each RS is related to a single node in the MNS.
4) Record the total power consumption of each RS as the load of the related node. Then, use the traditional PFT method, to calculate the PP of the loads in the minimum subgraph.
The traditional power flow tracking method uses the proportion sharing principle (Rao et al., 2012) to analyze the power flow of the network, and obtain the position where all power from each source is finally consumed. The proportion sharing principle can be explained from two aspects: for the lines, among the power flowing at the beginning and end of a single line, the proportion of power from different power sources is the same; for the buses, the percentage of power from each input terminal is the same in each output terminal. Figure 3 shows the schematic diagram of the proportion sharing principle. Under the constraints of the above principles, a bus-by-bus iteration is used to calculate the PP for the loads in the minimum subgraph related to the three phases. The three-phase PP of the loads can be represented as the proportional matrix
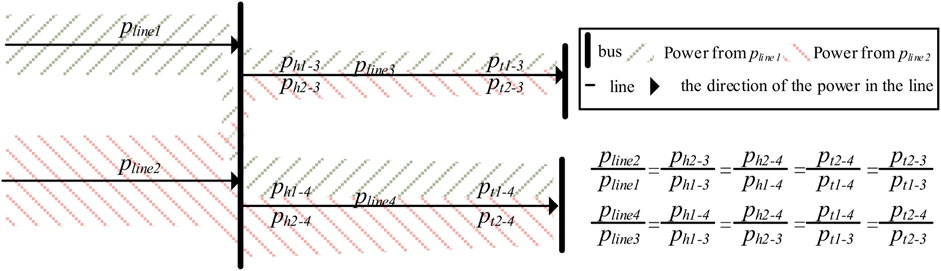
FIGURE 3. Schematic diagram of the proportion sharing principle.
The results above can be broadcasted to the loads outside the minimum subgraph, and by which, the result of the PFT can be deduced in the third step as:
1) While regarding the delta-connected transformers as loads, for each RS in each one-phase graph, the PP of loads in that RS is the same as the PP of the load which that RS was equivalented to.
2) According to the simplified power flow model of the transformer with delta connections in Section 2.2, for the transformer
where
3) For each load in the distribution network, obtain the power magnitude from the sources as:
The introduction of the proposed PFT method is above, and the flowchart of it is shown in Figure 4.
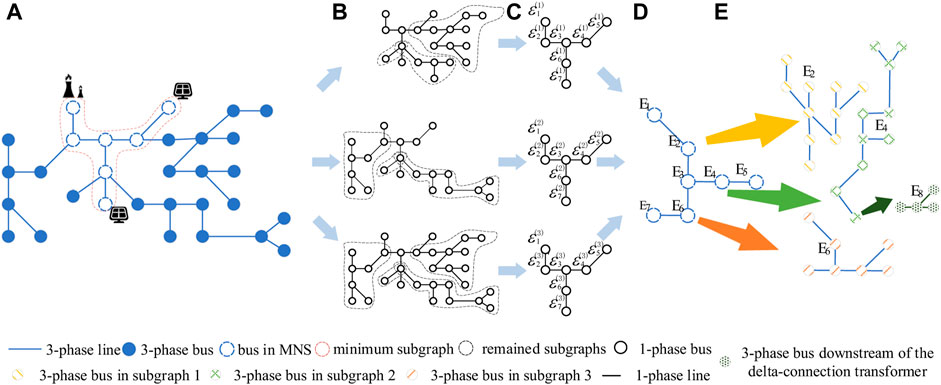
FIGURE 4. Flowchart of PFT method proposed in this paper.
According to the differences between the process of the proposed and the conventional PFT methods, it is clearly that the proposed method reduces the requirement of the data and while remaining the accuracy of the results, which will be verified in Section 2.2.
It is worth noting, when there are sources in both sides of the delta-connected transformer, the power-injection side should be calculated as a load firstly. Then, calculate the PP for the output power of each phase of the transformer. By treating the output of the transformers as the power sources, the PP of all loads in the network can be calculated by the proposed method.
Industrial Carbon emissions can be divided into the industrial process emissions and the energy consumption emissions. The former refers to the carbon emissions produced by physical or chemical changes other than combustion. The latter refers to carbon emissions deduced by fuel combustion and other forms of energy usage. At present, the carbon emissions related to the usage of combustion energy are based on the statistical methods. In those methods, the industrial process emissions are calculated by multiplying the referred carbon emission ratio by the product output, for each production. The energy consumption emissions are calculated likewise, and the referred ratio is multiplied by the consumption of electricity and fuels. Due to the uncertainty of combustion efficiency under different production environment conditions, the results are often insufficient. Considering the strong correlations between the usage of different types of energy, this paper makes a few assumptions and simplified models. Accordingly, we report a framework to calculate the whole process carbon emissions of the load users based on their electricity consumption, as shown in Figure 5.
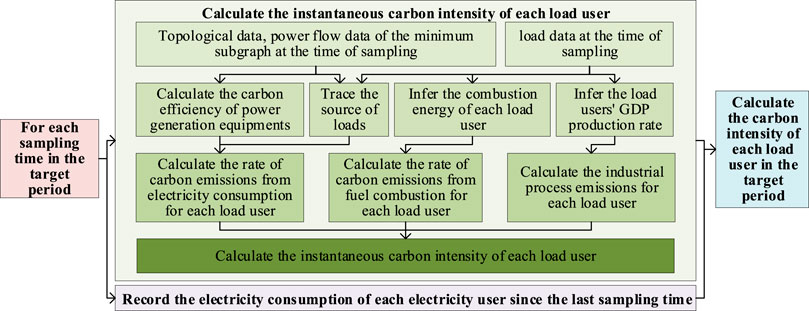
FIGURE 5. Flowchart of the CI calculation framework.
For the high-accuracy of the framework, the detailed information that describing the generation processes is indispensable for the construction of the models. Due to the fact that no model can achieves absolute unity in all situations, the simplified models are utilized to illustrate how the proposed framework extract CI from the electricity consumption. The models and the parameters are as follows:
The user corresponding to load
where
The corresponding relationship between the combustion power and carbon emissions of industrial users is similar to that of thermal power plants, and the expression is:
where
For the calculation of instantaneous CI: According to the operating status of the distribution network and the active power flowing to each load, by the PFT method Section 2.2 in and the parameters in Section 3.1, the instantaneous CI of the related user can be obtained. The calculation is as follows:
The carbon emission ratio conducted by electricity consumption for user
As for the CI calculations in a period of
We use IEEE 37-bus and 123-bus test feeder (namely feeder1 and feeder2) to verify the advancement and effectiveness of the method in this paper.
Firstly, we prove the necessity of dividing the distribution network into three phases for the PFT. There are only delta-connected generators in feeder1, the topology and the lines parameters of all three phases are the same, the phases are also symmetric. So, the result of the PFT will remain accurate whether the distribution network is divided into three independent networks. However, the topology diagram of each phase in feeder two is shown in Figure 6. There is topology inconsistency among different phases, and most of the loads are only connected to 1 or 2 phases of the network. Therefore, it is more convincing to divide the distribution network into three before processing PFT.
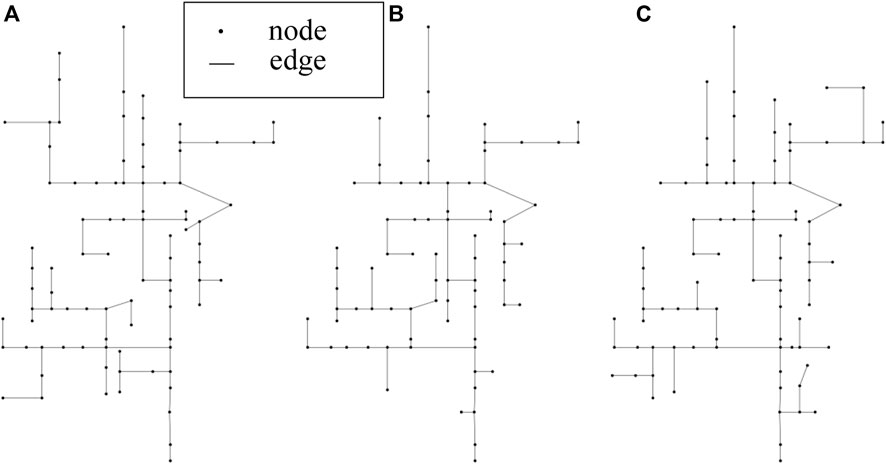
FIGURE 6. The topology of each phase in feeder2.
Then, this paper verifies the efficiency and the effectiveness of the data usage by using the method we proposed, the verification is divided into two aspects.
On the one hand, we calculated the reduction of the required data by comparing the quantity of the nodes in the minimum subgraph and the whole graph. Specifically, we add
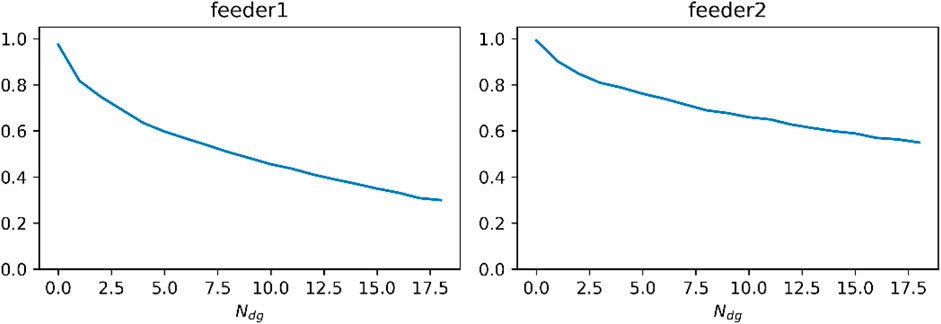
FIGURE 7. Percentage of data requirement reduction.
As shown in the figure above, the amount of the required data is greatly reduced by using the proposed method when processing PFT. When the quantity of the distributed sources is less than 1/5 of the number of buses, the amount of the required data is decreased by over 50%, and the efficiency of data usage is boosted by more than 100% in average. The result proves that the requirement of data has significantly reduced, which demonstrates the high efficiency of the method we proposed.
On the other hand, we verify the effectiveness of the proposed method. On the basis that the PFT is processed phase by phase, the conventional PTF method has already achieved people’s expectations to the fairness (Wang et al., 2022). Therefore, we verify the effectiveness of the proposed method by comparing the users’ carbon emission, which are deduced by the proposed method (PM) and the conventional method (CM), respectively. The emulation software is OpenDSS. 5 and 10 distributed photovoltaics are set in the feeder1 and feeder2 respectively, the power from the abspanntransformator is regarded as the power from one thermal power station, and its carbon emission efficiency is calculated by the formula in 3.1. The topology of the distribution network and the location of each distributed power generation equipment are shown in Figure 8. The photovoltaic output curve of each day is the standard curve shown in Figure 9 multiplied by a random number from 0 to 1. All parameters related to industrial production are random numbers. The input power of each load is generated by the minute as the average power for that minute, and the value of it fluctuates randomly between 0 and 1 times the initial value of the feeders. The load is sampled every 15 min to obtain the active power consumption of the load within 15 min, as well as the power at that moment. We use both PFT methods to obtain the carbon emissions related to the electricity consumption of each load in 1 month. The results are shown in Table 1, where each users’ ID (UI) corresponds to a load user.
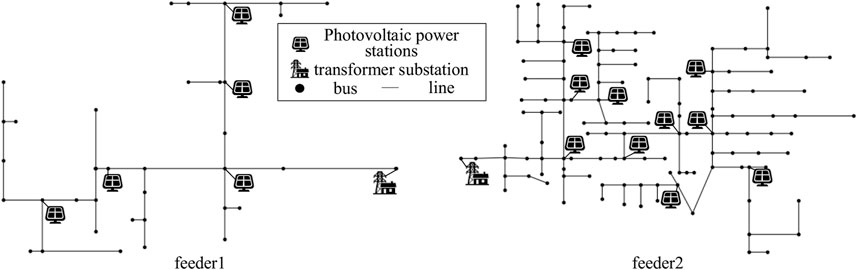
FIGURE 8. Schematic diagram of topology and photovoltaic location of feeder 1 and feeder two.
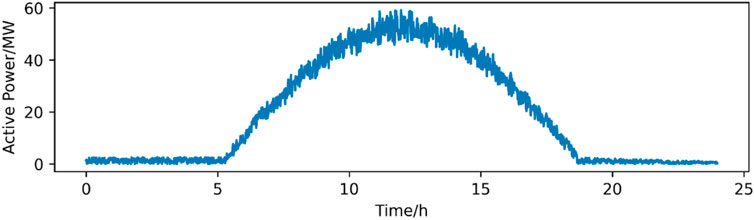
FIGURE 9. Standard curve of photovoltaic output.
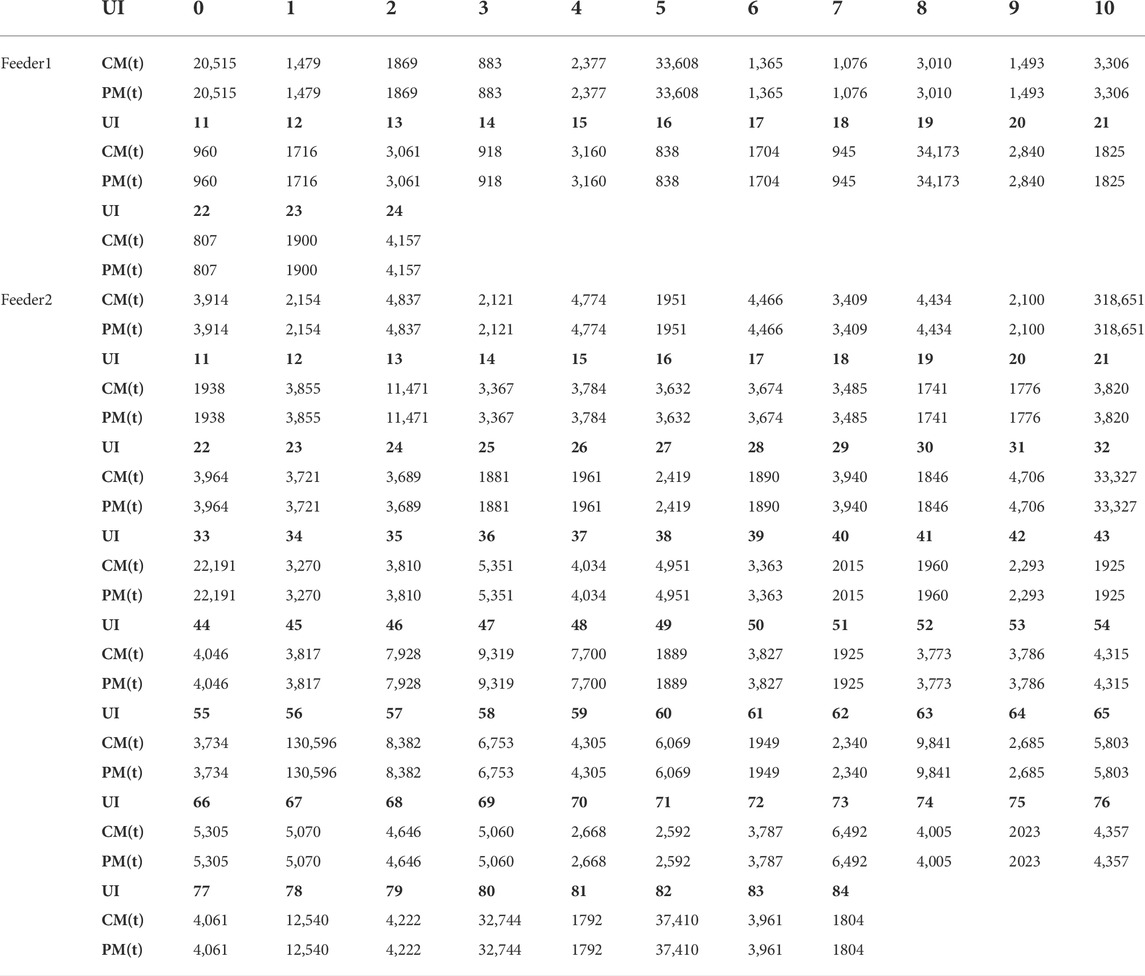
TABLE 1. Monthly carbon emission calculated by TM and PM.
By comparing the results calculated by the two methods, it can be found that the carbon emissions calculated by the two methods are equal for all users. Therefore, the method described in this paper uses only a small amount of data to achieve the trustworthy results that traditional methods require several times the data.
The monthly CI of each load users in both feeders are given in Table 2, in t/GDP.

TABLE 2. The CI of users in both feeders.
The data requirement of the conventional CI accounting method is different from which of the proposed method, these two methods are not comparable. So, we analyze the advantages of our method from a mechanism prospect. The proposed method has a much smaller requirement of the data quantity, because the usage of each type of production raw materials are not indispensable. At the same time, the proposed method can tell the difference in CI under different working conditions, instead of calculating all carbon emissions from energy usage by a standard ratio. In conclusion, the proposed framework has the potential boost the accuracy and efficiency when calculating the CI of each user.
In order to obtain a more accurate CI for the load users in the distribution network, this paper proposes a high-efficiency PFT method suitable for three-phase-asymmetric distribution networks. The proposed method splits the distribution network into three one-phase networks, and solves the obstacles brought by the asymmetries of the lines and loads in the network. Additionally, the method makes the best of the radial feature of the distribution network, and overcomes the challenges brought by the scale expansion of it. Furthermore, we proposed the simplified models describing the energy-carbon relationship of power sources, as well as the production processes of the load users. On that basis, a calculation framework about the users’ whole process CI is proposed. Although there are a few assumptions in the proposed framework, after perfecting the simplified model, the user’s CI can be obtained more precisely by the user’s electricity consumption.
In the future, we intend to additionally increase the precision and practicality of the CI calculation in two aspects. Firstly, we intend to focus on the distribution network with distributed storage devices, and study the flow of carbon emissions in the temporal and spatial dimensions. Secondly, we plan to use deep learning methods to replace the simplified models in this paper, and improve the accuracy of the results of the CI while maintaining the calculation speed.
The original contributions presented in the study are included in the article/Supplementary Material, further inquiries can be directed to the corresponding author.
All authors listed have made a substantial, direct, and intellectual contribution to the work and approved it for publication.
This study received funding from the Science and Technology Project of State Grid Zhejiang Electric Power Company Limited (No. B311JY21000B). The funder was not involved in the study design, collection, analysis, interpretation of data, the writing of this article or the decision to submit it for publication. All authors declare no other competing interests.
Authors ZS, YD, FS, and YS were employed by the company Economic Research Institute of State Grid Zhejiang Electric Power Company.
The remaining authors declare that the research was conducted in the absence of any commercial or financial relationships that could be construed as a potential conflict of interest.
All claims expressed in this article are solely those of the authors and do not necessarily represent those of their affiliated organizations, or those of the publisher, the editors and the reviewers. Any product that may be evaluated in this article, or claim that may be made by its manufacturer, is not guaranteed or endorsed by the publisher.
Arefi, A., Ledwich, G., Nourbakhsh, G., and Behi, B. (2020). A Fast Adequacy Analysis for Radial Distribution Networks Considering Reconfiguration and DGs. IEEE Trans. Smart Grid 11 (5), 3896–3909. doi:10.1109/tsg.2020.2977211
Chen, L., Sun, T., Zhou, Y., Fang, C., and Feng, D. (2018). Method of Carbon Obligation Allocation between Generation Side and Demand Side in Power System[J]. Automation Electr. Power Syst. 42 (19), 6. doi:10.7500/AEPS20171113004
Cheng, Y., Zhang, N., Zhang, B., Kang, C., Xi, W., and Feng, M. (2020). Low-Carbon Operation of Multiple Energy Systems Based on Energy-Carbon Integrated Prices. IEEE Trans. Smart Grid 11 (2), 1307–1318. doi:10.1109/tsg.2019.2935736
Ciller, P., Ellman, D., Vergara, C., Gonzalez-Garcia, A., Lee, S. J., Drouin, C., et al. (2019). Optimal Electrification Planning Incorporating on- and Off-Grid Technologies: The Reference Electrification Model (REM). Proc. IEEE 107 (9), 1872–1905. doi:10.1109/jproc.2019.2922543
Deka, D., Backhaus, S., and Chertkov, M. (2018). Structure Learning in Power Distribution Networks. IEEE Trans. Control Netw. Syst. 5 (3), 1061–1074. doi:10.1109/tcns.2017.2673546
Huang, C., Wang, W., Lu, J., and Kurths, J. (2021). Asymptotic Stability of Boolean Networks with Multiple Missing Data. IEEE Trans. Autom. Contr. 66 (12), 6093–6099. doi:10.1109/tac.2021.3060733
Kaiyuan, H., and Xueshun, Y. (2018). “A Data-Upload Strategy of Measurements for Lean Management in Distribution Network under Certain Communication Cost[C],” in 2018 China International Conference on Electricity Distribution (CICED), Tianjin, China, 17-19 September 2018.
Kang, C., Zhou, T., Chen, Q., Wang, J., Sun, Y., Xia, Q., et al. (2015). Carbon Emission Flow from Generation to Demand: A Network-Based Model. IEEE Trans. Smart Grid 6 (5), 2386–2394. doi:10.1109/tsg.2015.2388695
Krasnobayev, V., Kuznetsov, A., Yanko, A., and Kuznetsove, T. (2020). “Solving the Shortest Path Problem Using Integer Residual Arithmetic,” in 2020 IEEE International Conference on Problems of Infocommunications. Science and Technology, Kharkiv, Ukraine, 06-09 October 2020.
Kwon, J. H., Seo, M. C., Lee, H. S., Gu, J. h., Ham, J. h., Hwang, K. C., et al. (2015). Broadband Doherty Power Amplifier Based on Asymmetric Load Matching Networks. IEEE Trans. Circuits Syst. Ii. 62 (6), 533–537. doi:10.1109/tcsii.2015.2407197
Le, F. L., Martinez, M., Leonardo, J. O., and Pedro, E. M. (2022). Devices and Control Strategies for Voltage Regulation under Influence of Photovoltaic Distributed Generation. A Review[J]. IEEE Lat. Am. Trans. 20 (5), 731–745.
Ma, X., Liu, S., Liu, H., and Zhao, S. (2022). The Selection of Optimal Structure for Stand-Alone Micro-grid Based on Modeling and Optimization of Distributed Generators. IEEE Access 10, 40642–40660. doi:10.1109/access.2022.3164514
Rao, N. V. S., Rao, G. K., and Sivanagaraju, S. (2012). “Power Flow Tracing by Graph Method Using BFS Technique,” in 2012 International Conference on Advances in Power Conversion and Energy Technologies, Mylavaram, India, 02-04 August 2012.
Rusek, K., Suárez-Varela, J., Almasan, P., Barlet-Ros, P., and Cabellos-Aparicio, A. (2020). RouteNet: Leveraging Graph Neural Networks for Network Modeling and Optimization in SDN. IEEE J. Sel. Areas Commun. 38 (10), 2260–2270. doi:10.1109/jsac.2020.3000405
Shaheen, A. M., Elattar, E. E., El-Sehiemy, R. A., and Elsayed, A. M. (2021). An Improved Sunflower Optimization Algorithm-Based Monte Carlo Simulation for Efficiency Improvement of Radial Distribution Systems Considering Wind Power Uncertainty. IEEE Access 9, 2332–2344. doi:10.1109/access.2020.3047671
Song, Z., and Xia, Z. (2022). Carbon Emission Reduction of Tunnel Construction Machinery System Based on Self-Organizing Map-Global Particle Swarm Optimization with Multiple Weight Varying Models. IEEE Access 10, 50195–50217. doi:10.1109/access.2022.3173735
Sun, T., Feng, D., Ding, T., Chen, L., and You, S. (2016). “Directed Graph Based Carbon Flow Tracing for Demand Side Carbon Obligation Allocation[C],” in 2016 IEEE Power and Energy Society General Meeting, Boston, MA, USA.
Tellez, A. A., Galarza, D. F. C., and Matos, L. O. (2015). Analysis of Power Losses in the Asymmetric Construction of Electric Distribution Systems[J]. IEEE Lat. Am. Trans. 13 (7), 2190–2194. doi:10.1109/TLA.2015.7273776
U.S. Energy Information Administration (2022). 2005-2016 Independent Statistics and AnalysisEnvironment - Analysis & Projections State-Level Energy-Related Carbon Dioxide Emissions. Available at https://www.eia.gov/environment/emissions/state/analysis/.
Wang, C., Chen, Y., Wen, F., Tao, Y., Tao, C., and Jiang, X. (2022). Some Problems and Improvement of Carbon Emission Flow Theory in Power Systems[J]. Power Syst. Technol. 46 (5), 1683–1691.
Wang, C., Lu, Z., and Qiao, Y. (2013). A Consideration of the Wind Power Benefits in Day-Ahead Scheduling of Wind-Coal Intensive Power Systems. IEEE Trans. Power Syst. 28 (1), 236–245. doi:10.1109/tpwrs.2012.2205280
Wu, T., Wei, X., Zhang, X., Wang, G., Qiu, J., and Xia, S. (2022). Carbon-Oriented Expansion Planning of Integrated Electricity-Natural Gas Systems with EV Fast-Charging Stations. IEEE Trans. Transp. Electrific. 8 (2), 2797–2809. doi:10.1109/tte.2022.3151811
Yahya, S., Ndyetabura, H., Mvungi, N., and Lujara, S. (2020). “Low Cost Data Acquisition System for Electrical Secondary Distribution Network,” in 2020 6th IEEE International Energy Conference, Gammarth, Tunisia, 28 September 2020 - 01 October 2020.
Yuan, X. M., and Zheng, C. C. (2022). Evolutionary Game and Simulation Analysis of Low-Carbon Technology Innovation with Multi-Agent Participation. IEEE Access 10, 11284–11295. doi:10.1109/access.2022.3143869
Keywords: active distribution network, carbon intensity, asymmetric distribution, power flow tracing, power flow modeling
Citation: Shen Z, Dan Y, Qi M, Sun F, Sun Y and Mei L (2022) Efficient whole-process carbon intensity calculation method for power users in active distribution networks. Front. Energy Res. 10:974365. doi: 10.3389/fenrg.2022.974365
Received: 21 June 2022; Accepted: 18 July 2022;
Published: 25 August 2022.
Edited by:
Yang Li, Hohai University, ChinaReviewed by:
Han Wang, Shanghai Jiao Tong University, ChinaCopyright © 2022 Shen, Dan, Qi, Sun, Sun and Mei. This is an open-access article distributed under the terms of the Creative Commons Attribution License (CC BY). The use, distribution or reproduction in other forums is permitted, provided the original author(s) and the copyright owner(s) are credited and that the original publication in this journal is cited, in accordance with accepted academic practice. No use, distribution or reproduction is permitted which does not comply with these terms.
*Correspondence: Linjuehao Mei, MjIwMTAxMjZAemp1LmVkdS5jbg==
Disclaimer: All claims expressed in this article are solely those of the authors and do not necessarily represent those of their affiliated organizations, or those of the publisher, the editors and the reviewers. Any product that may be evaluated in this article or claim that may be made by its manufacturer is not guaranteed or endorsed by the publisher.
Research integrity at Frontiers
Learn more about the work of our research integrity team to safeguard the quality of each article we publish.