 Fei Chu1,2
 Xin Liu
- 1Nanjing University of Aeronautics and Astronautics, Nanjing, China
- 2Beijing Microelectronics Technology Institute, Beijing, China
- 3Northeastern University, Shenyang, China
The power detection of the distribution network is essential for reliable and secure distribution. In this paper, a flexible dual-threshold SVDD fault warning algorithm with fault samples is proposed to deal with problems concerning complex network topology, accessible data, and missing fault data in the power grid. For the problems of complicated network topology and a wide variety of signal types, we propose to combine wavelet packet energy features with Spearman to extract electric signal features, and finally achieve accurate feature extraction of multiple signal types. In the case of the problems of untimely judgement and low accuracy of the original SVDD, a relaxed SVDD fault warning algorithm with fault samples is correspondingly proposed. We turn the original SVDD boundary into a double-layer boundary, and divides the hypersphere space into three regions to increase the sensitivity to the fault samples and lessen the risk of missed detection. Besides, an adaptive update strategy is developed, which reduces the computational effort of the model and is proven more applicable to the distribution. Finally, the method is applied to numerical examples and fault detection experiments, and the experimental results in turn verified its effectiveness and superiority.
1 Introduction
The distribution, the last link of the power system, is directly responsible for meeting the responsibilities proposed by users for stability, safety, quality, and economy of electric energy, and reliable fault warning is necessary for the safe of the distribution network, making rapid fault warning of the distribution network necessarily important. The fault warning algorithms and methods introduced so far can be categorized as follows.
• Analysis based on expertise and prior knowledge
• Analysis based on artificial neural network
• Analysis based on data-driven
Expert system-based fault information analysis is applicable to some cases where the information obtained is incomplete (Yi and Etemadi, 2017; Wang X. et al., 2018; Peng et al., 2018). However, in recent years, the introduction of large amounts of distributed generation and loads have contributed to the exponential growth of the complexity of power systems in size and coupling. The coupling between these subsystems and components is still in the research phase and has not yet been clarified, make it difficult for this method to keep up with the exponentially growing network complexity and its applicability may be worse. Moreover, this method takes a long time to build the database and has less redundancy for errors, perfectly presenting its advantages over expert systems for fault warning.
The fault diagnosis method is based on the artificial neural network by keep simulating the human nervous transmission and processing of information (Gopakumar et al., 2015; Yansong et al., 2018; Fei et al., 2019; Guomin et al., 2019; Saizhao et al., 2019; Han et al., 2022). The literature (Saizhao et al., 2019) proposes an artificial neural network-based rapid diagnosis method for production line electricity for the existing fault detection methods with the problems of difficult threshold selection, low accuracy, and long detection time; A new method of fault detection and fault location is proposed in the literature (Gopakumar et al., 2015), which can achieve a better classification of fault types and a fast location of fault locations. Although the artificial neural network for equipment power fault processing speed also has good fault redundancy, it is subject to certain limits brought by the need for much data support. However, the production equipment power consumption information is limited and fault data to be collected is missing, which severely limit its application.
Instead of exploring the faults or fault models, the data-driven analysis approach analyzes the characteristics of the received signals and correlates them with fault states. Many algorithms have been proposed, such as principle component analysis, model analysis, etc (Feng and Zuo, 2013; Gritli et al., 2013; Joksimovi et al., 2013; Clemente-Alarcon et al., 2014; Hong and Dhupia, 2014; Lu et al., 2017). There have been some literature exploring data-driven methods for power system fault detection. The most commonly adopted schemes are various machine learning based classifiers, e.g. the Decision tree-based classifiers (Chouder and Silvestre, 2010) and the Support Vector Machine (SVM)-based classifiers (Zheng et al., 2018). Among them, Support Vector Data Description (SVDD) is widely used in the field of fault warning. SVDD can be established with a few samples and only normal samples, making it a new hot spot in the field of fault diagnoses such as real-time monitoring and fault warning. The existing problems of conventional SVDD and the ways to improve them are as follows. 1) For faulty samples, many current online SVDD algorithms choose to discard (Lei, 2009) or treat them as normal samples (Davy et al., 2006) and continue to use them, which can lead to great data waste and computational errors. The literature (Tax and Duin, 2004) points out that fault samples are rich invaluable, and the SVDD model can effectively improve the diagnosis accuracy by adding a few fault samples in the training. 2) In the applications, the criteria that distinguish whether the power system is faulty is fuzzy, the specific performance is that when the SVDD is training, the incorrect samples near the boundary have a great possibility to appear inside to become the new support vectors, and similarly the samples inside the model also have the probability to appear outside to become the wrong samples. Therefore, the similarity of these misclassified samples near the boundary in the applications will bring a certain detection error (Guo et al., 2009). The literature (Lei, 2009) proposes a dual threshold to distinguish misclassified samples from support vectors. The literature (Mu and Nandi, 2009) proposes a v _ SVDD algorithm to overcome the effect of wild points and noise appearing on the SVDD boundary.
However, a comprehensive analysis of all available signal types, that is, accurate feature extraction, is a condition and a crucial step for implementing fault warning. To address this challenge, the literature (Yilun et al., 2020) has studied the proposed point estimation method to calculate the currents in the power and extracted the electrical signal features by deep learning methods. In the case of improving feature recognition, the deep learning approach leads to large diagnostic model size and a long diagnostic time. In the literature (Lu et al., 2021), a single switching quantity information or electrical quantity information is used to judge the faults of power grid, it is demonstrated that multiple signal features can better improve the accuracy of grid fault detection. In the literature (Liu et al., 2019), this paper proposes a multi-source log comprehensive feature extraction method based on restricted Boltzmann machine (RBM), the RBM fully exploits the valid information in the grid signal to obtain more accurate signal features. In the literature (Xin et al., 2021), for the problems of low diagnostic accuracy and difficult feature extraction of microgrid, the microgrid fault diagnosis method of wavelet feature extraction and deep learning is proposed, and the final diagnostic accuracy was improved, but the effect of feature reproduction for grid signal was not obvious. Although the literature (Xiang et al., 2015) proposes a combined feature fusion approach for online fault diagnosis, it is limited to fusing only two features, which does not apply to scenarios with many signal classes and complex feature coupling associations.
Only a single type of signal is used for feature extraction in research methods and applications mentioned above. However, in the power distribution, many variables of the electricity-using network are measured and recorded, each containing some fault characteristics. This means that fault characteristics are irregularly distributed across multiple signals and that this complex nonlinear relationship is difficult to analyze. This requires a comprehensive analysis of all useful signals collected using novel data correlation techniques.
Thus, this paper aims to provide a new fault warning scheme for power systems. This method can be divided into two parts, i.e., wavelet packet energy entropy feature extraction with Spearman correlation analysis and a highly optimized resilient dual-threshold SVDD classifier. Wavelet packet decomposition is used to generate key feature combinations to lay the foundation for classifier construction; the elastic double-threshold SVDD algorithm introduces the idea of relaxed boundaries to increase the sensitivity to faulty samples.
The primary contributions of this paper can be summarized as follows.
• A novel feature extraction method namely wavelet packet-Spearman rank correlation feature extraction is proposed to analyze and fully exploit the correlation between different signal types., which is especially suitable for power distribution with complex network structures and coupling between signals;
• The flexible dual-threshold SVDD algorithm is proposed to form a variable double-layer discriminant boundary by introducing a relaxed boundary strategy, which effectively increases the discrimination degree of the model for fault samples and greatly reduces the diagnostic false alarm;
• An online adaptive update strategy over time is proposed, which greatly reduces the computational effort of the model and makes it widely applicable to fault warning with various system signals delivering complex and strongly coupled signals.
The rest of this paper is organized as follows. In Section 2, the wavelet packets, Spearman correlation, and other related theories are proposed. In Section 3, the WPDSR- SVDD framework and technical details of the proposed paper are given. Section 4 partly presents the comparative experiments and experimental results of the proposed method and other methods. And Section 5 concludes the paper.
2 Feature extraction related work
Feature extraction is the basis for achieving fault warning. Extracting the key and accurate features can directly affect the performance and correctness of the fault warning model. However, the topology of the power network is complex, and the voltage and current signals collected by PMUs have problems such as difficult processing, inconsistent magnitudes, and large correlations, which require a comprehensive new data feature extraction method. Therefore, the wavelet packet energy entropy method is hereby proposed to solve the gauge nonuniformity problem and combines it with Spearman correlation analysis to fully exploit the effective information between different signal types.
2.1 Wavelet packet decomposition
In actual application, there are many signals reflecting the information of equipment characteristics, such as voltage, current, power, power factor, and other electrical signals, and these signals have the problems of non-uniformity of magnitude and correlation with each other. To extract uniform, comprehensive and accurate features, more comprehensive and suitable methods are needed. In recent years, wavelet packet analysis has a more flexible time-frequency plane of the signal, and it also has a good analysis effect on the high frequency part. After the wavelet packet decomposition of the energy, entropy can also be clever to achieve the purpose of scale unification. Therefore, this paper decomposes many different types of signals using the wavelet packet analysis method (WPD) and then a uniform magnitude is obtained by extracting the energy entropy. WPD is specifically described as follows (Rafiee et al., 2009).
Where
Where
2.2 Spearman correlation
The above-proposed wavelet packet decomposition method, although can effectively extract the features of a single class of signals and achieve the purpose of unifying the magnitude by extracting the energy entropy. However, this is not enough. There are many types of signals reflecting the state of the equipment mentioned earlier which means that the fault features will be irregularly distributed in multiple signals, and these signals will jointly affect the state of the system. Besides, only feature extraction of a single signal type will lead to the loss of correlation information in the extracted feature information, which will affect the accuracy of the SVDD model. Therefore, methods to fully exploit the correlation between different signal types are also needed, and this paper proposes Spearman rank correlation combined with wavelet packet energy to analyze and extract the exact features.
Spearman correlation analysis is used to assess the correlation between two variables. It requires the observations of the two variables to be paired with rating information or rating information obtained by transforming observations of continuous variables, without considering the overall distribution pattern of the two variables and the size of the sample size. For every two vectors
Where,
Where,
2.3 Feature extraction
In summary, wavelet packet analysis can fully decompose the collected signal, and it is also provided with the property of energy conservation. Thus, it can not only achieve a uniform signal magnitude, but also determine how much feature information is contained by comparing the energy level after decomposition. The higher the energy of the nodes means that the more feature information contained, the more obvious the features. Additionally, the application of Spearman rank correlation can ensure the wavelet packet decomposition while analyzing the correlation between different signal types, so that energy features with more accurate and fuller feature information can be extracted in the end. The specific implementation steps can be expressed as follows following Perceval’s constant equation:
From the equation, it can be seen that the square of the wavelet packet coefficients has a quantum of energy. Select appropriate wavelet basis functions for J-layer wavelet packet decomposition, and obtain the number of bands of M.
Where,
To extract more accurate and richer features, after first wavelet packet decomposition and extracting the energy share by Eq. 11, then applying Eq. 8 to the extracted energy features for correlation analysis, and finally finding the exact energy combination features. The result is shown in Eq. 12.
The energy occupation ratio calculated by wavelet packet decomposition is directly used as the feature set, and the results are shown in Table 1.

TABLE 1. Energy contribution.
As is shown in Table 1, the contribution of each signal as a feature set is 20%, failing to reflect the influence of their relationship on the energy features. Since the energy share calculated after wavelet packet decomposition can only characterize one signal type, the correlation between the signals is explored to fully extract the signal features. The analysis method of Spearman’s correlation is introduced to analyze the correlation between each signal, and the correlation between each signal is calculated according to Eq. 12, as is reflected by the change in the contribution of each signal as a feature set, which is shown in Table 2.

TABLE 2. Sr energy contribution.
As is shown in Table 2, Spearman correlation analysis can characterize the correlation between the different signals, i.e., the change in the characteristic contribution of each signal. The change from Table 1 lies in the increased contribution of current and power.
3 Proposed fault diagnosis method
In this paper, a novel flexible dual-threshold SVDD fault warning algorithm with fault samples is proposed, which adds the fault samples to the SVDD training and proposes a relaxation boundary, and introduces an offset factor. The trained model uses online power network signals for fault warning. The overall flow of fault warnings is shown in Figure 1.
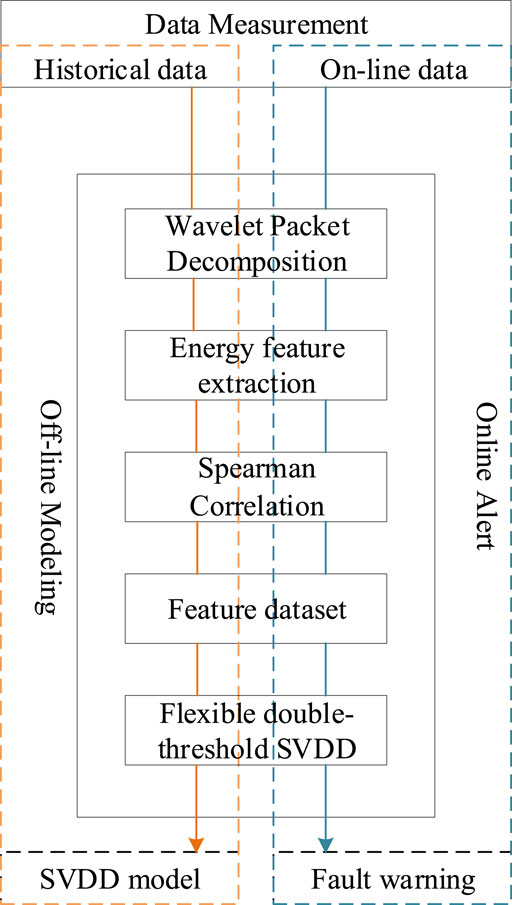
FIGURE 1. Overall flow chart of the fault warning.
3.1 SVDD-related studies
Since in production, the power will always be in steady state, with few or no fault states. Therefore, the data collected by PMUs are mostly normal samples, and fault samples are seriously missing. It also limits the application of other methods. For example, expert systems, artificial neural networks, and other models require a large number of fault samples for training.
Compared to other related works, SVDD shows uniqueness about the lack of failure samples. Its essence of SVDD is to map feature samples to a high-dimensional space through a mapping relationship to find an optimal description boundary that can contain all feature samples as much as possible. The essence of constructing an optimal description boundary is to solve a quadratic optimization problem, only if all samples
Where,
The key factor affecting the accuracy of the model is the shape of the optimal description boundary, and the key factor determining this shape is the sample located on the hypersphere boundary known as the support vector. Therefore, an accurate judgment of whether it can be a support vector sample is crucial. In the power distribution, there is the aging of the power equipment, which leads to deviations between the collected data and the original equipment data. In other words, when the model works with samples that are located outside the boundary but close to it, the traditional model would consider them as faulty samples, which is actually not entirely true. It would lead to a false alarm risk for the model. Similarly, there is a great possibility the samples located inside the hypersphere boundary close to the boundary are with fault warnings, which can lead to the problem of missed detection in the model.
3.2 Flexible double-threshold SVDD
As mentioned in the previous section, the conventional SVDD directly compares the size of sample distance and hypersphere radius, which will produce serious false alarms and missed detections. To better divide the samples and improve the discriminative accuracy of the hypersphere boundary for the samples on both sides, this paper introduces the idea of a relaxed boundary and proposes a ball boundary offset discriminative criterion. First, define the ball boundary offset factor.
Where,
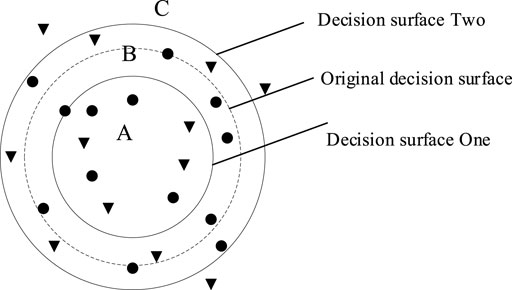
FIGURE 2. Flexible double-threshold SVDD.
The thresholds
In production practice, missed inspection is more serious than a false alarm, which will seriously endanger the safety of equipment operation and bring greater losses. Therefore, the upper limit of
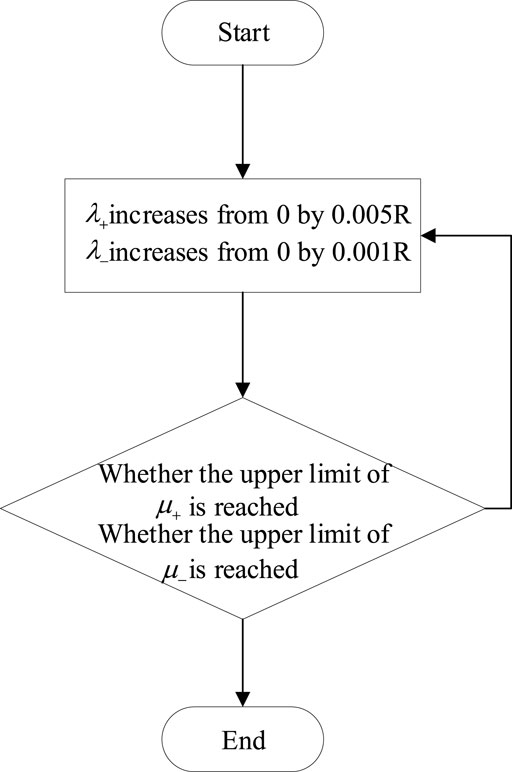
FIGURE 3. Process for determining the threshold values
3.3 Adaptive update policy
The basic idea of model updating is to continuously add newly-collected sample data while eliminating the same number of original samples to form a new set of samples for retraining the SVDD model. The introduction of this update idea overcomes the disadvantages of frequent updates and large computation of the SVDD model, improves the algorithm efficiency, and makes it more suitable for real-time online fault warning of the distribution power. Samples entering area B cannot be directly considered normal or faulty samples.
The ideal situation for fault warning is to enter test data with normal samples located in area A and faulty samples located in area C. Due to the complex working conditions of the power system network equipment, a large amount of noise is likely to be mixed in the signal, and several samples will enter the B region. The method adopted in this paper is to count and record the proportion of samples entering the B region for the samples to be detected, and set the alarm threshold
1) If
2) If
3) If
4) If
5) If
6) If
In summary, when the test sample is located in the C region, i.e.,
4 Experiments
4.1 Simulation model and parameterization
Wide area measurement system (WAMS) using PMUs has been widely deployed worldwide in recent years. WAMS can measure and transmit multiple signals according to the GPS synchronized clock. PMUs can use GPS signals for simultaneous voltage and current measurements to analyze and provide information such as frequency, phase, and amplitude. These signals are collected and transmitted to the master station at each sampling moment. Therefore, the data can be synchronized for grouping and storage. The standard IEEE 14-bus power system is established using the PSCAD/EMTDC to verify effectiveness and superiority of the proposed method. The network structure and configuration of the simulation model is shown in Figure 4. The frequency of this standard model is 60Hz, so the sampling frequency is 6 kHz which is achievable because the PMUs can sample ten thousand points per second. According to the Nyquist’s sampling law, this sampling frequency is greater than the system state. In addition, the generator power and the load power in this experiment are also shown in Figure 6.
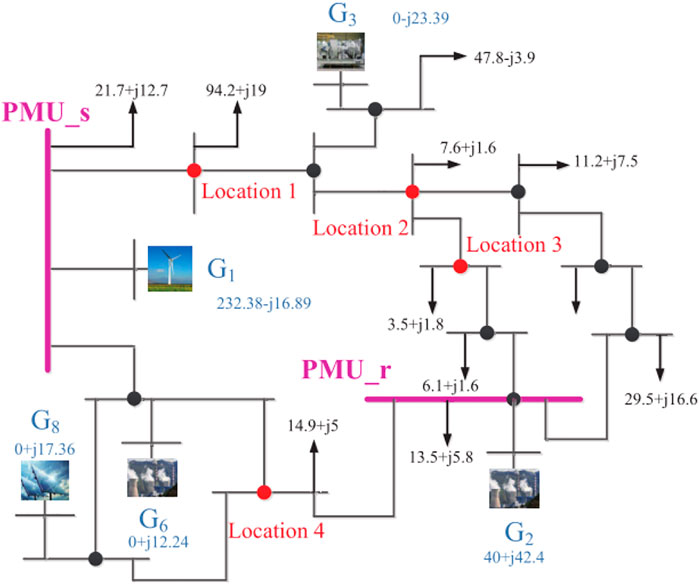
FIGURE 4. Simulation model built in PSCAD/EMTDC.
4.2 Wavelet packet -spielman feature verification
The signals collected through PMUs are electrical signals such as voltage, current, active power, reactive power, and power factor, which possess different scales and therefore need to be standardized. The wavelet packet energy decomposition is applied to unify into energy features. The energy share of five different signals after wavelet packet decomposition is shown in Figure 5.
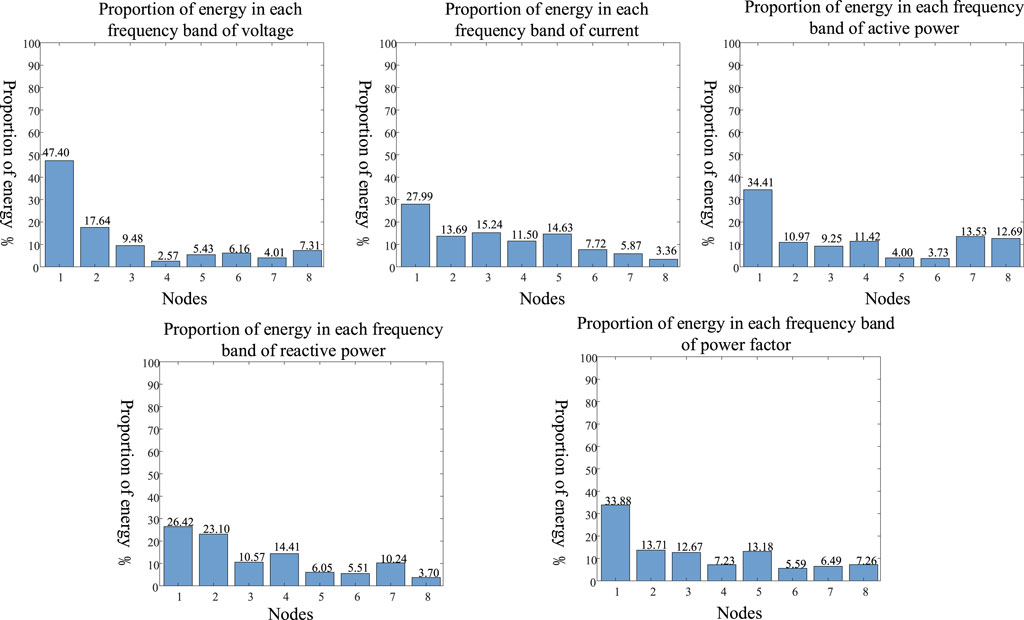
FIGURE 5. Energy share of the five signals after decomposition.
According to the energy conservation law, a fundamental property of wavelet decomposition above, the larger the energy share of the wavelet packet decomposition band is, the more obvious the reflected characteristics will become. Therefore, according to Figure 5, it is concluded the five different signals all have the largest energy share at the first node after decomposition. By extracting the maximum energy value and calculating the energy share of each signal, the combined characteristics of the uniform magnitude are obtained. As shown in Figure 5, it can be seen that the wavelet packet decomposition yields eight nodes, and all five signal types are the first node with the highest energy, so the first node energy value is used as the combined feature. If each letter does not interfere with each other and has independent features, the combined energy features are assigned the same weights; however, under operating conditions, there is a complex coupling between power system power signals, so Spearman rank correlation is introduced to calculate the coupling between each feature and recalculate the weights to get a more accurate energy share. A comparison of the energy characteristics after adding the Spearman rank correlation is shown in Figure 6.
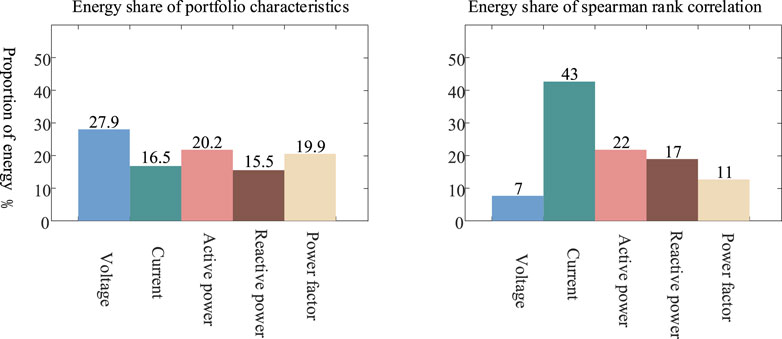
FIGURE 6. Comparison of energy characteristics.
As shown in Figure 6, the proportion of energy characteristics has changed significantly after adding Spearman’s rank correlation, from approximately the same role of each signal, i.e., the signals are independent of each other, to the dominant role of the current, which forms a mutual “constraint” relationship with other signals. This also confirms that in industrial production power systems, the complexity of the environment leads to strong coupling between signals, so the direct use of energy features as a feature set is not sufficient and will affect the diagnostic accuracy of the early warning model. To investigate the effectiveness of the proposed method, the original energy features with the addition of Spearman rank correlation are input into the SVDD model. The diagnostic accuracy, and the diagnostic elapsed time of the two methods, are shown in Table 3.

TABLE 3. Feature comparison.
In Table 3, without considering the coupling between features, the diagnostic accuracy is significantly lower than that of the feature combinations with the addition of Spearman’s rank correlation. Besides, there is almost no loss in diagnostic elapsed time, which further verifies the effectiveness of the improved feature extraction method proposed in this paper, and improves the diagnostic accuracy while ensuring the diagnostic elapsed time.
4.3 Verification of WPDSR- SVDD
To fully validate the performance of the proposed method in this paper, three levels of experiments are conducted separately, starting with the combined energy features extracted above as the feature dataset. Fault warning is performed on PMUs acquired signals using raw SVDD-based, SVDD-based with fault samples, and WPDSR-SVDD-based, respectively. The number of normal samples and faulty samples are set as
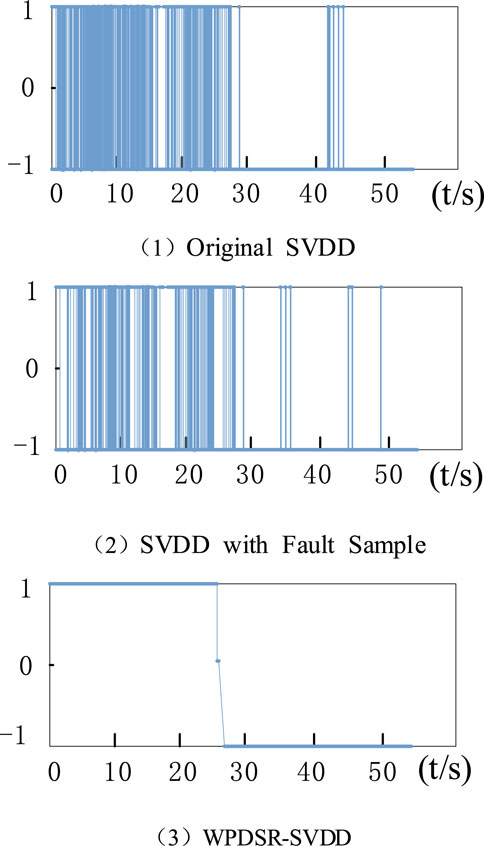
FIGURE 7. Comparison of three algorithms.
Comparing Figure 7 (1) to (3), it is obvious that the original SVDD has serious false alarms and missed detections. Although the SVDD algorithm with fault samples can improve the diagnosis accuracy to a certain extent, it still cannot solve the problem of false alarms and missed detections, resulting in the diagnosis accuracy is still not high. The proposed method in this paper, however, can effectively warn the faults that appear in the power system and gives early warning signals in the pre-fault stage. It shows that the WPDSR-SVDD algorithm can improve the early warning accuracy while effectively avoiding false alarms and missed detections in the diagnosis process. Then, the diagnostic accuracy of the three algorithms has been modeling time-consuming as shown in Table 4. From the table, it is obvious that the proposed method in this paper has high effectiveness.
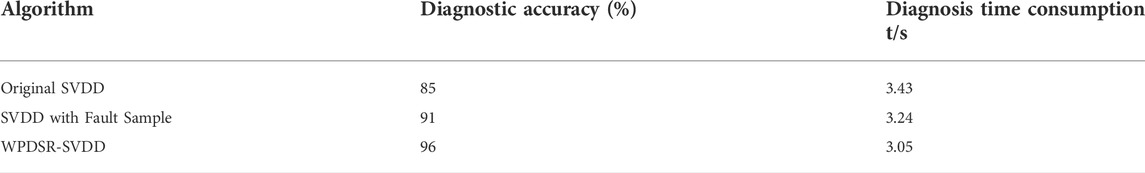
TABLE 4. Diagnosis efficiency.
5 Conclusion
In this paper, a new generalized resilient dual-threshold fault warning method with fault samples named WPDSR-SVDD is proposed for complex system networks, especially distribution power networks. The use of fault samples, the division of real-time samples, and the optimization and updating of the training model are successfully applied to practical production. The experimental results show that WPDSR-SVDD can provide accurate and fast fault warnings even in the case of insufficient data, and the main conclusions are as follows.
1) Energy feature extraction is introduced to unify the magnitudes of different kinds of signals to form combined features, and Spearman rank correlation is introduced to solve the problem of mutual coupling between signals, which finally improves the diagnostic accuracy.
2) The relaxed boundary criterion is proposed for the traditional SVDD, and the offset factor is introduced to change the original SVDD from an exact judgment to a fuzzy judgment, which in turn improves the robustness of the diagnosis system.
3) A model capable of online adaptive updating is proposed that can reduce the risk of false alarms and missed detections while satisfying real-time online faults.
Moreover, there are still something need to improve of the proposed approach. For example, since its modeling is an unsupervised learning process, online updating of models is extremely challenging. And the proposed method can only be used for early fault warning of the distribution system. That also means the approach cannot analyze the fault type, because the model is trained with only normal data. That may be the direction of further research.
Data availability statement
The raw data supporting the conclusion of this article will be made available by the authors, without undue reservation.
Author contributions
SJ has published a total of three journal articles A 9 ps Time-to-Digital Converter Based on Multiple Sampling in 0.18 μm CMOS, Theoretical analysis for the influence of the core radius on long period fiber grating sensors and A Hysteresis Comparator for Level-Crossing ADC. All authors contributed to the article and approved the submitted version.
Funding
This work was partially supported by the Fundamental Research Funds for the Central Universities (N2104018).
Acknowledgments
I would like to extend my sincere gratitude to my supervisor, SJ, for his instructive advice and useful suggestions on my thesis. I am deeply grateful of his help in the completion of this thesis.
Conflict of interest
The authors declare that the research was conducted in the absence of any commercial or financial relationships that could be construed as a potential conflict of interest.
Publisher’s Note
All claims expressed in this article are solely those of the authors and do not necessarily represent those of their affiliated organizations, or those of the publisher, the editors and the reviewers. Any product that may be evaluated in this article, or claim that may be made by its manufacturer, is not guaranteed or endorsed by the publisher.
References
Chouder, A., and Silvestre, S. (2010). Automatic supervision and fault detection of PV systems based on power losses analysis. Energy Convers. Manag. 51, 1929–1937. doi:10.1016/j.enconman.2010.02.025
Clemente-Alarcon, V., Antonino-David, J. A., Riera-Guasp, M., and Vlcek, M. (2014). Induction motor diagnosis by advanced notch fir filters and the Wigner-Ville distribution. IEEE Trans. Industrial Electron. 61 (8), 4217–4227.
Davy, M., Desobry, F., Gretton, A., and Doncarli, C. (2006). An online support vector machine for abnormal events detection. Signal Process. 86 (8), 2009–2025. doi:10.1016/j.sigpro.2005.09.027
Fei, X., Jianping, Y., Xiangli, D., Kang, Y., Congcong, W., and Haiyun, Y. 2019. “Power grid fault diagnosis method based on remote signaling data fault coding technology and DHNN correction [J]”. Power Syst. Prot. control (21). doi:10.19783/j.cnki.pspc.181497
Feng, Z., and Zuo, M. J. (2013). Fault diagnosis of planetary gearboxes via torsional vibration signal analysis. Mech. Syst. Signal Process. 36 (2), 401–421. doi:10.1016/j.ymssp.2012.11.004
Gopakumar, P., Reddy, M. J. B., and Mohanta, D. K. Adaptive fault identification and classification methodology for smart power grids using synchronous phasor angle measurements. IET Generation, Transm. distribution, 2015 9(2), 133–145. doi:10.1049/iet-gtd.2014.0024
Gritli, Y., Zarri, L., Rossi, C., Filippetti, F., Capolino, G., Casadei, D., et al. (2013). Advanced diagnosis of electrical faults in wound-rotor induction machines. IEEE Trans. Ind. Electron. 60 (9), 4012–4024. doi:10.1109/tie.2012.2236992
Guo, S. M., Chen, L. C., and Tsai, J. S. H. (2009). A boundary method for outlier detection based on support vector domain description. Pattern Recognit. 42, 77–83. doi:10.1016/j.patcog.2008.07.003
Guomin, L., Yingjie, T., Changyuan, Y., Yinglin, L., and Jinghan, H. (2019). Deep learning-based fault location of DC distribution networks. J. Eng. (Stevenage). 16 (3), 3301–3305. doi:10.1049/joe.2018.8902
Han, W., Haifeng, Z., Dongqiang, Z., Zhonghua, L., Xingjie, Z., and Tianmin, G. 2022. Fault diagnosis of rectifier circuit based on WPD‑PSO algorithm [J]. Journal of Jimei University (Natural Science Edition) 27 (3), 253–259. doi:10.19715/j.jmuzr.2022.03.08
Hong, L., and Dhupia, J. S. (2014). A time domain approach to diagnose gearbox fault based on measured vibration signals. J. Sound Vib. 333 (7), 2164–2180. doi:10.1016/j.jsv.2013.11.033
Joksimovi, G. M., Rieger, J., Wolbank, T. M., Peri, N., and Vaak, M. (2013). Statorcurrent spectrum signature of healthy cage rotor induction machines. IEEE Trans. Ind. Electron. 60 (9), 4025–4033. doi:10.1109/tie.2012.2236995
Lei, H., Online fault detection algorithm based on double-threshold OCSVM and its application. J. Mech. Eng., 2009, 45(3): 169–173. doi:10.3901/JME.2009.03.169
Liu, D., Yu, H., Wang, W., Zhang, H., Zhao, X., Zhao, Y., et al. (2019). “Multi-source log comprehensive feature extraction method based on restricted Boltzmann machine in power information system,” in 2019 IEEE 11th International Conference on Communication Software and Networks (ICCSN), Chongqing, China, , 503–508. doi:10.1109/ICCSN.2019.8905373
Lu, J., Zhao, R., Li, B., Li, H., and Tan, H. (2021). “Intelligent fault diagnosis method of power grid based on multi-source feature fusion,” in 2021 IEEE 5th Conference on Energy Internet and Energy System Integration (EI2), Taiyuan, China, 1794–1797. doi:10.1109/EI252483.2021.9713464
Lu, S., He, Q., Yuan, T., and Kong, F. (2017). Online fault diagnosis of motor bearing via stochastic-resonance-based adaptive filter in an embedded system. IEEE Trans. Syst. Man. Cybern. Syst. 47 (7), 1111–1122. doi:10.1109/tsmc.2016.2531692
Mu, T. T., and Nandi, A. K. (2009). Multiclass classification based on extended support vector data description. IEEE Trans. Syst. Man. Cybern. B 39 (5), 1206–1216. doi:10.1109/tsmcb.2009.2013962
Myers, J. L., Well, A. D., and Lorch, R. F. (1995). Research design and statistical analysis. 2nd ed. New York: Lawrence Erlbaum.
Peng, H., Wang, J., Ming, J., Shi, P., Prez Jimenez, M. J., Yu, W., et al. (2018). Fault diagnosis of power systems using intuitionistic fuzzy spiking neural p systems. IEEE Trans. Smart Grid 9 (5), 4777–4784. doi:10.1109/TSG.2017.2670602
Rafiee, A. H. J., Tse, P., and Sadeghi, M. (2009). A novel technique for selecting mother wavelet function using an intelligent fault diagnosis system. Expert Syst. Appl. 36 (3), 4862–4875. doi:10.1016/j.eswa.2008.05.052
Saizhao, Y., Wang, X., Junyu, Z., Hong, R., Shukai, X., Runhong, H., et al. 2019. “Fault detection method of overhead flexible DC power network based on artificial neural network” [J]. Chin. J. Electr. Eng. (15). doi:10.13334/j.0258-8013.pcsee.181340
Tax, D. M. J., and Duin, R. P. W. (2004). Support vector data description. Mach. Learn. 54, 45–66. doi:10.1023/b:mach.0000008084.60811.49
Wang, X., McArthur, S. D. J., Strachan, S. M., Kirkwood, J. D., and Paisley, B. (2018). A data analytic approach to automatic fault diagnosis and prognosis for distribution automation. IEEE Trans. Smart Grid 9 (6), 6265–6273. doi:10.1109/tsg.2017.2707107
Xiang, D., and Cen, J. 2015. A rolling bearing fault diagnosis method based on EMD entropy feature fusion [J]. J. Aerodyn. 30 (05), 1149–1155. doi:10.13224/j.cnki.jasp.2015.05.016
Xin, Y., Congyun, X., and Ping, X. 2021. “Microgrid fault diagnosis and classification method based on wavelet feature extraction and deep learning” [J]. Smart power 49 (12), 17–24. doi:10.3969/j.issn.1673-7598.2021.12.004
Yansong, W., Xueying, Z., and Jingbo, Y. 2018. “Fault location and fault tolerance algorithm for distribution network” [J]. Power autom. Equip. 38 (4), 9–15. doi:10.16081/j.issn.1006-6047.2018.04.002
Yi, Z., and Etemadi, A. H. (2017). Fault detection for photovoltaic systems based on multi-resolution signal decomposition and fuzzy inference systems. IEEE Trans. Smart Grid 8 (3), 1274–1283. doi:10.1109/TSG.2016.2587244
Yilun, Z., Xinjian, C., Qiang, G., Daojian, H., Zhouhong, W., and Wei, L. 2020. “A power flow feature extraction method based on deep reinforcement learning” [J]. Power grid clean energy 36 (3), 7–12. doi:10.3969/j.issn.1674-3814.2020.03.002
Keywords: fault waring, SVDD, spearman rank correlation, relaxation boundary, energy feature extraction
Citation: Chu F, Lu Z, Jin S, Liu X and Yu Z (2022) A relaxed support vector data description algorithm based fault detection in distribution systems. Front. Energy Res. 10:973794. doi: 10.3389/fenrg.2022.973794
Received: 20 June 2022; Accepted: 04 July 2022;
Published: 22 July 2022.
Edited by:
Peng Zeng, Shenyang Institute of Automation (CAS), ChinaReviewed by:
Hua Chunsheng, Liaoning University, ChinaTing Li, Beijing Institute of Graphic Communication, China
Copyright © 2022 Chu, Lu, Jin, Liu and Yu. This is an open-access article distributed under the terms of the Creative Commons Attribution License (CC BY). The use, distribution or reproduction in other forums is permitted, provided the original author(s) and the copyright owner(s) are credited and that the original publication in this journal is cited, in accordance with accepted academic practice. No use, distribution or reproduction is permitted which does not comply with these terms.
*Correspondence: Shuowei Jin, amluc2h1d2VpQGlzZS5uZXUuZWR1LmNu