 Shaocong Chen
 Lei Gan
 Canyang Chen
 Kun Yu
 Ran Dai
- College of Energy and Electrical Engineering, Hohai University, Nanjing, Jiangsu, China
Adjustable resources on the demand side of power system plays a vital role to improve operational flexibility of future low-carbon power system integrated with high-penetration renewable generations. While, these demand-side resources may underperform their expected potentials, due to the lack of understanding on consumers’ refined behaviors. Facing the flexibility improvement of future power system, refined portrait structure of single user combining load characteristics and subjective behavior, is constructed with multi-dimension label system from 4 aspects, including energy consumption and load characteristics, adjustable potential, behavioral awareness and user’s nature. Aiming at supplying demand response service, several key indexes are selected and further evaluated here, via data-driven load character analysis and social-survey-driven user’s subjective consciousness mining based on comprehensive evaluation with combination weighting approach. For practical application to demand response decision making, large-scale user adjustable resource is evaluated and classified based on multivariate density-based clustering algorithm. Numerical results show the feasibility and rationality of the proposed assessment method.
1 Introduction
Facing critical greenhouse effect and fossil energy crisis on the Earth, various governments declared their carbon peak and neutrality target. High proportion of renewable power generation will be a main characteristic for future power system. Flexible resources will be scarce in low-carbon power systems with high-penetration intermittent wind/solar power. At the same time, with the global urbanization in recent years, the quantity of power consumption and peak-valley difference of load profile has exacerbated a lot during past decades. The guidance and control of adjustable load resources (ALRs) on demand side are widely regarded as a promising solution to increase operational flexibility of power system with the mechanism of demand response (DR) (Shafie-khah et al., 2019). While the high randomness and strong subjectivity of power consuming behaviors, especially those of resident users, bring great challenges to the decisions on DR strategy and mechanism design. Fortunately, with the rise of Internet of Things (IoTs) on the demand side, fine-grained environmental and operational data can be obtained and used to support the exploitation and utilization of these adjustable demand-side load resources. Even so, the subjective willingness of users can hardly be quantified via these operational data, and traditional social survey can still play a role to some extent (Labeeuw et al., 2015; Shi et al., 2020). Thus, it is necessary to explore the value of demand-side heterogeneous data, comprised of operational load and survey data, to portray particular characteristics of ALRs such that it can provide power enterprises with a practical tool to design rational DR mechanism and make proper DR strategies to ensure the safety and economy of power system operation.
Since 1980’s, power load characteristics have been studied and encouraged to be guided with active intervention regulations, mechanisms and techniques through demand-side management to DR (Gellings, 1981). Subjected to the monitoring and control techniques at the time, early load management was targeted to large industrial and commercial users with administrative regulation in the form of orderly power consumption. With more flexible new types of load connected, e.g. electric vehicles (EVs), heating ventilation air conditioner (HVACs), electric water heaters (EWHs), as well as smarter IoT techniques, the load of ALRs can be decreased and shifted with neglectable effect on customer in the form of DR programs (Shi et al., 2018). The assessment of ALRS have aroused widespread attention in both industry and academia. Numerous scholars have made great efforts to evaluate DR potential of single or aggregated ALRs. These techniques can be classified into two categories: model-driven ones and data-driven ones. Based on the physical power model and operation constraints of appliances and external environmental parameters, the model-driven potential assessment methods were formed layer by layer from single ALR to user and finally to regional user groups (Rotger-Griful et al., 2016; Chen et al., 2018). The principle of these approaches is scientific and the process is clear. Whereas, the modeling of users’ divergent subjectivity is still a bottleneck to practical application. Generally, nine tenths of data-driven evaluation approaches obtained the potential of ALRs based on the comparison of load profiles under DR programs with the baselines (Bartusch and Alvehag, 2014; Gils, 2016; Hua et al., 2022). The subjectivity of users can be implied in the obtained potentials and the accuracy of post-fact assessment can be ensured. However, due to the indirect explanation of users’ subjectivity using data-driven methods, the performance of prior assessment is still facing high uncertainties, bringing great challenges to practical DR grogram design and operation. After all, there are many non-physical factors affecting the potential, including the sensitivity and willingness to response to the change of price and incentives, the environmental awareness, the usage patterns and so on.
Although these non-technical factors can hardly be extracted from load profile data, questionnaire survey on power-consumption behavior can reflect users’ choices on these aspects directly, such that the assessment of ALRs will be more realistic based on the load and survey data fusion. The authors of Ref. (Shi et al., 2020). conducted a large-scale online survey on users’ behavior to participate incentive-based DR (IBDR) programs in New York and Texas in the U.S., based on which the capability and expense of two main reductive household load, i.e. the load of EWH and HVAC, was estimated with related load modeling. Similarly, customer elasticity for IBDR programs was estimated using data from two national surveys on the power consumption behaviors in Summer and Winter respectively (Asadinejad et al., 2018). Our previous work shows the feasibility and rationality to evaluate the dispatching potential of EVs’ charging load based on the social survey on travel needs and psychological range anxieties (Gan et al., 2020). It is proved that the social behavioral surveys can indeed improve the practicability of the assessed potential for aggregated loads. While these results can barely show the definite directions for the retailers or aggregators to specify the DR invitation objects.
With the advent of big data era, user portrait is a common technique for market operators to analyze and manage users, firstly used in e-commerce. The essence of user portrait is to abstract a large amount of collected user data information into labels, and the process of data extraction and label generation is the process of constructing user portraits. Thanks to the development of smart grid, IoTs applied in power industry can help operators to monitor and gain fine-grained data. Thus portrait techniques were gradually introduced to power industry, especially in the areas including outlier detection (Tang et al., 2014), equipment ledger management (Li et al., 2020), business management for commercial Internet platform of state-owned corporation (Yu et al., 2019), transmission line management (Zhang, 2019), electricity enterprise supplier management (Huang et al., 2021), user management (Shi et al., 2016; Wang et al., 2017; Feng et al., 2018; Lu et al., 2018; Zhong et al., 2018; ShiLu and Tian, 2020; Hu et al., 2021; Kong et al., 2021; Li et al., 2021; Yan et al., 2021). Users’ tariff recovery risk, credit rating and energy efficiency rating was assessed with power consumption, payment and arrears data in (Shi et al., 2016; Wang et al., 2017; Yan et al., 2021) respectively. As for the power consumption behavior portrait, different indicators and different time-scale indicators of load characteristics were separately labeled for user portrait in (Lu et al., 2018) and (Hu et al., 2021). Beside of load data, massive user archives and consumption data were explored in (Feng et al., 2018) to understand users’ consumption habits. Based on the correlation analysis on load data and environmental data, temperature/comfort sensitivity and electricity price sensitivity were supplemented in the work of (Zhong et al., 2018; ShiLu and Tian, 2020). Interactive consumption and response potential of users were further described in (Kong et al., 2021; Li et al., 2021). As we can see, the overall load data is the mostly used data resource for users’ behavioral portrait, while none of the above work use social survey data to enrich the portrait system, which proven to be essential to practical application for DR scenario. More generally, for DR purpose, current power user portrait can only tell the adjustable potential of users, but it is fuzzy to know who is willing to participate, or even which ALR can be controlled to response to DR signal. Besides, there was limited number of studies exploring the value of more fine-grained load data acquired by smart monitoring system, e.g. intrusive and non-intrusive load monitoring (NILM) (Liu et al., 2021), with high load identification accuracy and promising application prospect.
Based on the above motivations, a refined DR-oriented portrait structure of single user combining load characteristics and subjective behavior is constructed. Among the portrait tags, behavioral features are analyzed based on data from two sources, load data acquired from NILM and questionnaire data from subjective behavioral survey. Where, theoretical adjustable potential is assessed with fine-grained NILM data, and subjective willingness to response is assess with descriptive survey data by analytic hierarchy process (AHP)-entropy-based objective and subjective weighting method. At last, a multivariate density-based spatial clustering of applications with noise (DBSCAN) clustering algorithm was applied for massive user management in realistic DR programs. The main contributions of this work can be summarized as: 1) a multi-attribute DR-oriented fine user portrait index system is constructed to comprehensively exploit the fine-grained load data from NILM and questionnaire data from behavioral survey; 2) a survey-data-driven assessment method of user’s subjective behavioral awareness to attend DR program is proposed based AHP-entropy-based combination weighting approach; 3) a group management method is proposed to grade the potential DR invitation objects based on multivariate DBSCAN algorithms.
2 Multi-attribute DR-Oriented fine user portrait
Comprehensively considering the subjective and objective factors that affect users’ electricity consumption behavior, a multi-dimension fine user portrait was proposed here, based on a large number of fine-grained load data acquired from NILM, questionnaires and family attributes and other information, contributing for power enterprises to select high-quality users to participate in the DR programs.
Establishing a complete user behavior evaluation index system is the key to draw multi-attribute user portraits. DR-oriented user interaction behavior can be evaluated with the proposed index system, as shown in Figure 1, including four secondary indicators: energy consumption and load characteristics, adjustable potential, behavioral awareness and user nature. At the same time, in order to realize multi-dimension and refined portrait, each attribute is further subdivided into several three-level indexes. Through full analysis and utilization of fine-grained NILM data and descriptive social survey results, useful information can be extracted to improve the utilization rate of data and the practicability of evaluation.
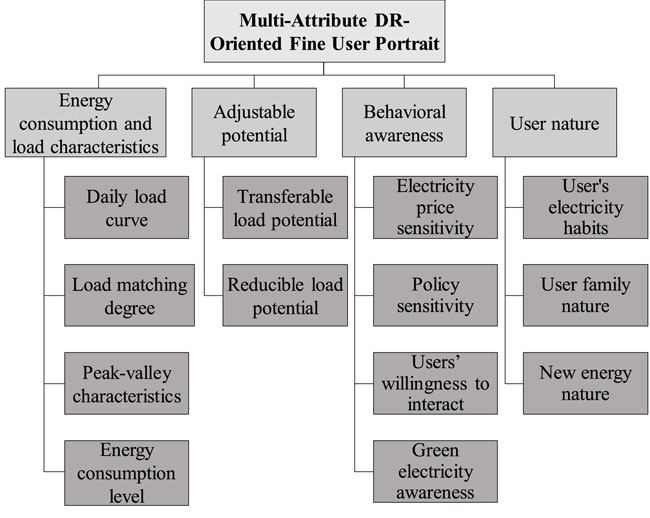
FIGURE 1. Multi-attribute evaluation index system for DR-oriented user portrait.
2.1 Energy consumption and load characteristics
This indicator mainly processes and analyzes the fine-grained NILM data, reflecting a user’s energy consumption characteristics directly. Conventional analytic method of load characteristics is used here, including the shape of weekly/daily/hourly load curves, and their peak and valley feature. Whereas, each of the main devices driven by different living and productive demand can be displayed due to the NILM techniques. At the same time, the matching degree between the user’s daily load curve and the grid load curve is calculated, and users with a higher matching degree have greater potential for interaction. For example, when a DR invitation is issued by load aggregator to cut peaks or fill valleys, users with a high matching degree have more physical potential to respond to the invitation by reducing the load during the peak period and switching to the valley period.
2.2 Adjustable potential
The adjustable potential is evaluated from the physical aspect, i.e. the theoretical potential obtained according to the operation status of regulable appliances without considering user’s subjective willingness. This can be also evaluated via fine-grained operational load data. As is mentioned in the literature review, great efforts of related researches have been made to evaluated the adjustable potential of different loads. Similarly, here the adjustable potential evaluation contains two kinds of adjustable load: transferrable load and reducible load (including interruptible load). Among them, the transferrable load is related to the matching degree between user’s load curve and grid load curve in previous section, reflecting the user’s potential to respond to peak shaving, valley filling or peak staggered power consumption under objective conditions. While reducible load potential reflects the corresponding production and living needs that can be cut to respond to DR invitations. When the need at one moment is cut to zero, the related potential refers to the interruptive load one. The total adjustable load potential of a moment is the sum of all the user’s transferable load potential and reducible load at that moment. Adjustable potential is an objective condition for users to participate in DR projects issued by load aggregators, and is a key basis to judge user interactive potential from objective perspective. On this base, the practical potential should take user’s subjective willingness into account, affected by power-consuming economy and utility, social duty, etc.
2.3 Behavioral awareness
This attribute aims to exploit the subjective behavior associated with power use, including policy sensitivity, electricity bill sensitivity, user’s willingness to interact, and consciousness of green electricity. All this tags can be evaluated from social questionnaire survey on the behaviors of power use directly. It is believed that users, with high sensitivity to energy policies, power consuming bills, interaction with power industry, and environmental crisis, will be more likely to participate DR projects. While since the subjective evaluation on users is an abstract concept and cannot be processed directly, the evaluation system adopts the method of assigning points and weighting to quantify the results of the questionnaire, and evaluate the user’s subjectivities with quantified rating. Likert scale method is applied here, according to the strength of the user’s willingness reflected in the choices to the questions. During the process, a combination weighting method is used here to comprehensively consider all the related questions to these tags, based on subjective and objective weighting concept with AHP-entropy weighting method, which can make full use of the questionnaire and make the weighting process more scientific and credible.
2.4 User nature
User nature is another social attributes of users to affects other 3 attributes more or less. As an inherent attribute of users, the 3 tags on the third level, including electricity usage, user’s family nature and new energy nature, can function based on the correlation and causality between this information with the previous three dimensions. And this kind of information can also be acquired in the basic information part of respondents.
3 Behavioral feature analysis based on historical load and social survey
According to the multi-dimension fine portrait of residential power users, the assessment of a user’s adjustable resources can extend from a single user to a large number of users, and then offer load aggregators a more reliable and efficient assessment tool. According to data resources in the evaluation system, the behavioral feature can be analyzed based on load and survey data as follows.
3.1 Data-driven analysis of load characteristics
3.1.1 The calculation of matching degree to power grid load curve
As different users have different habits and patterns of electricity consumption, we try to quantify the customer’s consumption patterns in a different way. User’s single-day load curve is matched to local grid’s daily load curve, reflecting the customer’s adjustable potential and adjustable capacity according to their similarity. Fréchet distance is introduced to measure the similarity between curves that takes into account the location and ordering of each point along the curves.
Assume S is a plane, and A, B are two curves to be matched in S. Then, the Fréchet distance between A and B is defined as the infimum of maximum Euclidean distance between each point of these two normalized curves, defined as:
Where d is the Euclidean distance in Plane S, α and β are normalizations of curve A and B with the interval of [0,1], and t is the data point index with normalized range [0,1]. The smaller Fréchet distance is, the larger the matching degree will be. The users with high matching degree are regarded as the potential invitees, because their power consumption are at the high level in peak hours and low level in valley hours, which is the basic condition to attend peak-shaving or valley-filling DR projects. In other words, it will be more efficient to implement DR projects if users with high load matching degree are willing to accept the DR invitation.
3.1.2 The calculation of adjustable potential of load
Generally, the flexible loads can be classified into transferable load, reducible load and interruptible load, where interruptible load can be regarded as the load of corresponding devices controlled to be reduced to zero, an extreme kind belongs to reducible one. Thus, only two categories of adjustable load are discussed here. With traditional load data source, i.e. the total load characteristics of a user, baseline evaluation is needed to figure out the overall adjustable potential of users. This method may function well when the load of large-scale users or big consumers are the analyzing objectives. While for one single user portrait, the overall load source may face a bottleneck, because the baseline itself is of great subjectivity and uncertainty, especially for residents and small commercial or industrial users. Some more fine-grained load sources are needed to help describe a DR-oriented user portrait, and NILM/ILM techniques have already made it possible to gain detailed load data for main load components of a user. This makes the evaluation of adjustable potential easier, due to the operational status of transferrable and reducible devices can be monitored all the time. Physically, without considering user’s subjective demand, the maximum adjustable load potential of each device is the difference between the current load rate and its maximum/minimum load rate, for incremental/reduced DR projects separately. Noted that, the subjectivity of users will be evaluated later with questionnaire result mining.
To sum up all the transferable load potential and reducible load potential of a user, the total adjustable potential coefficient (TPC) of the customer at one moment can be aggregated as follows:
Where, m and n represent the number of electrical equipment in categories transferable potential and reducible potential respectively; LT is of the transferable load potential, LR is of the reducible load potential at that moment. Depending on the variety and using frequency of transferable load equipment and reducible load potential used by the users. The theoretic potential assessment method of LT and LR can be found in many current references with constructed load model and current external environmental conditions.
3.2 Users’ subjective consciousness mining based on social information
This project mines the valid information by issuing questionnaires to resident users, and applications related methods to process and integrate natural language information, and finally realizes the assessment of adjustable resources for intensive users. Here, combined subjective and objective weighting method, based on AHP-entropy weight method and quantification of questionnaire survey choices, is introduced to evaluate the subjective behavior of DR participation from four aspects: policy sensitivity, electricity price sensitivity, users’ willingness to interact and green electricity consumption awareness. The specific processes can be summarized as follows.
3.2.1 Hierarchical system for AHP
The research on users’ subjective consciousness in this paper is based on the questionnaire survey, called “Basic information and Willingness to Participate in the Interaction of Power Supply and Demand Survey on Urban Users in Jiangsu Province”. This survey is conducted in Jiangsu of China in the summer of 2020, and mainly issued to urban residents in the city of Changzhou and Suzhou on the Internet with a small monetary incentive for respondents. The main related content of the questionnaire is shown in Supplementary Appendix S1. Finally, 2858 efficient responses were collected.
According to the questions set in the survey, a hierarchical system was established by analyzing willingness to respond and its four layers, and also the corresponding questions were matching as the influencing factors for different layers, as shown in Table 1. Please note that many questions may reflect different users’ subjective concerns in multiple dimensions, there will be repetitive questions in different layers.
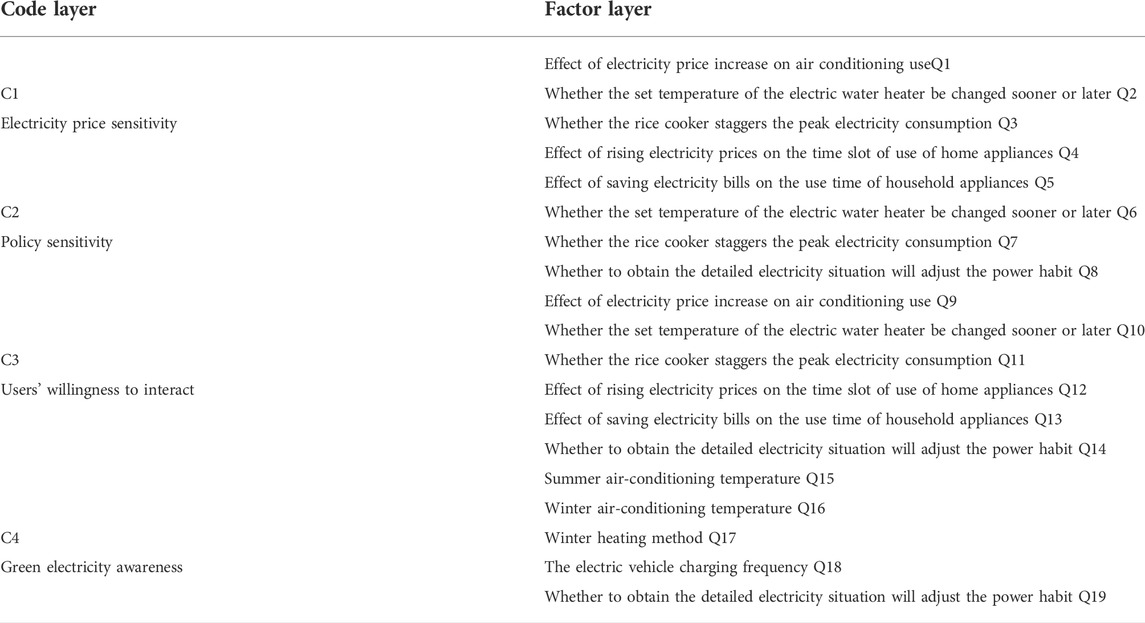
TABLE 1. The hierarchical system for AHP.
(1) Preprocess of questionnaire respondent choice
To facilitate the calculation of the respective scores of the four aspects, this project assigns points to answers to questions involving the four-aspect influencing factors in the questionnaire. The principle of assignment mainly refers to the assignment method of the Likert scale, consisting of a set of statements including “Strongly agree”, “Agree”, “Neither agree nor disagree”, “disagree” and “Strongly disagree”, respectively scored as 5,4,3,2,1. Each respondent’s attitude score is the total score of his answer to each question, which may indicate the strength of his attitude or his different status on this scale.
(2) Consistency check
The judgment matrices M-C and Ci-P were constructed based on the expert scoring result, recorded as M and Ci respectively, their order is the number of dimensions of the criterion and factors in the dimension i. Besides, the matrix elements are the values filled by experts, giving a score from 1 to 10 according to the importance of the correlation between the two level indicators.
The judgment matrix only can be adopted by passing the consistency test, and the consistency test formula is as follows:
Where, λmax is the maximum eigenvalue of the matrix; CI is the consistency indicator; n is the matrix order; CR is the consistency ratio; RI is the random consistency indicator, related to n. In general, the greater the order of the matrix, the greater the possibility of random deviation from consistency. When CR < 0.1, the matrix is considered to pass the consistency test, otherwise, the judgment matrix should be corrected.
3.2.2 Determine the weight
(1) Weighting of AHP
The relative ranking weight of a certain criterion is derived in the judgment matrix by means of characteristic root method (Dehghanian et al., 2012). That is, the eigenvector corresponding to the λmax of the judgment matrix, is normalized to get sorted weight vector ω, where ωi is the sorted weight vector of Ci, and aij is the weight of the factor j under Ci, then:
Similarly, sorted weight vector ωm of M can be obtained, and bi is the weight of Ci for M, then:
Multiply the weight of a factor under Ci by the weight of Ci to M to obtain the weight of the factor to M, and record the weight of the factor k of the factor layer to M as αk.
(2) Weighting of Entropy method
The entropy weight method is an objective weighting method. This method uses the information entropy to calculate the entropy weight of each indicator according to the degree of variation of each indicator, and then corrects the weight of each indicator through the entropy weight to obtain a more objective indicator weight. Based on the scores of the questionnaire, list the scores of users which the number of is m for each factor. Note the indicator k of the user i be Xik, and the normalized result is Yik, then use the normalized result to calculate the proportion Zik of the indicator k of the user i. According to Zik, the information entropy Ek can be calculated by the index k, and finally the objective weight of the kth index is obtained, which is recorded as βk. The formulas are as follows:
(3) Combination weighting method
The methods for determining the weight of indicators are mainly subjective weighting method and objective weighting method. However, neither method can satisfy the comprehensive statistical results reflecting subjective information and objective facts. In order to solve this problem, this project combines subjective weighting and objective weighting, thus the final weights reflect both subjective and objective information, accordingly, the final result is more accurate.
The weights of the factor k obtained according to the AHP and entropy weight methods are αk and βk respectively, and the weight Wk of the combined weighting can be obtained from eq. 11.
3.2.3 Comprehensive evaluation of subjective DR participation degree
According to the questionnaire results, the scores of each factor question of each user can be obtained, and combined with the weighting results, the final score could be calculated by the means of weighted summation method in the response level of the users. The scores of users’ willingness to respond obtained after natural information processing through the above method can reflect the level of user’s willingness to respond, so as to achieve a more refined and efficient assessment of adjustable resources for intensive users.
4 Demand-response oriented large-scale user group management
4.1 Practical tags selected for user group management
User’s refined portrait can show the basic information, physic and subjective characteristics from different attributes, and this technique is proposed to be applied to different subjects efficiently, for users’ better knowledge about their energy-consuming behaviour, for power industry enterprises, like grid company, retailers, and load aggregators, to make power sale and purchase, DR decisions, for governments to design DR and other market mechanisms. Whereas, there are exterior-interior relationships between these tags, as well as negligible tags in practical DR projects. Thus, several key tags are selected here for DR- oriented large-scale user group management with data-driven techniques.
As for the practical value of fine-grained load data, load matching degree and physical adjustable potential are the two main factors. Affected by user nature, with high load matching degree, it is implied the load has the similar peak-valley feature with that of regional load, reflecting the adjustment of these users can improve the effect of DR. While adjustable potential can directly show the physical capacity for the user to attend DR. As for the utilization of questionnaire result, user’s behavioural awareness, comprehensively evaluated by combined AHP-entropy weight method from price and policy sensitivity, willingness to interact and green electricity awareness, is selected to reflect the degree of user’s subjective participation.
4.2 Group management based on multivariate clustering algorithm
With the selected tags, data-driven clustering algorithms can be further utilized to classify massive users into different groups for power companies to conduct DR projects. Here, multivariate DBSCAN is applied to decide user groups. DBSCAN is a density-based clustering algorithm, with the concept that categories can be determined by the tightness of sample distribution. That is the number of objects (points or other spatial objects) in a certain region of the clustering space is not less than a given threshold. By filtering low density areas, samples of the same category are closely related. The main steps are listed as follows.
Step 1: Set two parameters(eps and MinPts), where eps is the domain radius, indicating the range of circular neighborhood centered on a given point (spatial point to show a user’s nature with 3 selected tags in 3D space in our case); Minpts is the minimum number of sample points, indicating the number of minimum sample points in the neighborhood centered with the given point;
Step 2: Select an arbitrary point P, calculate the distance from point P to K adjacent points, and take the maximum distance value, denoted as K-Dist(P), and set parameter eps to K-Dist(p). Count the number of points neighbored with center point P and radius eps as pts;
Step 3: Judge whether pts ≥ MinPts. If pts ≥ MinPts, mark P as a core point, otherwise mark P as a noise point.
Step 4: Output the set merged by all core points as a same user group.
Step 5: Repeat Step 2–4 until all data objects in dataset are accessed, with new unvisited points are retrieved and processed to discover deeper clusters or noise.
Figure 2 is a diagram of user grouping result with a small sample set based on DBSCAN, where X-axis represents the user’s willingness to interact (unit: score), the Y-axis represents the load matching degree (unit: %), and the Z-axis represents the adjustable potential (unit: kW). Color-coded dots represent different user groups with different colors, and user groups of different categories.
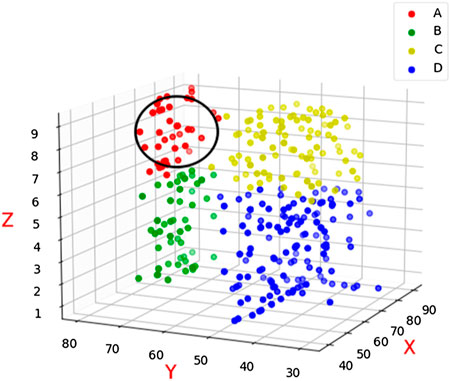
FIGURE 2. Clustering diagram of the three DR indicators.
4.3 Grading of User Groups
According to the levels of 3 tag values, a large number of users can be divided into eight categories. Considering the order of priority for power company to make DR invitations, these groups are graded as high-quality users, I-VI level potential users and inferior users, as shown in Table 2.
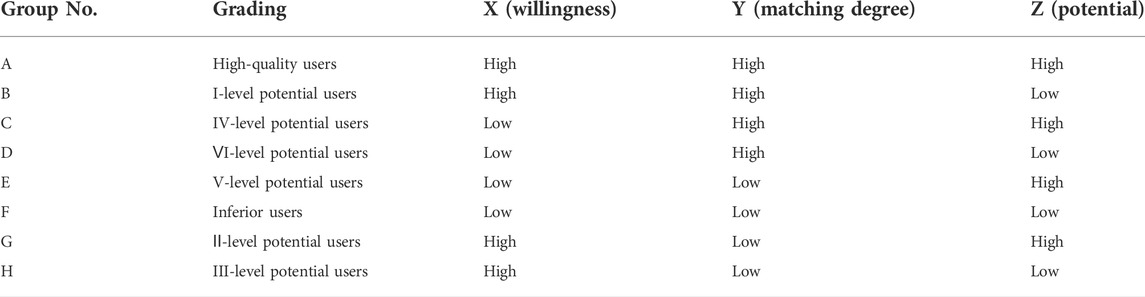
TABLE 2. User group grading.
Group A users are high-quality users, with combined high potential and high matching degree, as well as a strong willingness to interact. When load aggregators issue a DR call, such users are more likely to participate in load scheduling than other users. Inviting such users in priority can reduce the workload to make DR strategy and improve success rate of user invitations, such that the efficiency of DR can be improved, if the potential of Group A can meet the demand of interactive capacity target.
Other potential users are sorted with the order of Group B, G, H, C, E and D. They are not only potential customers who can develop into high-quality users, but also a backup force during large-scale scheduling. Such users are classified according to the importance of the three tags in the actual situation. Interactive willingness plays a decisive role in the grading. After all, users with lowest willingness can hardly participate DR programs, despite their high matching degree and potential. Based on the above criteria, potential users are subdivided into grades I to VI in Table 2. Where, Group B, G, and H are potential high-quality users. Load aggregators can adopt specific auxiliary strategies to attract them to participate in resource scheduling or develop them into high-quality users. I-level potential users with low-level adjustable potential index have the ability and willingness to participate in load scheduling, while the contribution is less than that of high-quality users due to the lower potential. Such users are the first reserve force for resource scheduling, if Group A cannot meet the DR demand. II-level potential users with low-level load matching degree can also be the first reserve force. Though their load curves are quite different from the regional load, related to their inherent social attributes, including electricity consumption habits, family composition, and occupational specificity, they have relatively high potential and strong willingness. III-level potential users with low-level matching degree and potential can be the following reserve. Though such users have low single-user potential, with more users aggregated, they may provide a high contribution. Group C, E, and D are low-priority potential users, because the interactive willingness of such users are low, and the possibility of developing into high-quality users is low and difficult. Only when DR potential need is too large to meet, such users will be considered for invitations. Group F are inferior users, not cost-effective to invite such users, can be neglected in DR program.
With the grades of different user groups, the total DR potential of different groups can be obtained. Such that the invitation of DR programs can be issued in the above order depending on DR potential demand. The flow chart of large-scale user group management based on DBSCAN is shown in Figure 3.
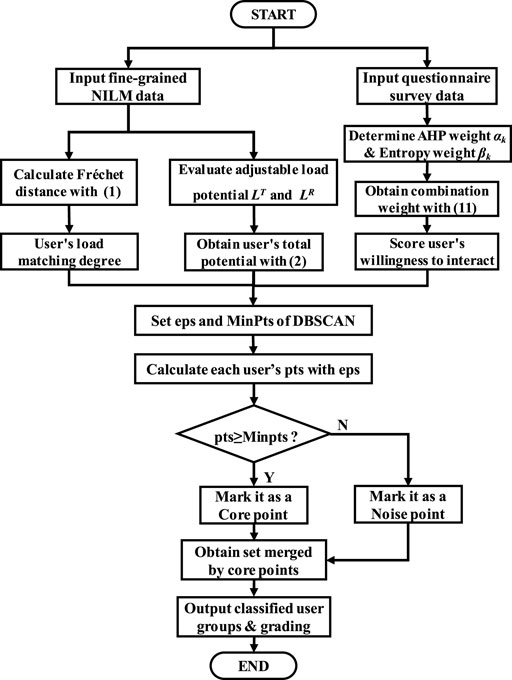
FIGURE 3. Flow chart of large-scale user group management based on DBSCAN.
5 Numerical simulation and discussion
The NILM load and questionnaire data of 504 users in the city Suzhou of Jiangsu are analyzed here. With the constructed multi-attribute evaluation index system, several main tags used in practical DR management of a single user are analyzed. And then, user group management is conducted according to the flow chart based on multivariate DBSCAN. And DR program is a peak-shaving project conducted from 11:30 on July 15th of 2020.
5.1 Single user portrait results and discussion
(1) Analysis on the results of data-driven load characteristics
The NILM data of a typical residential user (No. 6821) was taken as an example to assess its adjustable potential and matching degree to the overall load curve of Suzhou. Figure 4 shows the adjustable potential result of this user, noted that the load curve is a normalized one with the maximum load point. As is seen in the figure, the maximum adjustable potential of peak hours occurred at 11:30, the same moment of daily peak point, reaching 40% of maximum load.
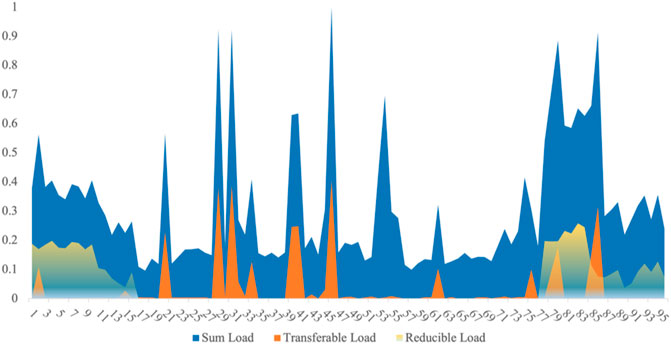
FIGURE 4. User’s adjustable potential assessment.
According to the user’s daily load curve and the overall load of Suzhou that day, shown in Figure 5, the result of Fréchet distance evaluation is 1.376. Since the higher degree of load matching between the customer and the grid reflects the greater response potential, the smaller Fréchet distance is, the higher the matching degree will be.
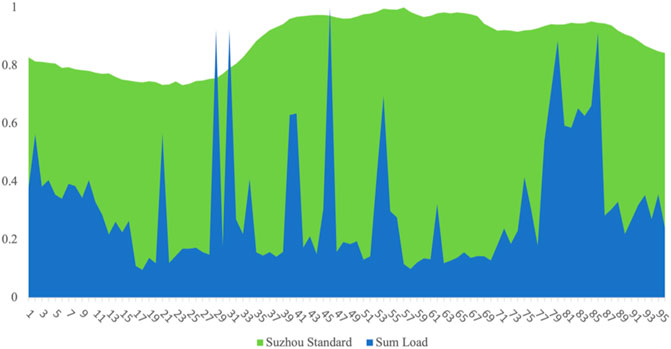
FIGURE 5. Matching degree of user and grid load.
(2) Analysis on results of user subjective consciousness based on questionnaire survey data
To evaluate users’ subjective consciousness, the judgment matrix is first constructed and checked by the consistency test. Average random consistency index RI standard value is shown in Table 3. Then, the target layer, the criterion layer and the factor layer are analyzed according to the process of AHP method. The corresponding weights of the 19 questions in the factor layer are obtained, as shown in Table 4. Then, with Entropy weight method, the weights of 19 problems based on objective method can also be obtained, listed in Table 5. Furthermore, with the combination weighting using eq. 11, the final weights can be obtained as Table 6. Combined with the score of the scheme layer and the weights of the four tags under behavioral awareness, the weighted summation is performed to obtain the index of each dimension of the user and the comprehensive score of the user’s subjective awareness of electricity consumption.
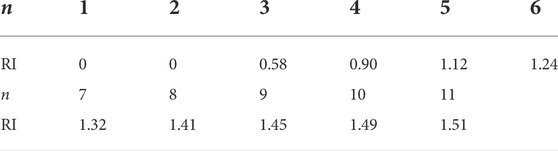
TABLE 3. Average random consistency index RI standard value.
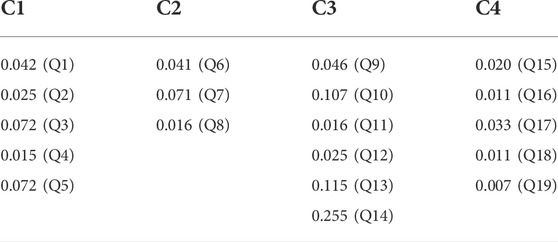
TABLE 4. Weighting result of analytic hierarchy process.

TABLE 5. Weighting result of entropy weight method.
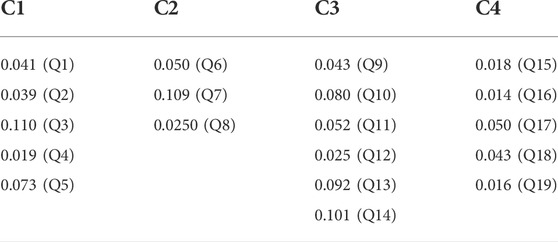
TABLE 6. Weighting result of combination weighting method.
Finally, the results are presented through the radar chart, as shown in Figure 6. The index on the four axes in the radar chart represents the user’s sub-scores of policy sensitivity, electricity bill sensitivity, user interaction willingness, and green electricity awareness respectively. The score in middle circle of the chart represents the overall score of the user’s subjective awareness. As we can see, the user is relatively sensitive to electricity price and has a relatively high willingness to interact, but less sensitive to other policies and environmental factors, showing that the user can be easier persuade to participate in DR projects with economic incentives than other activities like environmental advocacy.
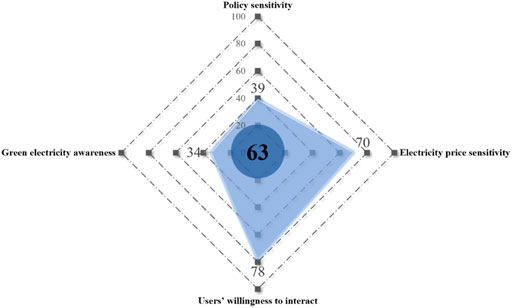
FIGURE 6. Users’ willingness to interact.
5.2 Result and discussion of user group management
The quantitative data of the load matching degree, adjustable potential and interaction willingness of the sample points can be obtained with above simulation for 504 users. This subsection is to classify the users and grade on the user groups based on multivariate DBSCAN clustering method. The grouping result can be seen in Figure 7. The statistics of the clustering results are listed in Table 7.
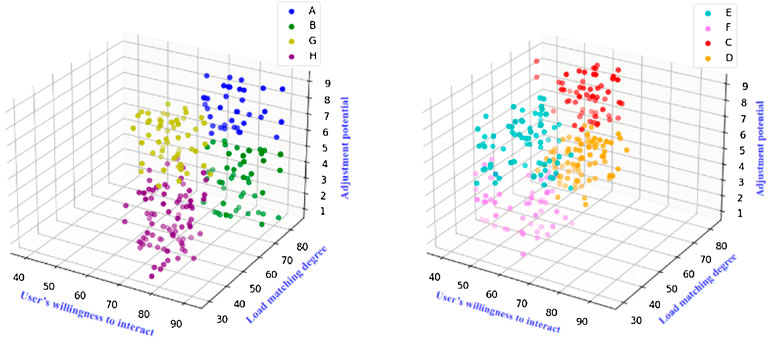
FIGURE 7. Grouping results of 504 users.
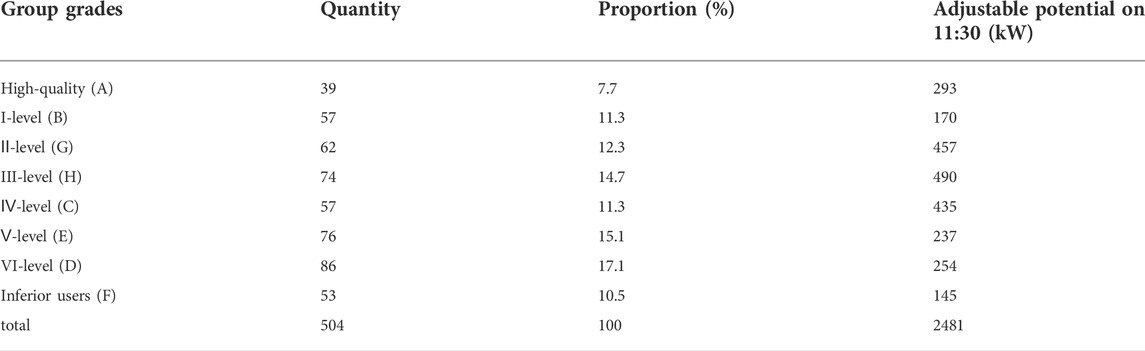
TABLE 7. Statistics of clustering results.
From Table 7, high-quality users account for only 7.7% of the total users, and the total adjustable volume is limited. Therefore, although the success rate of inviting high-quality users is very high, only inviting high-quality users may not meet the scheduling requirements in actual situations (set as 1,400 kW). The potential users account for a large proportion, about 81.8%, and the estimated total amount of adjustment is also large. However, according to the evaluation results, potential users either have low willingness to participate, or contribute little on potential. Although it can be seen from the presented data that the expected adjustable potential of potential users is much greater than that of high-quality users, not all these expected adjustable amounts can be put into scheduling in actual scenarios. Therefore, for load aggregators, it is urgent to consider how to improve the proportion of high-quality users and how to develop potential users into high-quality users.
To solve the above problems, load aggregators can take differentiated measures for potential users by combining the results of individual user portraits shown above. As shown in the above single user display results, combined with the portrait radar map, it can be seen that the reason influencing user behavior awareness is that the two indexes of user policy sensitivity and green electricity awareness are at a low level, while the price sensitivity and interaction willingness are at a high level. Load aggregators can increase publicity and popularize relevant policies and the significance of energy conservation and environmental protection to the user. Meanwhile, it can attract the user to participate in resource scheduling by adopting measures such as stepped electricity price or rebates for participating in resource scheduling.
To be clear, unlike match and adjustable potential, willingness to interact is an abstract concept. This evaluation method adopts the widely used social research method, and evaluates users’ willingness to interact by analyzing questionnaires, which can reflect users’ willingness to interact to a certain extent. But people’s thoughts and desires are not fixed, and are influenced by many factors beyond their control. Similarly, the assessment of compatibility and adjustable potential is based on past power data, and the quantitative result is an assessment of the capability demonstrated by the user. Therefore, during actual scheduling, the expected adjustable potential of the invited users should be much greater than the target scheduling value.
As user groups with high interaction intention, users of Group A, B, G and H are highly likely to agree to participate in response after being invited. The maximum potential value that these users can provide is 1410 kW, greater than the target value. However, considering the influence of possible uncontrollable factors, a certain margin should be reserved for the adjustable amount during the invitation. Therefore, Group C should be invited as a backup reserve. While such users are with lower willingness to participate DR. Under this circumstance, load aggregator is required to adopt the methods mentioned above to attract such users to participate. Added with Group C, the maximum theoretical potential can reach 1845 kW. While in Group C, among the users with low-level interactive willingness according to their portraits, users with relatively higher price sensitivity and higher potential can be invited prior to the other users. Because these users are more likely to be stimulated with higher incentives.
The number of invited 5 groups of users was 289, accounting for 57.3% of the total number. By establishing user portraits and user group management, the workload of demand response or resource scheduling can be reduced by nearly half and a certain margin can be left to ensure the reliability of DR projects. Moreover, it is proved that refined portrait technique can help making more detailed strategies for DR offer.
6 Conclusion
This paper proposed a DR oriented multi-dimension refined portrait technique of adjustable resources. With a multi-dimension user electricity interactive behavior evaluation index system constructed for DR, refine-grained electricity consumption data and user subjective behavioral questionnaire data are explored to fully characterize single user portrait. For massive user management in realistic DR program, three main tags are selected and applied to group tag management based on the multivariate DBSCAN clustering method. Such that, user groups can be graded to make DR project executed more efficiently. With refined portrait, aggregators can clarify the potential DR attendees with different attributes and make specified response strategies for different groups.
Data availability statement
The raw data supporting the conclusions of this article will be made available by the authors, without undue reservation.
Author contributions
SC Data curation, Formal analysis, Resources, Software, Validation, Visualization, Writing–original draft and revised version. LG Conceptualization, Data curation, Formal analysis, Methodology, Project administration, Supervision, Writing–review & editing. CC Data curation, Formal analysis, Methodology, Writing-original draft. KY Conceptualization, Investigation, Project administration, Supervision, Writing–review & editing. HP Data analysis, Methodology, Writing-original draft. ZQ Data analysis, Methodology, Writing-original draft. RD Data analysis, Methodology, Writing-original draft.
Funding
This study was supported by the Key R&D plan of Jiangsu Province (Grant No: BE2020688), State Key Laboratory of Alternate Electrical Power System with Renewable Energy Sources (Grant No: LAPS21003).
Conflict of interest
The authors declare that the research was conducted in the absence of any commercial or financial relationships that could be construed as a potential conflict of interest.
Publisher’s note
All claims expressed in this article are solely those of the authors and do not necessarily represent those of their affiliated organizations, or those of the publisher, the editors and the reviewers. Any product that may be evaluated in this article, or claim that may be made by its manufacturer, is not guaranteed or endorsed by the publisher.
Supplementary Material
The Supplementary Material for this article can be found online at: https://www.frontiersin.org/articles/10.3389/fenrg.2022.968368/full#supplementary-material
References
Asadinejad, A., Rahimpour, A., Tomsovic, K., Qi, H., and Chen, C.-F. (2018). Evaluation of residential customer elasticity for incentive based demand response programs. Electr. Power Syst. Res. 158, 26–36. doi:10.1016/j.epsr.2017.12.017
Bartusch, C., and Alvehag, K. (2014). Further exploring the potential of residential demand response programs in electricity distribution. Appl. Energy 125 (2), 39–59. doi:10.1016/j.apenergy.2014.03.054
Chen, X., Wang, J., Xie, J., Xu, S., Yu, K., and Gan, L. (2018). Demand response potential evaluation for residential air conditioning loads. IET Generation, Transm. Distribution 12 (19), 4260–4268. doi:10.1049/iet-gtd.2018.5299
Dehghanian, P., Fotuhi-Firuzabad, M., Bagheri-Shouraki, S., and Razi Kazemi, A. A. (2012). Critical component identification in reliability centered asset management of power distribution systems via fuzzy AHP. IEEE Syst. J. 6 (4), 593–602. doi:10.1109/JSYST.2011.2177134
Feng, C., Shao, C., Wang, X., and Wang, X. (2018). “Revealing generalized load characteristics with variable scale user portrait,”, Guangzhou, China, 2018 International Conference on Power System Technology (POWERCON)6-9 November 2018, 4062–4070.
Gan, L., Chen, X., Yu, K., Zheng, J., and Du, W. (2020). A probabilistic evaluation method of household EVs dispatching potential considering users’ multiple travel needs. IEEE Trans. Ind. Appl. 56 (5), 5858–5867. doi:10.1109/TIA.2020.2989690
Gellings, C. W. (1981). Power/energy: Demand-side load management: The rising cost of peak-demand power means that utilities must encourage customers to manage power usage. IEEE Spectr. 18 (12), 49–52. doi:10.1109/MSPEC.1981.6369703
Gils, H. C. (2016). Economic potential for future demand response in Germany-modeling approach and case study. Appl. Energy 162 (4), 401–415. doi:10.1016/j.apenergy.2015.10.083
Hu, H., Wang, Y., Han, J., Zhang, Y., and Yan, Q. (2021). “Analysis of user power consumption characteristics and behavior portrait based on KS-rf algorithm,” in 2021 IEEE/IAS Industrial and Commercial Power System Asia (I&CPS Asia), Chengdu, China, 18th to 21st July 2021, 1586–1590.
Hua, H., Qin, Z., Qin, Y., Dong, N., Ye, M., Wang, Z., et al. (2022). Data-driven dynamical control for bottom-up energy Internet system. IEEE Trans. Sustain. Energy 13 (1), 315–327. doi:10.1109/tste.2021.3110294
Huang, X., Qiu, Z., Su, J., Shi, Z., and Yan, L. (2021). “Knowledge graph-based user portrait construction for electricity enterprise suppliers,” in 2021 International Conference on Communications, Beijing, China, 14-23 June 2021 (Information System and Computer Engineering CISCE), 81–84.
Kong, Y., Cao, K., and Yin, Y. (2021). “User group portrait method of integrated energy system based on multi-source big data,” in 2021 International Conference on Information Science, Parallel and Distributed Systems (ISPDS), Hangzhou, China, Aug. 13 2021 to Aug. 15 2021, 25–29.
Labeeuw, W., Stragier, J., and Deconinck, G. (2015). Potential of active demand reduction with residential wet appliances: A case study for Belgium. IEEE Trans. Smart Grid 6 (1), 315–323. doi:10.1109/TSG.2014.2357343
Li, D., Zhang, H., and Zhao, Z. (2020). “Electrical power system equipment account recommendation technology based on the user portrait,” in 2020 International Conference on Intelligent Computing, Sanya, China, Dec. 4 2020 to Dec. 6 2020 (Automation and Systems ICICAS), 78–81. doi:10.1109/ICICAS51530.2020.00023
Li, H., Wu, G., Li, H., Gao, F., Long, X., and Xie, L. (2021). “Electric vehicle user portrait considering market response potential,” in 2021 IEEE 5th Conference on Energy Internet and Energy System Integration (EI2), Taiyuan, China, Friday, October 22 – Sunday, October 24, 2021, 3941–3946.
Liu, Y., Qiu, J., and Ma, J. (2021). SAMNet: Toward latency-free non-intrusive load monitoring via multi-task deep learning. IEEE Trans. Smart Grid 13 (3), 2412–2424. doi:10.1109/TSG.2021.3139395
Lu, S., Jiang, H., Lin, G., Feng, X., and Li, Y. (2018). “Research on creating multi-attribute power consumption behavior portraits for massive users,” in 2018 8th International Conference on Power and Energy Systems (ICPES), Colombo, Sri Lanka, 21-22 Dec. 2018, 54–59.
Rotger-Griful, S., Jacobsen, R. H., Nguyen, D., and Sorensen, G. (2016). Demand response potential of ventilation systems in residential buildings. Energy Build. 121, 1–10. doi:10.1016/j.enbuild.2016.03.061
Shafie-khah, M., Siano, P., Aghaei, J., Masoum, M. A. S., Li, F., and Catalão, J. P. S. (2019). Comprehensive review of the recent advances in industrial and commercial DR. IEEE Trans. Ind. Inf. 15 (7), 3757–3771. doi:10.1109/TII.2019.2909276
Shi, Q., Chen, C. -F., Mammoli, A., and Li, F. (2020). Estimating the profile of incentive-based demand response (IBDR) by integrating technical models and social-behavioral factors. IEEE Trans. Smart Grid 11 (1), 171–183. doi:10.1109/TSG.2019.2919601
Shi, Q., Li, F., Hu, Q., and Wang, Z. (2018). Dynamic demand control for system frequency regulation: Concept review, algorithm comparison, and future vision. Electr. Power Syst. Res. 154, 75–87. doi:10.1016/j.epsr.2017.07.021
Shi, Yan, Fan, Xin, Li, Wenjie, Liu, Jianfeng, and Ma, Hongbo (2016). “Study on key technology of power users credit rating evaluation based on big data,” in 2016 7th IEEE International Conference on Software Engineering and Service Science (ICSESS), Beijing, 26-28 Aug. 2016, 932–935.
ShiLu, Y. Zhang, Y., and Tian, Y. (2020). “The load portrait method for urban substation based on clustering,” in 2020 2nd International Conference on Artificial Intelligence and Advanced Manufacture (AIAM), Manchester, United Kingdom, Oct. 15 2020 to Oct. 17 2020, 104–108.
Tang, G., Wu, K., Lei, J., Bi, Z., and Tang, J.. From landscape to portrait: A new approach for outlier detection in load curve data. IEEE Trans. Smart Grid 5 (4), 1764–1773. 2014 doi:10.1109/TSG.2014.2311415
Wang, T., Hu, J., Li, C., and Zhang, Z. (2017). “Research on tariff recovery risks assessment method based on electrical user portrait technology,” in 2017 6th International Conference on Computer Science and Network Technology (ICCSNT), Dalian, China, 21-22 Oct. 2017, 218–221.
Yan, W. H., Jiang, F., Liu, A. S., Xu, J. L., and Zhang, S. Y. (2021). “Comprehensive energy efficiency rating evaluation model of enterprise power based on grid big data,” in 2021 International Conference on Information Control, Electrical Engineering and Rail Transit (ICEERT), Lanzhou, China, Oct. 30 2021 to Nov. 1 2021, 83–86.
Yu, Z., Liu, L., Chen, C., Zhang, W., Ju, X., and Zhang, L. (2019). “Research on situational perception of power grid business based on user portrait,” in 2019 IEEE International Conference on Smart Internet of Things (SmartIoT), Tianjin, China, 9-11 Aug. 2019, 350–355.
Zhang, Q. (2019). “Portrait analysis of power transmission line for smart grid based on external data association fusion.” Chinese Control Conference (CCC), China, Guangzhou, 27-30 July 2019, 3798–3803.
Zhong, C., Shao, J., Zheng, F., Zhang, K., Lv, H., and Li, K. (2018). “Research on electricity consumption behavior of electric power users based on tag technology and clustering algorithm,” in 2018 5th International Conference on Information Science and Control Engineering (ICISCE), Zhengzhou, China, July 20-22, 2018, 459–462.
Keywords: adjustable resource assessment, demand response, combined operation and survey data, combination weighting approach, density-based clustering algorithm, refined portrait
Citation: Chen S, Gan L, Chen C, Yu K, Pi H, Qian Z and Dai R (2022) Demand-response oriented multi-dimension refined portrait of adjustable resources based on load and survey data fusion. Front. Energy Res. 10:968368. doi: 10.3389/fenrg.2022.968368
Received: 13 June 2022; Accepted: 18 July 2022;
Published: 17 August 2022.
Edited by:
Jun Liu, Xi’an Jiaotong University, ChinaReviewed by:
Shiwei Xia, North China Electric Power University, ChinaTao Chen, Southeast University, China
Copyright © 2022 Chen, Gan, Chen, Yu, Pi, Qian and Dai. This is an open-access article distributed under the terms of the Creative Commons Attribution License (CC BY). The use, distribution or reproduction in other forums is permitted, provided the original author(s) and the copyright owner(s) are credited and that the original publication in this journal is cited, in accordance with accepted academic practice. No use, distribution or reproduction is permitted which does not comply with these terms.
*Correspondence: Lei Gan, bGVpZ2FuQGhodS5lZHUuY24=