 Wu Tianfan
 Xue Feng2
 Ding Shuo
 Wang Li
 Li Wanai
95% of researchers rate our articles as excellent or good
Learn more about the work of our research integrity team to safeguard the quality of each article we publish.
Find out more
ORIGINAL RESEARCH article
Front. Energy Res. , 19 August 2022
Sec. Nuclear Energy
Volume 10 - 2022 | https://doi.org/10.3389/fenrg.2022.967855
This article is part of the Research Topic Dynamics and Control for Nuclear Energy View all 8 articles
During a design basis accident in a pressurized water reactor (PWR), the released hydrogen through reactor breaks would induce the hydrogen detonation. The hydrogen passive autocatalytic recombiner (PAR) is widely used as a hydrogen elimination measure in nuclear power plants due to its passive capability, low starting threshold and easy installation. The present work aims to study the hydrogen risk after the occurrence of cold section double-end shear fracture large break loss coolant accident (LBLOCA) by using the 3D computational fluid dynamics program GASFLOW. A full containment model of CPR1000 is built. The hydrogen production rate inside the containment after LBLOCA is calculated from the related physicochemical reactions. The hydrogen transport, hydrogen concentration distribution and temperature distribution inside the containment are simulated. The effects of different roughness of the structure surface on the simulation are investigated, and it is proved that the operation of PAR can control the hydrogen concentration under the safety threshold of 4 vol%. The effects of hydrogen flow rate and PAR’s position on the hydrogen elimination efficiency are studied. Based on these studies, this paper makes some suggestions and theoretical references for the spatial arrangement scheme of PAR in the containment to optimize the hydrogen elimination efficiency.
After the Fukushima nuclear accident in Japan in 2011 (Lam et al., 2022), governments and institutions worldwide put more emphasis on nuclear power safety (Xiao et al., 2017). When a break accident (e.g., LOCA) occurs, the hydrogen is released as a result of the zirconium water reaction and water radiolysis (IAEA TecDoc 1661, 2011), and will leak into the containment atmosphere through the break, possibly creating an accumulation in some compartments, forming a density stratification (Paranjape et al., 2019), or a mixture of gases with oxygen and water vapor. The flammability of the gas mixture is related to the temperature, pressure, components and the presence of an ignition source. Combustion, or even a flammable explosion (DDT), which lead to containment failure, can occur when the volumetric concentration of hydrogen reaches the flammable concentration limit 4 vol% (Heidari and Wen, 2014) (Gamezo et al., 2007).
Most of the current studies on hydrogen risk focus on severe accidents. A systematic hydrogen behavior analysis and severe accident mitigation program is put forward to simulate the hydrogen source and diffusion process (Breitung and Royl, 2000). Korea Atomic Energy Research Institute (KAEAI) used GASFLOW software to analyze the behavior of hydrogen and steam in APR1400 containment during the total loss of feedwater accident (lofw) (Kim et al., 2007). Netherlands joint research center studied the hydrogen mitigation measures in VVER-440/213 containment with GASFLOW, FLUENT program and CFX code (Heitsch et al., 2010).
Among the existing hydrogen elimination equipment in nuclear power plant, passive autocatalytic recombiner (PAR) is a more widely used hydrogen elimination measure at present because of its advantages of passive and low start-up threshold. The basic principle of PAR is to load platinum (Pt), palladium (Pd) and other metals on the catalytic plate in the form of alloy as catalyst (Sandeep et al., 2014), (Yu et al., 2017), so that hydrogen and oxygen can carry out composite reaction and reduce the hydrogen concentration in containment. Therefore, it can carry out catalytic recombination well even at low temperature. The research on PAR is usually carried out through bench test and numerical simulation.
The cadarache experimental center of the French Atomic Energy and Alternative Energy Commission (CEA) carried out the H2-PAR experiment (Payot et al., 2012). FR90/1–150 hydrogen recombiner produced by Siemens was used in the experiment to eliminate hydrogen in the early stage of the accident.
The THAI experiment, was carried out by BT company in Germany (Yáñez et al., 2012) to determine the effect of different gas shares on the hydrogen elimination rate and the ignition effect under different experimental conditions (Flores y Flores and Mazzini, 2020). In addition, researchers have tested the performance of hydrogen elimination in PAR with different gas concentrations using the SURTSEY experimental setup (Blanchat and Malliakos, 1997). The European Union has also carried out experimental research on hydrogen elimination by thermal insulation catalytic coating (THINCAT) (Fischer et al., 2003). These bench experiments have a common point: there will be combustion in the hydrogen recombiner under certain conditions. This is a potential hazard for all PAR, therefore Germany’s Ulrich Research Center (FZJ) proposed the design concept of a new recombiner (Reinecke et al., 2004).
In terms of numerical simulation, a CFD model of hydrogen consumption by PAR is validated (Halouane and Dehbi, 2018), and the PAR performance under potentially adverse counter-current flow conditions is investigated using CFD tools (Meng et al., 2020). Atomic Energy Regulatory Board of India proposed a point model and a detailed set of reaction kinetics equations to simulate hydrogen mitigation using catalytic recombiner in containment (Raman et al., 2020). In general, these work mainly studies the influence of calculation model, injection rate and hydrogen elimination measures on hydrogen concentration distribution, but most of them are in the case of severe accidents, and there is no systematic study on the hydrogen behavior under design basis accidents.
This paper is to analyze the hydrogen behavior, verify the hydrogen elimination performance of PAR, and finally give a reasonable arrangement scheme of PAR in case of cold section double-end shear fracture large break loss of coolant accident in the containment. Sections 2.1, 2.2 give a brief description of the CPR1000 containment model studied in the present work. Section 2.3 presents the numerical simulation methods for hydrogen behavior. Section 3 gives the simulation results and the corresponding discussion including the model validation, roughness sensitivity analysis, hydrogen transportand hydrogen concentration distribution Section 4 presents the study of the spatial arrangement of PAR in the containment. The main conclusions are summarized in Section 5.
The Daya Bay Nuclear Power Station uses the prestressed concrete containment design of the CPR1000. Figure 1 shows the cross-section of the containment, equipped with a spray system which is automatically switched on about 1 minute after a break occurs.
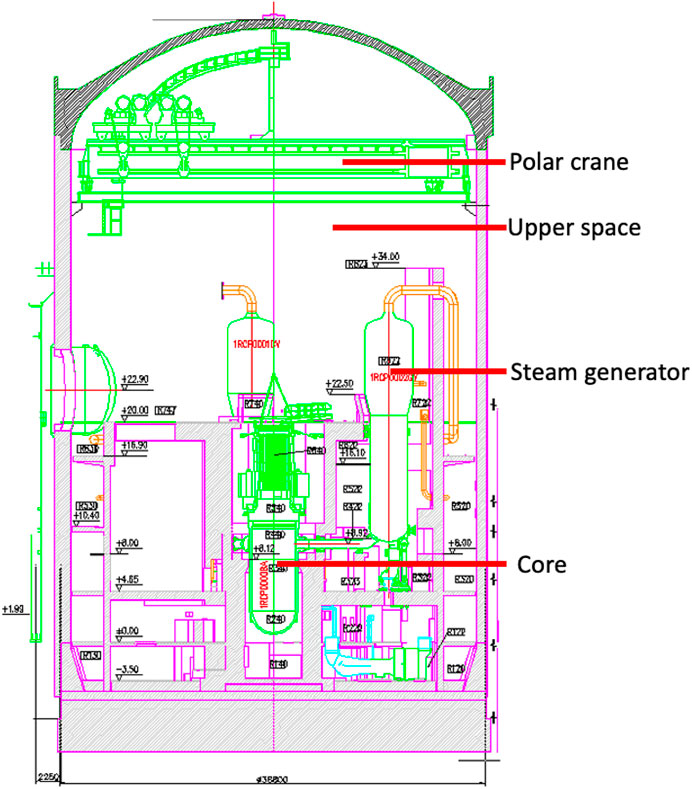
FIGURE 1. Daya Bay containment profile.
The containment model is built in a cylindrical coordinate system based on the actual geometric parameters of the Daya Bay Unit one containment: the modelled dimensions in the radial and containment height directions are 18.6 and 61.5 m respectively.
The containment structure of an actual nuclear power plant is very complicated, with a large number of structures and mostly irregular shapes. If all structural bodies are to be accurately described, a very refined mesh is required, greatly increasing the number of meshes, which will greatly reduce the efficiency of later calculations. Therefore, some approximations and simplifications of the actual shapes of the compartments, structures and equipment are required for the modelling. The principle of simplification is that only the compartments where no critical equipment is present and where the impact on hydrogen behaviour is not significant under design basis accidents can be simplified. The main compartments built in the model include reactor coolant pump compartments, steam generator compartments, pressurizer compartment, RRA compartment and pressurizer relief tank compartment. Their accessibility to the outside world and the location of the openings where hydrogen could enter and exit were largely consistent with the actual situation. Some small compartments and a large number of small components and piping are combined in view of the fact that the overall hydrogen flow there is very fluid.
In this paper, two meshing systems are used in modeling, the first meshing system has 60480 meshes in total with an average mesh volume of 1.1
The grid in the circumferential direction is arranged in a uniform way using a uniform grid arrangement with 72 meshes. And in the height direction, the grid is unevenly arranged with 42 meshes.
So far, the principles of modelling and the approximation principles have been described and analysed in this chapter. To better present the containment model, an interface program is developed to convert the geometric model created in GASFLOW into the CFD results visualisation software Tecplot. Figure 2 shows the GASFLOW containment geometry model in different orientations. The total free volume in the containment is approximately 49400
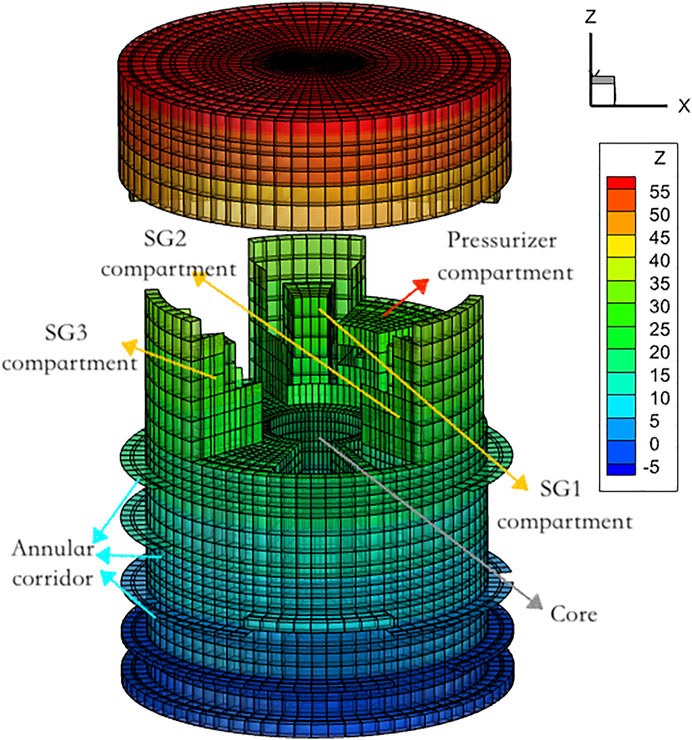
FIGURE 2. Overall structure of the containment.
Figure 2 shows the overall structure of the containment, where the full view of the containment can be seen in this view, with the dome at the top, the three steam generator compartments equally spaced around the core in the center, the SG1 compartment next to the pressurizer compartment, the reactor core, the annular corridor platform on each floor, and the remaining compartments obscured by walls.
When the break is just created, the flow rate can reach the order of several tons per second. The fluid at this stage was mainly high temperature and high pressure water, and the hydrogen content in the fluid was negligible, which would not cause accidents such as ignition and explosion, so the behavior of hydrogen was negligible. After the accident, the temperature inside the containment rises rapidly to 450 K and the pressure rises to 3 bar. In condition 1: Assuming that the spraying is on at the first time, the temperature and pressure inside the containment begins to decrease, while the flow rate released from the break also decreases slowly with time, when the pressure is reduced to 1 bar and the temperature drops to 313 K, the simulation calculation of hydrogen behavior begins, and the initial condition of the containment atmosphere is set to 19.5 vol% for oxygen, 73.22 vol% for nitrogen, and 7.28 vol% for water vapor. The temperature of the structure is 313 K, and the condensation model is turned on. It is assumed that the hydrogen produced by the reaction of dissolved hydrogen and zirconium water in the reactor coolant is released through the break within 400 s, and after 400 s only the hydrogen produced by the core water irradiation is available at the break, and the flow rate is set as shown in Table 1 below.

TABLE 1. Condition one breakout flow parameters.
In condition 1, two PAR are placed in the model. The recombiners’ parameters refer to the FR90 produced by Siemens, which are located at a height of 30.15 m in the steam generator one compartment and the steam generator two compartment.
The cold section double-end shear fracture large break accident occurs in the cold pipe section of the primary loop reactor coolant pump. The high-temperature fluid and radioactive material inside the core is released into the containment through the break, rapidly heating the air inside the containment, causing the temperature and pressure to rise rapidly. The core was gradually exposed and heated up as the coolant was rapidly lost during the process of ejecting fluid from the break. About 400 s after the accident, the fuel temperature will rise to 1300 K. The zirconium water reaction starts, releasing a large amount of hydrogen within a short period of time. Afterwards, emergency cooling water is injected and the core gradually cooled down.
The mass-energy release point is the location where mass and energy will be released. When cold section double-end shear fracture large break accident occurs, hydrogen is generated mainly by three ways: water radiolysis, zirconium water reaction and corrosion of containment metal by spray solution as shown in Table 2. The location of the mass energy release point was also set based on these three causes of generation. The location of the break is placed in the cold pipe section of the primary loop, located in the RCP two compartment. Radiolysis of water occurs in core and sump, while corrosion of aluminum produces H2 in plant space in containment.
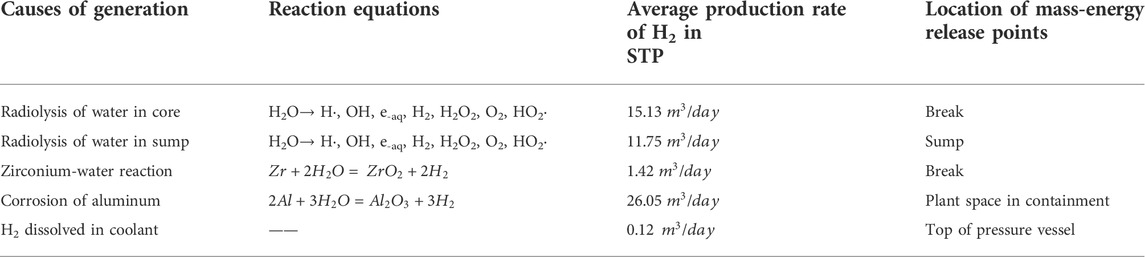
TABLE 2. Hydrogen production during LBLOCA accident (Ershov and Gordeev, 2008).
The following condition 2 (Xiao et al., 2007) is used for model validation: the initial pressure in the containment was 0.3 MPa, the initial temperature was 450 K, and the initial conditions of the containment atmosphere were set to 10.5 vol% for oxygen, 39.5 vol% for nitrogen, and 50.0 vol% for water vapor. Only the break is considered as a mass energy release, the flow rate is set to 2 kg/s, the mass of hydrogen is 10%, the mass of water vapor is 90%, and the calculation time is 1000 s. Monitoring points were set above the break and at the dome to record the local flow parameters. Figure 3 shows the cross section where the break is located, showing the specific locations of the two monitoring points.
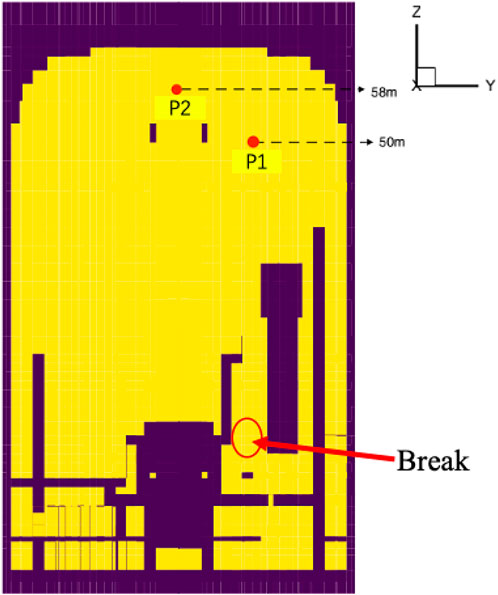
FIGURE 3. Two monitoring points for recording local flow parameters.
The variation of hydrogen concentration at the two monitoring points is calculated by Fluent (Xiao et al., 2007) and GASFLOW seperatel (Figure 4). The changes in concentration at monitoring point one are more consistent between the two software, with a sudden increase in concentration when the break first starts to release, followed by a decrease and then a flat increase. The concentration changes at monitoring point two were slightly different, but the trends of Fluent and GASFLOW results were consistent. In general, Fluent’s model showed a faster rise in hydrogen concentration and fluctuations during the rise, which is quite consistent with the characteristics of turbulent instability, but the overall results were not much different from GASFLOW.
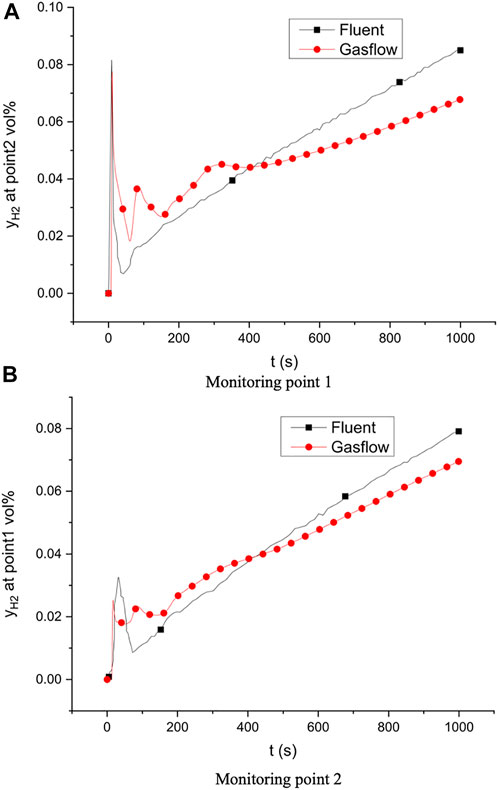
FIGURE 4. Hydrogen concentrations at monitoring points. (A) Monitoring point 1 (B) Monitoring point 2.
Figure 5 shows the distribution of the hydrogen concentration field at 1000 s under working condition two calculated by different software.
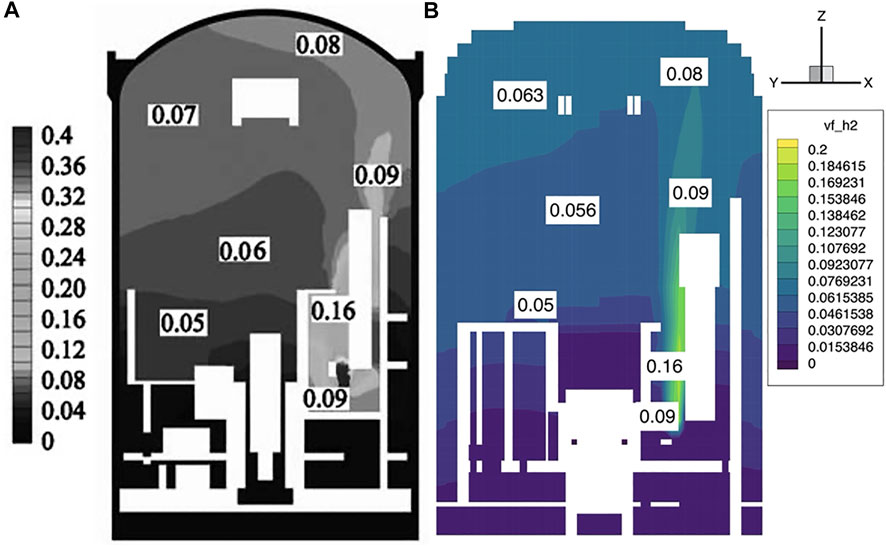
FIGURE 5. Hydrogen concentration field distribution at 1000 s. (A) FLUENT (B) GASFLOW
From Figure 5, it can be seen that the results using the GASFLOW and FLUENT match very well. The hydrogen concentrations in the dome are both around 8 vol% and the stratification is similar. Both software simulates the hydrogen transport well. The calculation results in this section verify the reliability of the containment model built by GASFLOW, on which the subsequent calculations are based.
From the convective heat transfer equation, the rate of convective heat transfer is related to the convective heat transfer coefficient, temperature difference and heat transfer area. Increasing the surface roughness of thermal components can effectively increase their heat transfer area, and also increase the heat transfer coefficient by disturbing the flow of fluid on the surface. In fact, the surfaces of thermal components inside the containment are not absolutely smooth. The sensitivity analysis in this section will investigate the hydrogen behavior and some thermal performance under the LBLOCA accident with smooth surface and surface roughness of 0.1 and 2 cm of the thermal components. The calculations in this section use the assumption of condition 3 (the flow rate of break is increased to 1000 g/s, the initial atmospheric pressure is adjusted to 1.2 bar, and the rest of the conditions are same with condition1).
Figure 6A gives the variation of hydrogen concentration in the RCP two compartment where the break is located and in the dome for the three kinds of roughness. There is a more significant difference in the hydrogen concentration in the reactor coolant pump two compartment, especially after the PAR is turned on, and the smoother the thermal component, the higher the hydrogen concentration, while there is almost no difference in the hydrogen concentration in the dome.
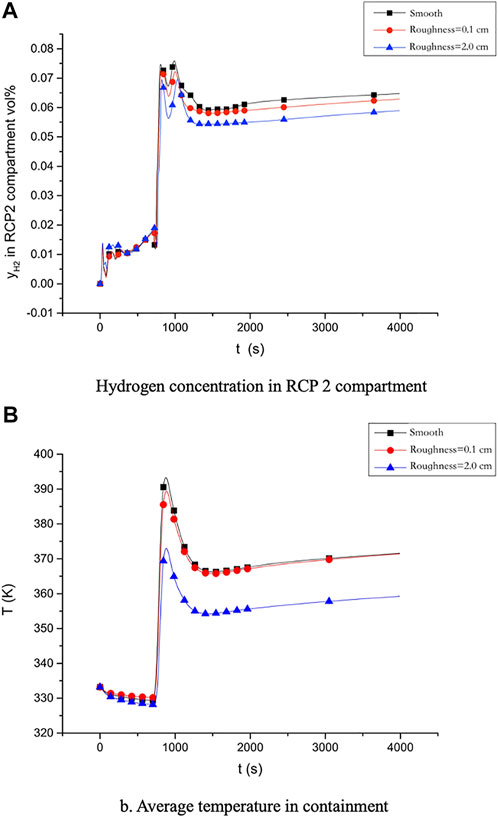
FIGURE 6. Hydrogen concentration and average temperature variation with different wall roughness. (A) Hydrogen concentration in RCP two compartment (B) Average temperature in containment.
Figure 6B is the average temperature in the containment under different wall roughness which shows the larger the surface roughness of the thermal component, the smaller the average temperature in the containment. The comprehensive analysis of the above results shows that increasing the surface roughness of the thermal components by covering smooth surface with rough coating can effectively reduce the average temperature inside the containment as well as the hydrogen concentration in the break compartment under the design basis accident. Section 3.4 adopts the assumption of smooth walls to obtain more conservative results.
Figure 7 selects six representative moments during LBLOCA that show the velocity field in the steam generator 2 (SG2) compartment under condition 1.
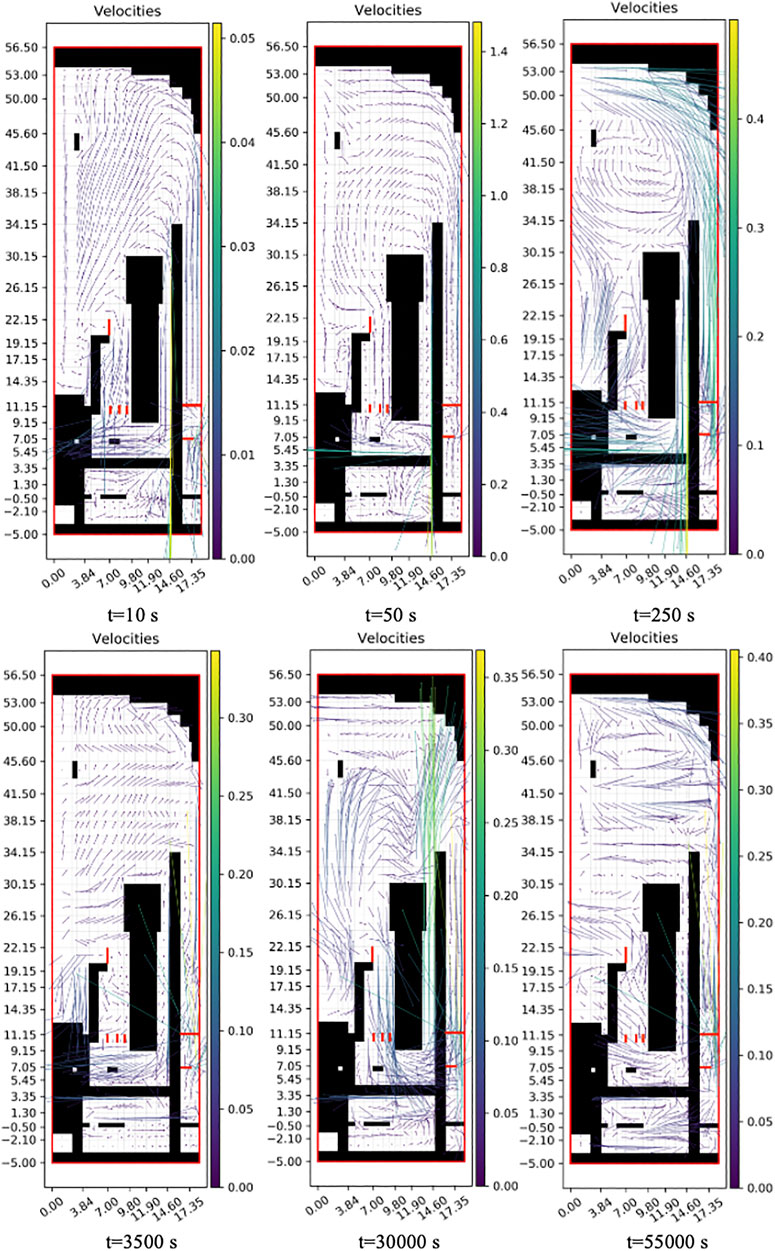
FIGURE 7. Velocity vector distribution in the longitudinal section of SG2 compartment.
As can be seen from the figure, the hydrogen transport in the LBLOCA accident can be divided into five main stages.
When break appeared, the injection rate of hydrogen was quite large, and the gas flow from the break into the containment drove the gas inside the containment and gradually accelerated, and the peak velocity of 1.4 m/s appeared at 50 s. At t = 10 s, the gas at this stage was mainly in upward motion, and the gas released from the break relied on its own initial kinetic energy and buoyancy to flow upward, but the velocity decayed faster. The velocity of the gas in most areas is around 0.01 m/s. When flowing to the narrow area around the steam generator compartments, the flow path became narrower, and due to the existence of the pressure difference between inside and outside, the gas was sucked into these narrow compartments and accelerated with a velocity significantly greater than that of the open area, which was also the area where the velocity peak of 1.4 m/s was located.
During the gas acceleration phase, the natural circulation was also gradually formed, and at 250 s, a more pronounced natural circulation flow field appeared. Two vortex circulations were formed in the area above the steam generator, between 30 and 45 m in height, and above the pressure vessel, between 14 and 34 m. In general, when the flow velocity of the break is large, the pressurizer compartment near the break and the open space in the middle and upper part of the containment are more affected. At 300 s, in the pressurizer compartment, a large density difference between the external gas and the internal gas leads to the appearance of shear motion and the entry of hydrogen-containing gas into the pressurizer compartment. The gas flow in pressurizer compartment is not smooth, so the hydrogen gas aggregation and density stratification tend to occur there.
After 400 s, the flow rate of the breakout decreased from 345.4 g/s to 6.2 g/s, and the initial kinetic energy of the gas ejected was greatly reduced, and the rise of the gas at this stage mainly relied on buoyancy, and the radial motion of the mixed gas mainly relied on diffusion. The velocity field diagram at t = 3500 s shows that the axial velocity at 30 m, 41.5 m height is very small, and most of the velocity components are in the radial direction, indicating that the gas at this height has become advection from the initial upward motion, and the velocity of the gas in the entire middle and upper part of the containment has become small.
When the hydrogen concentration around the hydrogen recombiner reaches 2 vol%, the recombiner will turn on automatically, and the gas will be inhaled from the bottom inlet, and the hydrogen-oxygen recombing reaction will occur inside, and then the reacted gas will be ejected from the top end. The ejected gas gained the extra kinetic energy given by the recombiner, which will cause a great disturbance to the flow field already formed inside the containment. At t = 30000 s, a stable flow field is initially formed.
The velocity of the gas ejected from the hydrogen recombiner was about 0.3 m/s, which was much higher than the velocity of the surrounding gas of 0.05 m/s. There was an obvious phenomenon of “entrainment effect” at the radial coordinate of 14.6 m and the height of 32 m. The velocity vector in this area was much larger than the axial component, and the vector arrow pointed to the hydrogen recombiner.
When the hydrogen concentration around the hydrogen recombiner is lower than 2 vol%, the recombiner will automatically shut down, and without this disturbance, the hydrogen transport will be calm again, similar to the third stage. But at this time the gas components are completely different from the original, the hydrogen content in the gas mixture has been greatly reduced, which also leads to the concentration stratification at this time is different from the third stage. As can be seen from the figure, the axial velocity of the gas in this stage is smaller than that in the third stage, because the least dense gas is eliminated, the density difference of the remaining gas is greatly reduced, so the buoyancy force obtained becomes smaller, and the gas no longer has so much upward momentum, but more of a radial advection.
The hydrogen concentration over time in reactor coolant pump compartments, steam generator compartments and the pressurizer compartment is shown in Figure 8 respectively. The concentration monitoring points were placed in the upper part of these compartments, where hydrogen gas tends to accumulate. During the peak stage of the release flow from the break (0 to 400 s), the hydrogen concentration in both the reactor coolant pump and steam generator compartments spiked, especially in the RCP two compartment where the break was located, the hydrogen concentration rose to 3.7 vol% at 20 s and kept the peak concentration until about 400 s. After 400 s, the flow rate of the break becomes smaller and the jet speed decreases significantly, at this time, the hydrogen transport mainly relies on buoyancy and diffusion, and the hydrogen emitted from the break takes a longer time to reach the monitoring point, while before that, the high concentration hydrogen has been fully mixed with the surrounding atmosphere, so the hydrogen concentration at the monitoring point dropped rapidly.
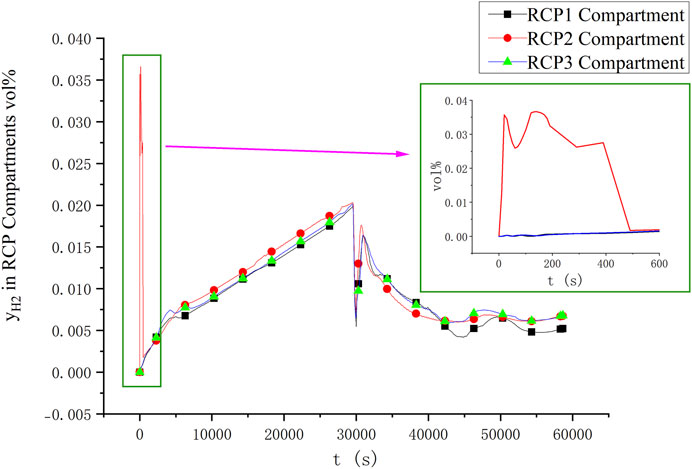
FIGURE 8. Variation of hydrogen concentration in RCP compartments.
After 400 s, the changes of hydrogen concentration in the three RCP compartments were almost the same. The hydrogen concentration in RCP compartments decreases rapidly after the hydrogen recombiner is turned on, then it will rise again when the hydrogen concentration drops to the minimum value, and the rate of rise is even greater than the natural growth rate before the recombiner is turned on, which proves the existence of “entrainment effect”. The hydrogen recombiner eliminates a large amount of hydrogen, which causes a density difference between the gas in these compartments and the surrounding area, and then the shear force “squeezes” the high concentration of hydrogen into these compartments. The hydrogen concentration in the containment did not exceed the safety threshold of 4 vol% throughout the LBLOCA accident.
The spatial distribution of hydrogen concentration in the containment is shown in Figure 9. The hydrogen concentration distributions of the longitudinal sections of the break and pressurizer compartment are intercepted at t = 390 s (peak flow rate at the break), t = 29300 s (the moment when the total amount of hydrogen in the containment is the highest before the hydrogen recombiner is turned on), and t = 50000 s (hydrogen elimination is basically completed).
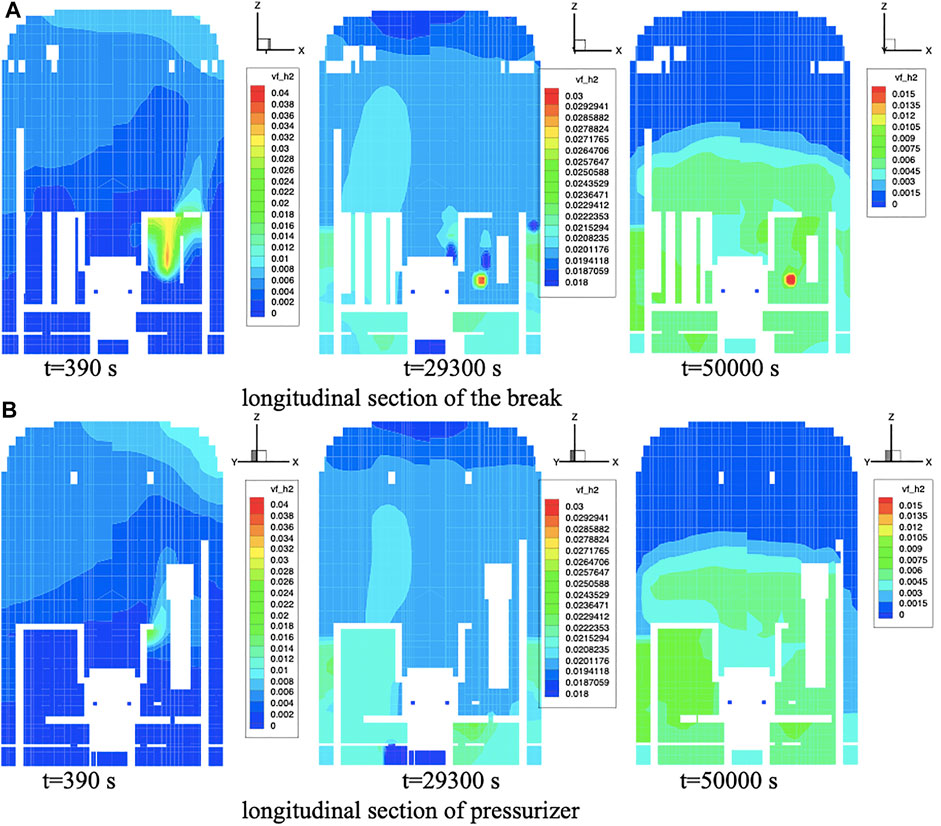
FIGURE 9. Hydrogen concentration distribution in different compartments. (A) longitudinal section of the break (B) longitudinal section of pressurizer.
As can be seen from the figure, in the first 400 s, the breakout jet is in the peak stage, the breakout is located in the reactor coolant pump two compartment and hydrogen “accumulation” phenomenon appears in SG2 compartment next to the break, but the peak concentration is less than 4 vol%, so there is no safety risk of deflagration. At this stage, because the velocity of the break jet is very high, the high concentration of hydrogen can reach the high part of the containment with the initial kinetic energy, which makes the upper part of the containment form a very obvious stratification of the hydrogen concentration.
As the flow rate of the break drops, the jet no longer has the initial kinetic energy to reach the dome directly, and the jet fluid will “stagnate and accumulate” during its ascent because of the damping effect of the space fluid on it, as evidenced by the concentration distribution between the compartments of the break at 29300 s. At this time, the gas in the upper part of the containment mainly relies on buoyancy and molecular diffusion, while the hydrogen in the middle part of the containment rises and is replenished by the mass energy release point at the same height, so the concentration is slightly higher than that in the upper part.
After the hydrogen recombiner turned on, the hydrogen mass decreases rapidly, and by 50,000 s, the hydrogen elimination has been basically completed. The recombiner inhaled the high concentration of hydrogen at the height of 30 m. After the recombing reaction, the concentration was reduced to 0 and released upward, so that the hydrogen concentration in the upper space of the containment gradually decreased to 0. The concentration gradient still existed in the middle and lower parts because the mass-energy release point was continuously releasing hydrogen. In addition, there is an obvious phenomenon of “accumulation stratification” in pressurizer compartment, in the process of hydrogen release, either by shearing or by diffusion, the high concentration of hydrogen enters the pressurizer compartment, but because of the poor ventilation inside and outside the compartment, it is difficult to be directly affected by the hydrogen recombiner. The hydrogen concentration in the compartment is significantly higher than that outside the compartment, and because of the light density of hydrogen, there is a stratification of hydrogen concentration in the compartment.
Figure 10 gives the temperature field distribution after the hydrogen recombiner is opened. It can be seen that the temperature of the gas emitted from the hydrogen recombiner is obviously higher than that of the surrounding gas, and when it is first opened, the rate of recombing reaction is also larger due to the larger hydrogen concentration, and a large amount of reaction heat will be released, and the temperature gradient in the upper part of the containment is about 50 K at this time. By the time the hydrogen elimination is basically completed, the recombing rate of the hydrogen recombiner has been greatly reduced, and the reaction heat released is obviously less, and the temperature distribution is very stable at this time, the stratification line is almost horizontal, and the temperature gradient is small, only about 15 K.
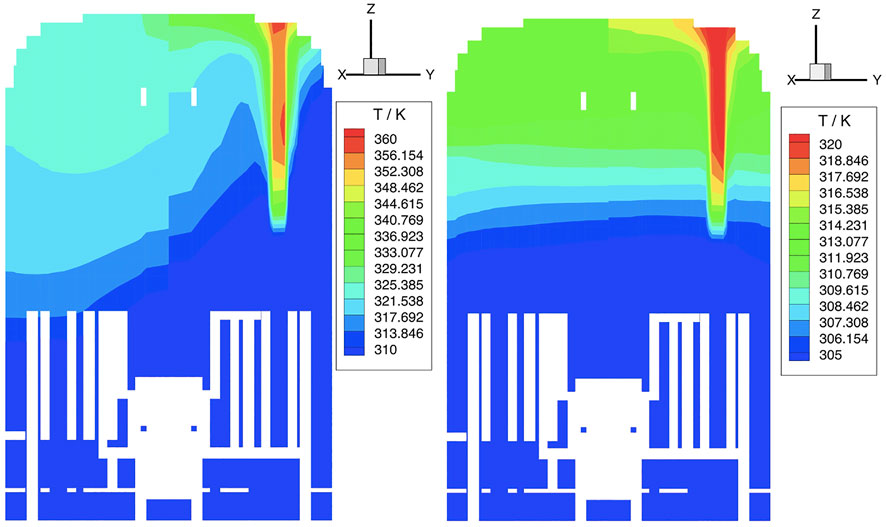
FIGURE 10. Temperature distribution in the longitudinal section of the hydrogen composite.
The above analysis shows that during the LBLOCA, hydrogen will accumulate in some compartments of the containment, and in the stage of high release rate of the break, the RCP compartment and SG compartment receive the direct influence of the break and produce hydrogen accumulation. The high velocity jet reaches the dome and returns downward into the lower compartments as well as the annulus, and produces stratification in the lower part, which indicates poor gas flux in the lower part, weak gas flow and weak heat exchange. Later on, the pressurizer compartment also generates hydrogen accumulation. In order to reduce hydrogen risk, CPR1000 nuclear power plants can add ventilation systems and deflectors in critical compartments, and also inject inert gas into the containment at moments when accumulation is likely.
The hydrogen elimination efficiency of PAR can greatly affect the behavior of hydrogen after a design basis accident, and a good elimination efficiency can ensure the safety of the containment.
Changing the internal structure from perspective of the reaction mechanism can well change the hydrogen elimination performance of PAR. For example, the shape of catalytic plate (Park and Khor, 2016), (Park et al., 2011), catalyst particle size (Tuo et al., 2018), (Zhu et al., 2015), and heat transfer mechanism around the catalyst surface (Agrawal et al., 2017), (Agrawal et al., 20152015) can all have an effect on the efficiency of PAR.
Without changing PAR model as well as the internal configuration, the arrangement scheme also has a significant effect on the hydrogen elimination efficiency. In this paper, instead of studying the catalytic reaction and the internal configuration of the PAR at the level of the catalytic reaction and the hydrogen recombiner, the effect of the breakout hydrogen flow rate as well as the arrangement scheme was mainly studied. The scheduling methods and principles are referred to the work of Vikram Shukla et al. (2019), Shukla et al. (2021). The initial condition settings for the simulation calculations in this chapter still use the assumption of working condition 3.
Based on the hydrogen transport behavior after the LBLOCA accident in Section 3.4, the hydrogen velocity field and concentration field in the containment gradually converge to a steady state when PAR is turned on. In this chapter, the effects of the hydrogen flow rate at the break and the location of the on the hydrogen elimination efficiency and steady state hydrogen concentration are investigated under the existing modeling conditions.
The hydrogen flow rate at the break directly affects the jet velocity and the time for the jet to reach the hydrogen recombiner, which in turn affects the flow field in the containment as well as the hydrogen concentration field. In this section, three different hydrogen flow rates are set up as 500 g/s, 1000 g/s and 1500 g/s, without changing the fluid components of the break and the total mass of hydrogen ejected.
As the hydrogen elimination reaches steady state, the hydrogen mass curves for all three conditions level off and it is observed that the lower the breakout flow rate, the lower the total mass of hydrogen in the containment. Figure 11 illustrates the variation in hydrogen concentration in RCP two compartment, the faster the hydrogen concentration in the vicinity of the hydrogen recombiner reaches the start-up threshold, and the start-up times of the hydrogen recombiner for the three operating conditions are 1338 s, 720 s and 516 s respectively, which are not purely linear in relation to the breakout flow rate ratio. The overall trend is consistent with common sense, with the hydrogen concentration in case 500 g/s being less than the other two cases when steady state is reached. This is because when the jet is first ejected from the break, there is some accumulation in the RCP two compartment, as shown in Figure 9, and the higher the flow rate, the more accumulation there is. The dome, on the other hand, is more open and the jet passes through the hydrogen recombiner before reaching the dome, so the hydrogen concentration at the dome for the three operating conditions is different but the difference is not significant.
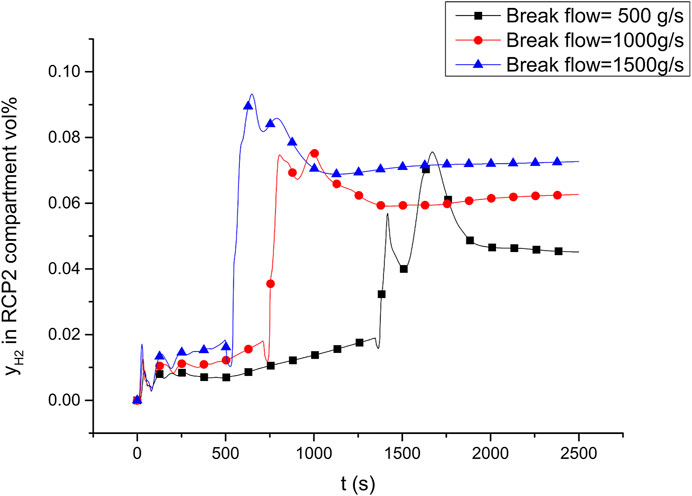
FIGURE 11. Hydrogen concentration in RCP2 compartment.
In order to investigate the effect of the PAR discharge location on the hydrogen elimination efficiency, four different discharge scenarios were set up, as shown in Table 3. The location coordinates of the breakout source in column coordinates are (11 m, 2.5°, 8.5 m), located in compartment two of the RCP, with a breakout flow rate of 1000 g/s and a hydrogen mass percentage of 0.1 for the four operating conditions.
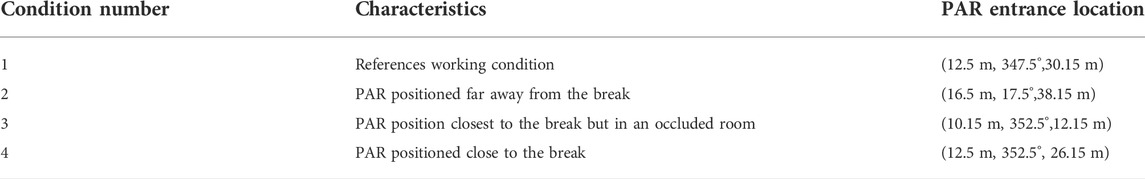
TABLE 3. Simulated working conditions for the PAR position study.
Figure 12 shows the variation in hydrogen concentration in the break compartment. From these results it can be seen that the efficiency of PAR, and the hydrogen concentration field in the containment, is strongly influenced by the spatial arrangement of PAR.
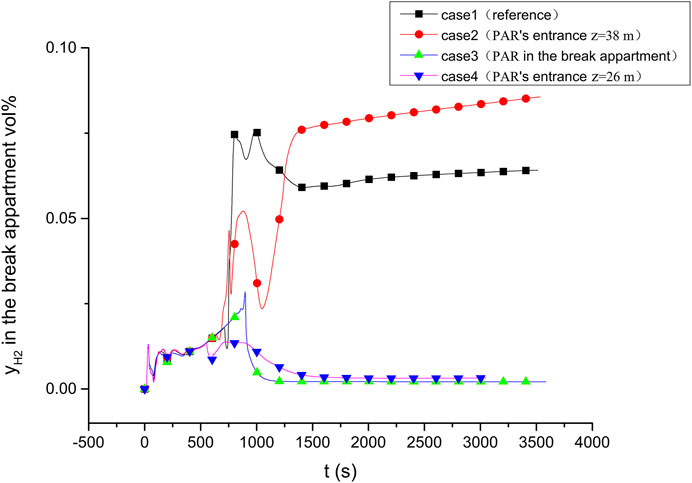
FIGURE 12. Hydrogen concentration in the break compartment.
The hydrogen recombing efficiency increases significantly when PAR is close to the hydrogen source (case 3). The hydrogen concentration in the RCP2 compartment, where the break is located, is the lowest in this condition at steady state and does not exceed 2.5 vol% throughout, far below the peak of case 1 and 2, which is consistent with common sense.
Combined with the area outside the breaker compartment, the hydrogen elimination efficiency R of several arrangements satisfies Rcase4 > Rcase3 > Rcase1 > Rcase2. Generally speaking, the closer PAR is to the hydrogen source, higher the hydrogen elimination efficiency is. But it is worth noting that although PAR in case 3 is closest to the breaker source, it is located in a more confined space inside the RCP compartment. However, it is worth noting that although PAR for case 3 is closest to the breakout source, it is located in a more confined space inside the RCP compartment, which results in a limited range of action, and there is also a small flow of hydrogen outside the breakout compartment, so the concentration in case 3 is greater than in case 4 in areas such as the pressurizer compartment and the dome.
When PAR is too far away from the hydrogen source (case 2), the flow field near the hydrogen source has little effect, and even the hydrogen concentration continues to grow in the breakout compartment after the recombiner is opened.
Based on the research in this paper, the following recommendations are made for the arrangement of PAR.
1) The distance between PAR and the hydrogen source is quite importmant. Due to the uncertainty of the location of the break, the PAR can be appropriately placed in areas where breaks are likely to occur such as near the hot pipe section of the primary loop, the cold pipe section and the steam pipeline.
2) PAR should be placed in open and vacant area. During actual incidents, there may be multiple hydrogen sources, and they may be far apart. PAR in open area will cover these areas to the maximum extent, while facilitating the formation of a natural circulation and maximising the efficiency of hydrogen elimination.
3) For compartments that do not have a hydrogen source but are not open, such as the pressurizer compartment, PAR can also be placed. Ventilation systems can be added to place where hydrogen may accumulate.
In order to study the performance of passive autocatalytic recombiners (PAR) under design basis accidents, the CPR1000 containment model was built by GASFLOW in this paper. Results show that during the LBLOCA accident, there were hydrogen “accumulation” in containment, but the hydrogen concentration did not exceed the safety threshold throughout the accident because of the function of PAR. Increasing the surface roughness of the thermal components by covering smooth surface with rough coating can effectively reduce the hydrogen risk inside the containment.
The study of PAR spatial arrangement showed that without changing the parameters of PAR itself, the flow rate of the hydrogen source and the spatial location of PAR can affect the hydrogen elimination efficiency and thus change the hydrogen concentration field in the containment. In general, the best hydrogen elimination results are obtained by placing the PAR in the open area close to the hydrogen source.
The raw data supporting the conclusion of this article will be made available by the authors, without undue reservation.
WT: data curation, formal analysis, investigation, methodology, software, validation, visualization, writing—original draft XF: data curation, formal analysis, investigation, methodology, software, validation, visualization DS: data curation, formal analysis, investigation, methodology, software, validation, visualization WL: conceptualization, formal analysis, funding acquisition, investigation, methodology, resources, supervision, validation, writing—review and editing LW: resources WY: data curation.
WT, XF, DS, and WY were employed by Suzhou Nuclear Power Research Institute Co. Ltd., China.
The remaining authors declare that the research was conducted in the absence of any commercial or financial relationships that could be construed as a potential conflict of interest.
All claims expressed in this article are solely those of the authors and do not necessarily represent those of their affiliated organizations, or those of the publisher, the editors and the reviewers. Any product that may be evaluated in this article, or claim that may be made by its manufacturer, is not guaranteed or endorsed by the publisher.
Agrawal, N., Ali, S., and Balasubramaniyan, V. (20152015). “A study on the effect of heat transfer boundary condition within the catalytic recombiner and its implication on nuclear safety [C],” in Proceedings of the 23rd national heat and mass transfer conference and 1st international ISHMT-ASTFE heat and mass transfer conference (Thiruvananthapuram. India Paper No.HMTC2015-23.
Agrawal, N., Ali, S. M., and Balasubramaniyan, V. (2017). Innovative hydrogen recombiner concept for severe accident management in nuclear power plants. Nucl. Eng. Des. 323, 359–366. doi:10.1016/j.nucengdes.2017.03.012
Blanchat, T. K., and Malliakos, A. (1997). “Performance testing of passive autocatalytic recombiners,” in Proceedings of the international cooperative exchange meeting on hydrogen in reactor safety. Paper 4.2.
Breitung, W., and Royl, P. (2000). Procedure and tools for deterministic analysis and control of hydrogen behavior in severe accidents. Nucl. Eng. Des. 202, 249–268. doi:10.1016/s0029-5493(00)00380-0
Ershov, B. G., and Gordeev, A. V. (2008). A model for radiolysis of water and aqueous solutions of H2, H2O2 and O2. Radiat. Phys. Chem. 77, 928–935. doi:10.1016/j.radphyschem.2007.12.005
Fischer, K., Broeckerhoff, P., Ahlers, G., Gustavsson, V., Herranz, L., Polo, J., et al. (2003). Hydrogen removal from LWR containments by catalytic-coated thermal insulation elements (THINCAT). Nucl. Eng. Des. 221, 137–149. doi:10.1016/s0029-5493(02)00348-5
Flores y Flores, A., and Mazzini, G. (2020). Analyses of Thai 1 hydrogen deflagration using MELCOR code version 2.1 and 2.2. Nucl. Eng. Des. 369, 110838. doi:10.1016/j.nucengdes.2020.110838
Gamezo, V. N., Ogawa, T., and Oran, E. S. (2007). Numerical simulations of flame propagation and DDT in obstructed channels filled with hydrogen–air mixture. Proc. Combust. Inst. 31, 2463–2471. doi:10.1016/j.proci.2006.07.220
Halouane, Y., and Dehbi, A. (2018). CFD simulation of hydrogen mitigation by a passive autocatalytic recombiner. Nucl. Eng. Des. 330, 488–496. doi:10.1016/j.nucengdes.2018.01.018
Heidari, A., and Wen, J. X. (2014). Flame acceleration and transition from deflagration to detonation in hydrogen explosions. Int. J. Hydrogen Energy 39, 6184–6200. doi:10.1016/j.ijhydene.2014.01.168
Heitsch, M., Huhtanen, R., Téchy, Z., Fry, C., Kostka, P., Niemi, J., et al. (2010). CFD evaluation of hydrogen risk mitigation measures in a VVER-440/213 containment. Nucl. Eng. Des. 240, 385–396. doi:10.1016/j.nucengdes.2008.07.022
IAEA TecDoc 1661 (2011). mitigation of hydrogen hazards in severe accidents in nuclear power plants, VIENNA.
Kim, J., Hong, S.-W., Kim, S.-B., and Kim, H.-D. (2007). Three-dimensional behaviors of the hydrogen and steam in the APR1400 containment during a hypothetical loss of feed water accident. Ann. Nucl. Energy 34, 992–1001. doi:10.1016/j.anucene.2007.05.003
Lam, J. C. K., Cheung, L. Y. L., Han, Y., and Wang, S. (2022). China's response to nuclear safety pre- and post-Fukushima: An interdisciplinary analysis. Renew. Sustain. Energy Rev. 157, 112002. doi:10.1016/j.rser.2021.112002
Meng, X., Lyu, X., Wang, B., Liu, S., Yu, Y., Guo, Z., et al. (2020). The measure on mitigating hydrogen risk during LOCA accident in nuclear power plant. Ann. Nucl. Energy 136, 107032. doi:10.1016/j.anucene.2019.107032
Paranjape, S., Mignot, G., Kapulla, R., and Paladino, D. (2019). Experimental investigation of gas transport induced by containment spray activation during a scaled severe accident scenario. Nucl. Eng. Des. 342, 88–98. doi:10.1016/j.nucengdes.2018.11.017
Park, J.-W., Koh, B.-R., and Suh, K. Y. (2011). Demonstrative testing of honeycomb passive autocatalytic recombiner for nuclear power plant. Nucl. Eng. Des. 241, 4280–4288. doi:10.1016/j.nucengdes.2011.07.040
Park, K., and Khor, C. L. (2016). CFD analysis of PAR performance as function of inlet design. Nucl. Eng. Des. 296, 38–50. doi:10.1016/j.nucengdes.2015.10.023
Payot, F., Reinecke, E.-A., Morfin, F., Sabroux, J.-C., Meynet, N., Bentaib, A., et al. (2012). Understanding of the operation behaviour of a Passive Autocatalytic Recombiner (PAR) for hydrogen mitigation in realistic containment conditions during a severe Light Water nuclear Reactor (LWR) accident. Nucl. Eng. Des. 248, 178–196. doi:10.1016/j.nucengdes.2012.03.042
Raman, R. K., Iyer, K. N., and Ravva, S. R. (2020). CFD studies of hydrogen mitigation by recombiner using correlations of reaction rates obtained from detailed mechanism. Nucl. Eng. Des. 360, 110528. doi:10.1016/j.nucengdes.2020.110528
Reinecke, E.-A., Tragsdorf, I. M., and Gierling, K. (2004). Studies on innovative hydrogen recombiners as safety devices in the containments of light water reactors. Nucl. Eng. Des. 230, 49–59. doi:10.1016/j.nucengdes.2003.10.009
Sandeep, K. C., Bhattacharyya, R., Warghat, C., Bhanja, K., and Mohan, S. (2014). Experimental investigation on the kinetics of catalytic recombination of hydrogen with oxygen in air. Int. J. Hydrogen Energy 39, 17906–17912. doi:10.1016/j.ijhydene.2014.08.148
Shukla, V., Ganju, S., Varma, S., Sengupta, S., and Maheshwari, N. K. (2019). Affect of recombiner location on its performance in closed containment under dry and steam conditions. Int. J. Hydrogen Energy 44, 25957–25973. doi:10.1016/j.ijhydene.2019.08.015
Shukla, V., Tyagi, D., Gera, B., Varma, S., Ganju, S., Maheshwari, N. K., et al. (2021). Development and validation of CFD model for catalytic recombiner against experimental results. Chem. Eng. J. 407, 127216. doi:10.1016/j.cej.2020.127216
Tuo, Y.-X., Shi, L.-J., Cheng, H.-Y., Zhu, Y.-A., Yang, M.-L., Xu, J., et al. (2018). Insight into the support effect on the particle size effect of Pt/C catalysts in dehydrogenation. J. Catal. 360, 175–186. doi:10.1016/j.jcat.2018.02.001
Xiao, J., Breitung, W., Kuznetsov, M., Zhang, H., Travis, J. R., Redlinger, R., et al. (2017). GASFLOW-MPI: A new 3-D parallel all-speed CFD code for turbulent dispersion and combustion simulations. Int. J. Hydrogen Energy 42, 8346–8368. doi:10.1016/j.ijhydene.2017.01.215
Xiao, J., Zhou, Z., and Jing, X. (2007). Primary studies on factors for hydrogen concentration distribution in containment under severe accidents. Nucl. Power Eng. 01, 99–104.
Yáñez, J., Kotchourko, A., and Lelyakin, A. (2012). Hydrogen deflagration simulations under typical containment conditions for nuclear safety. Nucl. Eng. Des. 250, 678–686. doi:10.1016/j.nucengdes.2012.06.006
Yu, W., Yu, X., Tu, S.-T., and Tian, P. (2017). Superhydrophobic Pt–Pd/Al2O3 catalyst coating for hydrogen mitigation system of nuclear power plant. Int. J. Hydrogen Energy 42, 14829–14840. doi:10.1016/j.ijhydene.2017.04.102
Keywords: design basis accident, large break loss coolant accident, containment modeling, hydrogen risk, 3D CFD simulation
Citation: Tianfan W, Feng X, Shuo D, Li W, Wanai L and Yifan W (2022) In-containment hydrogen behavior simulation and hydrogen concentration control under LBLOCA accidents. Front. Energy Res. 10:967855. doi: 10.3389/fenrg.2022.967855
Received: 13 June 2022; Accepted: 28 June 2022;
Published: 19 August 2022.
Edited by:
Xinyu Wei, Xi’an Jiaotong University, ChinaReviewed by:
Yuan Yuan, Sichuan University, ChinaCopyright © 2022 Tianfan, Feng, Shuo, Li, Wanai and Yifan. This is an open-access article distributed under the terms of the Creative Commons Attribution License (CC BY). The use, distribution or reproduction in other forums is permitted, provided the original author(s) and the copyright owner(s) are credited and that the original publication in this journal is cited, in accordance with accepted academic practice. No use, distribution or reproduction is permitted which does not comply with these terms.
*Correspondence: Wang Li, d2FuZ2xpNDVAbWFpbC5zeXN1LmVkdS5jbg==
Disclaimer: All claims expressed in this article are solely those of the authors and do not necessarily represent those of their affiliated organizations, or those of the publisher, the editors and the reviewers. Any product that may be evaluated in this article or claim that may be made by its manufacturer is not guaranteed or endorsed by the publisher.
Research integrity at Frontiers
Learn more about the work of our research integrity team to safeguard the quality of each article we publish.