 Zijun Mai
 Zichen Zhao
 Hui Cheng
 Songbai Cheng
 Jiyun Zhao3
95% of researchers rate our articles as excellent or good
Learn more about the work of our research integrity team to safeguard the quality of each article we publish.
Find out more
ORIGINAL RESEARCH article
Front. Energy Res. , 08 August 2022
Sec. Nuclear Energy
Volume 10 - 2022 | https://doi.org/10.3389/fenrg.2022.964841
This article is part of the Research Topic Experimental and Numerical Studies on Liquid Metal Cooled Fast Reactors View all 17 articles
The lead-cooled fast reactor (LFR) is one of the most promising fast neutron reactors using molten lead or the lead–bismuth eutectic (LBE) alloy as a coolant. Under postulated severe accidents, the fuel rod of LFR may be damaged, which would cause the release of fission gas, and the migration of fission gas bubbles in the reactor molten pool will affect the release and absorption of radioactive substances in the reactor. In this paper, a three-dimensional numerical study on the release and migration behavior of fission gas in the molten LBE pool of LFR is carried out based on the volume of fluid method. The bubbles are continuously released by gas injection, and the research mainly focuses on the detachment time, the rising velocity, and the size of the bubble when it detaches at the orifice. The coalescence of bubbles is observed, and the acceleration effect of the bubble wake is confirmed. The distribution of the bubble terminal rising velocity with diameter has no simple or linear relationship. The effects of the gas injection velocity, the release depth, and the gas injection angle are studied. A lower gas injection velocity will delay the detachment and reduce the size of the bubble. The increase of release depth tends to release smaller bubbles. The bubbles released from a vertical surface will attach to the wall. The simulations and theoretical analysis are comparable and have similar tendencies. The distribution of the bubble terminal rising velocity with equivalent diameter may predict the migration behavior of bubbles in molten LBE.
Fast neutron reactors can greatly improve the utilization rate of uranium resources and reduce nuclear contamination through transmutation as well as improve the safety during operation (Kelly, 2014; Pioro, 2016). As one of the members of fast neutron reactors using a liquid metal as a coolant (Pioro, 2016), the lead-cooled fast reactor (LFR) utilizes lead or lead-based alloys such as the lead–bismuth Eutectic alloy (LBE) as the primary coolant, which has favorable characteristics in terms of thermal properties, chemical inertness, and a harder neutron spectrum (Tuček et al., 2006; Fazio et al., 2015). However, LFRs have not reached the level of commercial operation and exist only for a few experimental use and military applications (Cinotti et al., 2009).
In a pool-type LFR, the fuel assemblies are deployed in the molten LBE pool, and the fuel pellet undergoes the fission reaction, producing neutrons, solid fission products, and gas fission products. In a postulated severe accident, the core fuel rods suffer damages, the fission gas contained will be released from the crack, and gas bubbles will be formed in the LBE pool, which will affect the natural circulation of the primary loop and then influence the safety of the operation. Fission gas is a component of the radioactive source item of the coolant of the primary circuit. When the fission gas bubbles are formed, their volumes and migration behavior will directly affect the distribution of radioactive substances in the molten pool, causing changes in the absorption and release among the core, the coolant of the primary circuit, and the gas environment, which will affect the safety analysis of LFR, such as the analysis of the radioactive source term. Hence, fully understanding of the release and migration behavior of fission gas in the molten LBE pool is crucial for the safety design of LFR.
As a common phenomenon in various scenarios, the migration behavior of bubbles in the liquid has been studied by numerous researchers with theoretical analyses, experiments, and simulations. Dating back to 1917, the Rayleigh equation (Rayleigh, 1917) can describe the instantaneous pressure of the external liquid and the radius with time of a large bubble. Based on this, viscosity and surface tension have been considered in the Rayleigh–Plesset equation (Plesset and Chapman, 1971). The viscous drag is an important factor affecting the migration of bubbles; many researches have carried out studies on the drag coefficient (Prosperetti, 1977; Bhaga and Weber, 1981; Kang and Leal, 1988a; Kang and Leal, 1988b; Tomiyama et al., 1998). A large number of experiments and theoretical analyses have shown that the rising velocity of bubbles in the liquid is related to the size of the bubbles, and many scholars have proposed methods to calculate the rising velocity of bubbles based on different assumptions. Davies and Taylor (Davies and Taylor, 1950) studied the rising velocity of large bubbles and proposed the formula for the calculation. Based on this, Joseph’s formula has considered viscosity and surface tension (Joseph, 2003). The analogy of the wave theory has been applied for the prediction of the terminal rising velocity of bubbles in surface tension- and inertia-dominated regions (Mendelson, 1967). In Wallis’s drift model, the formulas of the terminal rising velocity of bubbles in still liquids under flow conditions distinguished by the Re number and Ga number are given (Wallis, 1974). Grace’s graphical empirical correlation (Clift et al., 1987) interprets the shape of bubbles by three dimensionless numbers, namely, the Reynolds number (Re), the Morton number (Mo), and the Eötvös number (Eo), and it can be used to predict the terminal rising velocities of bubbles. Tomiyama et al. (2002) analyzed the relationship between the terminal rising velocity of the bubble and the aspect ratio that characterizes the deformation of the bubble through experiments and theoretical analysis and proposed a model of the relationship between the terminal rising velocity and the aspect ratio of the bubble.
Although theoretical and experimental studies have achieved certain results, most of them are based on spherical bubbles. For other complex flow conditions such as a high Reynolds number, large bubble deformation, and interaction between multiple bubbles, numerical simulation study shows its advantages. Zhang et al. (2012) used the volume of fluid (VOF) method to study the dynamic characteristics of the formation, growth, release, and rise of a single bubble in three dimensions, and the effects of fluid properties, fluid velocities, orifice number, and nozzle size on bubble behavior are investigated. Based on the finite element lattice Boltzmann method of mass conservation (FE-LBE), a two-dimensional (2D) numerical simulation study of bubbles rising in a viscous liquid at a high Reynolds number was carried out (Baroudi and Lee, 2021). The pressure fluctuation and velocity fluctuation are numerically studied during the bubble detachment (Cai et al., 2018). In an unsteady turbulence of the venturi bubble generator, the numerical simulation on the bubble dynamics is carried out (Song et al., 2021).
Most of the research studies on multiphase flow are based on water or other transparent viscous liquids, whereas it is hard to conduct experiments and visualize the bubbles in liquid metals such as molten LBE. The rising motion of single bubbles in the LBE pool is studied by neutron radiography (Hibiki et al., 2000), indicating that the migration behavior is similar to the typical characteristics of bubble migration in two-phase flow, and the results agree well with 1D and 2D simulations using the SIMMWE-III code. The bubble coalescence in the GaInSn eutectic alloy is investigated by X-ray photography (Keplinger et al., 2018). The rising velocity and the shape of small helium bubbles are indirectly measured by a layer of glycerol above the molten LBE pool (Konovalenko et al., 2017). The drag coefficient of single bubbles in molten LBE is obtained by analogy with several transparent liquids; then the prediction of the terminal rising velocity of single bubbles in molten LBE is carried out (Zhang et al., 2018). The diffusive interface method is applied for the 2D simulation of nitrogen single bubbles, and the results agree with Grace’s graphical correlation (Wang and Cai, 2018). Nevertheless, the experimental research on the bubble migration behavior in molten LBE is restricted due to the opacity, and 2D simulation studies cannot completely describe the movements and forces of bubbles in three dimensions. Thus, the research on the bubble migration behavior in molten lead and bismuth is still insufficient.
In order to study the release and migration behavior of fission gas bubbles in the molten LBE pool of LFR, 3D numerical simulation based on the VOF method was carried out. The effects of gas injection velocity, release depth, and gas injection angle on the bubble release and migration behavior in molten LBE were investigated. The bubble rising velocity, bubble equivalent diameter, and bubble detachment time, which are of great importance in bubble dynamics, were measured. The results were compared with theoretical analysis. This paper contributes to deepening the understanding of the mechanism of the release and migration behavior of fission gas bubbles in the molten LBE pool of LFR, and it provides a reference for system design optimization as well as safety analysis of LFR.
For incompressible fluids, the continuity equation and the momentum equation with surface tension are as follows:
where
The VOF method (Hirt and Nichols, 1981) is a free interface tracking method based on a fixed Euler grid, which has the advantages of a high efficiency and good precision. In this method, two or more immiscible fluids share a set of momentum equations, and the interface in the computational domain is tracked by the volume fraction C as follows:
For the
In the current case, gas and liquid phases satisfy
In the continuum surface force (CSF) model (Brackbill et al., 1992), with the divergence theorem, the surface tension at the interface can be expressed as an equivalent body force as follows:
where ρ is the density;
In this paper, the gas injection is divided into two modes: gas injection at the bottom orifice and gas injection at the wall orifice. As shown in Figure 1A, the simulation computational domain for the migration of bubbles continuously generated through ∇gas injection at the bottom orifice is a cuboid of 30 mm × 30 mm × 75 mm, and the orifice is located at the center of the bottom surface. In Figure 1B, when simulating the bubbles released by gas injection through the wall orifice, in order to further reduce the unnecessary computation, one of the dimensions of the bottom surface of the computational domain is shortened to 20 mm, and the height of the orifice is 10 mm. The orifices are 1 mm in diameter. The meshing of the entire computational domain is based on a structured mesh with a size of 0.5 mm. Since the shape of the orifice is circular, an O-grid is applied for the meshing. The processes of geometry and meshing were performed using ANSYS ICEM. The velocity inlet is set at the orifice. The top surface of the computational domain is set as the pressure outlet, and other surfaces are non-slip walls. The operation condition of the simulation is under an atmospheric pressure, that is,
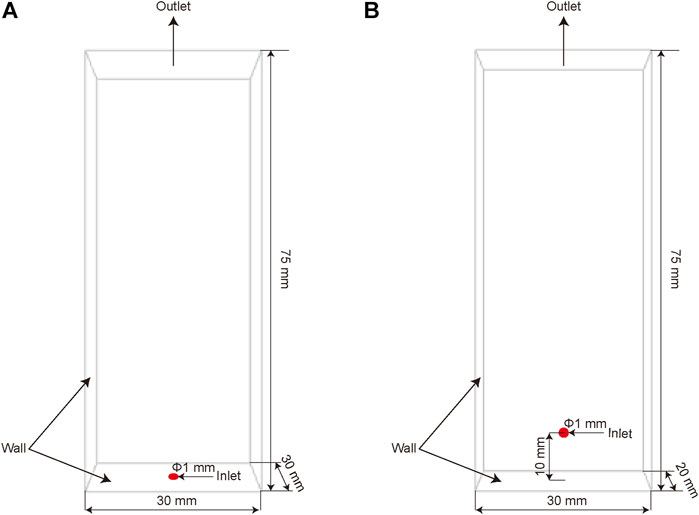
FIGURE 1. Schematic of the computational domain. (A) Bottom injection. (B) Wall injection.
In view of the huge difference in magnitude of physical properties such as density and viscosity between the gas and liquid, the volume of the bubble, which is affected by temperature, pressure, and physical properties, would be mainly concerned. Therefore, air is used as the general representative of the gas phase. At the same time, it is assumed that the effect of heat transfer between the bubble and the external fluid could be neglected. The physical properties of the studied fluids are given in Table 1.
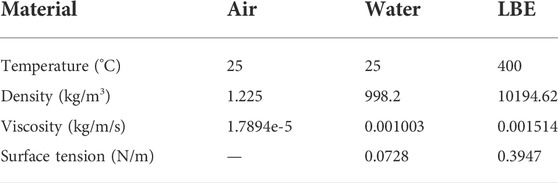
TABLE 1. Material properties.
The simulations are performed with ANSYS Fluent. The pressure-based and transient solver is selected. The gravity is
The post-processing is conducted with CFD-Post. The bubble edge is defined by the iso-surface where the air bubble volume fraction is 0.4, and the acquisition of the data is based this iso-surface. The bubble’s length, width, and height are measured; then the rising velocity and aspect ratio are calculated. The instantaneous rising velocity is defined as the average velocity calculated from the distance that the bubble rises in 0.005 s, while the terminal rising velocity is the average of the instantaneous rising velocity after the bubble has finished accelerating. The volume of the bubble is obtained by volume integration of the grids, and the equivalent diameter of the bubble is calculated from the bubble volume.
In order to study the effect of mesh size on the simulation results, the grid-independent test is conducted through the simulation of bubbles released by gas injection in water. Air passes through the orifice with a diameter of 1 mm at the gas velocity of 1 m/s, and bubbles emerge, grow and detach from the orifice, and rise in the computational domain of a cuboid of 30 mm × 30 mm × 75 mm with grid sizes of 0.25, 0.4, 0.5, and 1.0 mm, respectively. In the computational domain, the overall mesh is based on structured meshes. The total numbers of nodes are given in Table 2, and it should be noted that the 0.25 mm grid is only applied near the gas–liquid interface.

TABLE 2. Detachment time and diameter of the first bubble in water when
Figure 2 shows the meshes before the first bubble detaches under grids of different sizes. It can be observed that the bubbles all show the shape of a rounded upper part and a shrinking neck shape before they are released. The finer the mesh is, the smoother and rounder the bubble interface is described, and when the mesh is thicker, the surface of the bubble gradually appears angular, and the position of the bubble center is higher. The grid-independent analysis mainly focuses on the detachment time and size of the first bubble released from the orifice under different mesh sizes as well as the instantaneous rising velocity and aspect ratio of the bubble after the detachment.
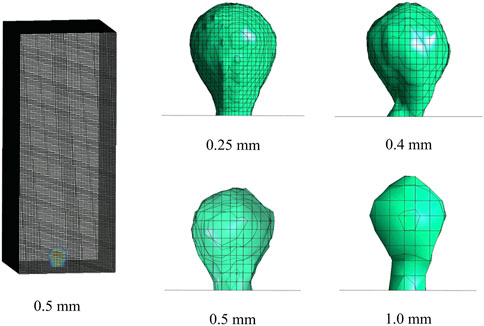
FIGURE 2. Mesh of the bubble before detachment with different grid sizes.
The detachment time of the first bubble emerging from the orifice and the corresponding equivalent diameter are shown in Table 2. The detachment time and equivalent diameter of the first bubble in grids under 0.5 mm are close, and the detachment is obviously delayed in the grid of 1.0 mm. The rising velocity in different grids is shown in Figure 3A; similar behaviors are found where the rising velocity increases rapidly after the bubble detaches and then fluctuates within a certain range. Figure 3B shows that the aspect ratio drops rapidly and then fluctuates around a stable value. The results of grids under 0.5 mm are close, while the result with the 1.0 mm grid is sometimes unstable and the values of aspect ratio are generally higher.
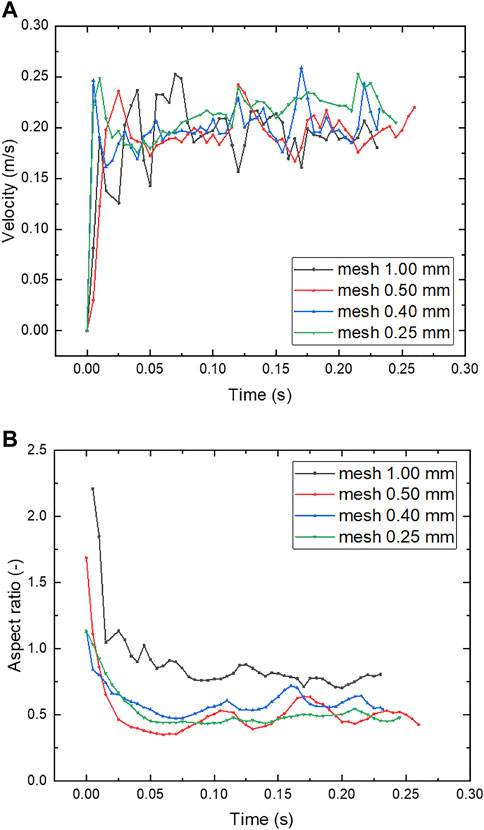
FIGURE 3. (A) Rising velocity and (B) aspect ratio of the bubble in water with different grid sizes,
The above simulations verify the independence of the grid and show that a grid size of 0.5 mm is sufficient to reasonably and accurately simulate and analyze the migration characteristics of bubbles in liquids. For a typical bubble with an equivalent diameter of 5 mm, the number of grids is about 500. Therefore, considering the rationality and accuracy of the calculation and taking into account the convergence and speed of the calculation, a grid with a size of 0.5 mm is used for the following 3D numerical simulations.
Model verification is an indispensable part of numerical study. In order to verify the rationality and applicability of the model, the 3D simulation of a bubble released in water is conducted. A bubble with an equivalent diameter of 4 mm, which is found typical for the study of bubble migration in liquids, is released and rises under the action of buoyancy. The simulation of the bubble rising in water is compared to the experiment conducted in the laboratory of Sun Yat-Sen University, and the process of bubble rising in water was captured using a high-speed camera.
Simulation snapshots and experimental results of a 4 mm bubble rising in quiescent water are compared in Figure 4. It is found that the simulation results of the height, the deformation, and the motion of the bubble agree well with the experiment. After the bubble is released, the bottom of the bubble rapidly becomes flat, and the shape of the bubble becomes ellipsoidal. The rising trajectory of the bubble is zigzag on the 2D view, while it is flat and upward spiral in 3D view. The wobble of the bubble has a similar direction in simulation and experiments, but the deviation is less important in simulation. Due to the purity of the fluid and the actual situation of the field, the difference between simulation and experiments is inevitable. It is hard to make sure that the liquid is absolutely quiescent in experiments, and the gas velocity and pressure will affect the result, which lead to the motion of the bubble in experiments being more violent. Generally, the result of simulation agrees well with experiments.
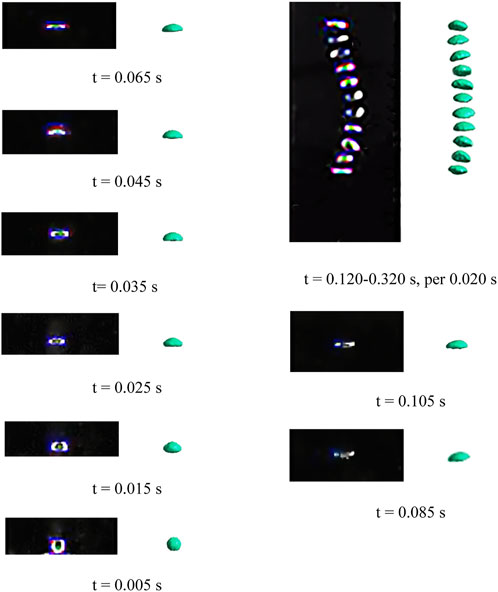
FIGURE 4. Comparison of experiments and 3D simulation of the bubble rising in water,
Figure 5 shows the rising velocities of a 4 mm bubble in water with height in simulation as well as in experiments. The rising velocities increase rapidly once the bubbles are released and then fluctuate within certain ranges. The results in simulation and in experiments are similar and comparable. Considering the complexity of the bubble migration behavior, the agreement between simulation and experimental results of the bubble in water is acceptable, which indicates that the methodology is reasonable and feasible to study the bubble migration behavior in the liquid, and the modifications in material properties from water to molten LBE would be possible. Hence, this model can be applied to the study on the bubble migration behavior in molten LBE.
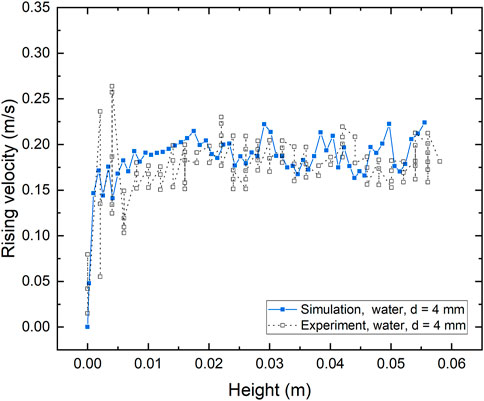
FIGURE 5. Comparison of 3D simulation and experiments of bubble rising velocity with height in water.
In a postulated severe accident in LFR, the damage of the fuel rods could cause the ejection of the high-pressure fission gas contained within and thereby generate bubbles. In order to better understand the release and migration behavior of fission gas bubbles in molten LBE pools under severe accidents, a 3D numerical study of bubble migration behavior under the condition that gas bubbles are continuously generated by gas injection is carried out in this part. At the same time, in order to study the potential influencing factors of bubble migration behavior in the postulated severe accident of LFR, the effects of different parameters including gas injection velocity, release depth, and gas injection angle were studied. The results of the bubble rising velocity, bubble detachment time, and bubble equivalent diameter were measured.
Figure 6 shows the snapshots of 3D simulation of bubbles continuously generated at a gas injection velocity
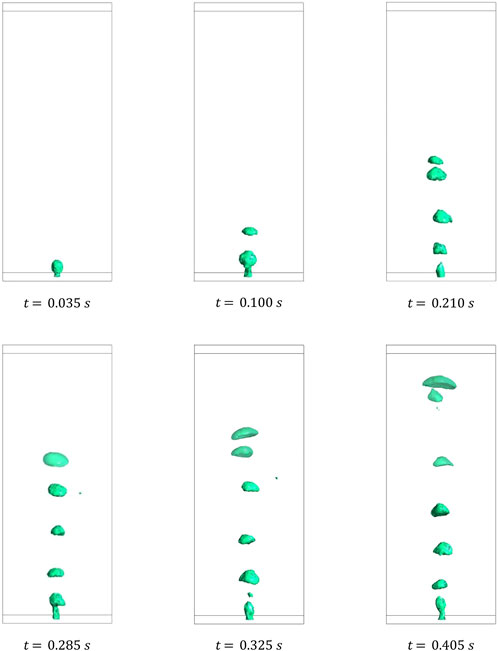
FIGURE 6. Snapshots of 3D simulation of bubbles released by gas injection in molten LBE,
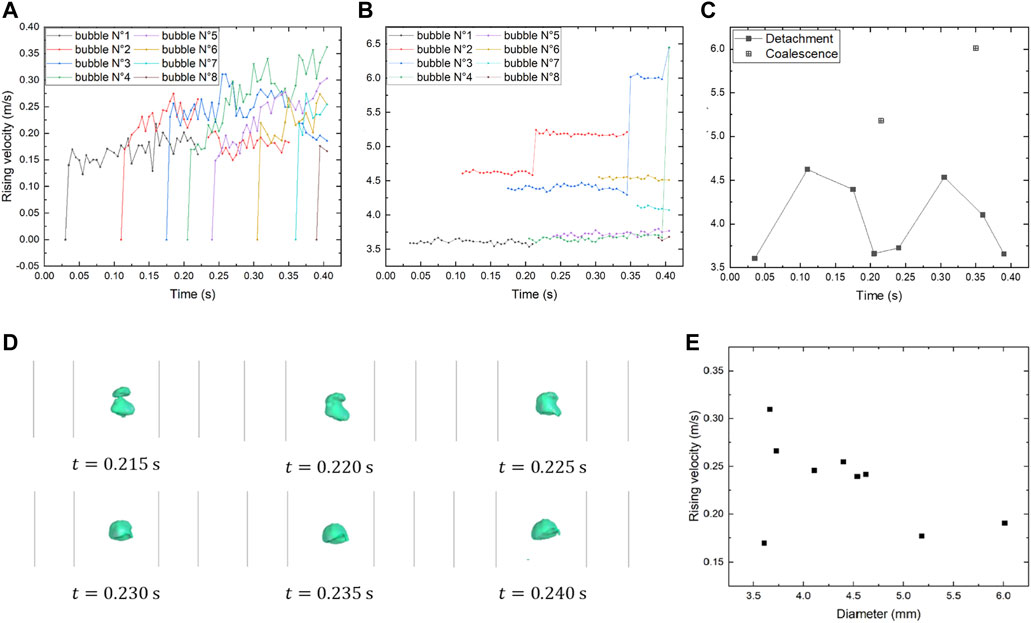
FIGURE 7. Simulation results of bubbles released by gas injection in molten LBE,
Under the current conditions, the coalescence of bubbles can be clearly observed. The coalescence of bubble No. 1 and No. 2, the coalescence of bubble of No. 2 and No. 3, and the coalescence of bubble of No. 3 and No. 4 occurred at 0.215, 0.350, and 0.405 s, respectively, forming a bigger bubble at each time. It is found in Figure 7B that the equivalent diameter of the bubbles remains basically stable during the rising process except during the coalescence process. Among them, the bubbles with a too short simulation duration were not analyzed. It can be seen in Figure 7C that at the gas injection velocity
Figure 7D shows the process of coalescence of bubble No. 1 and bubbles No. 2. The leading bubble usually has a lower rising velocity, and due to the effect of the wake of the leading bubble, the trailing bubble is accelerated and its top surface extends to reach the leading bubble’s lower surface and then eventually merges with the leading bubble. The coalescence of bubbles leads to the formation of a bigger bubble. This phenomenon is also found in the study of Hasan (Hasan and Zakaria, 2011). It can be seen in Figure 7A that the rising velocity of the bubble after coalescence is slightly higher than the leading bubble.
Figure 8 shows the streamlines of the velocity field during the release and rising of bubbles. It is observed that the streamlines around the first bubble have good symmetry and the field above is tranquil. While it is found that the bubble wake has a long distance and straight impact on the bubbles down below, most of the bubbles detaching afterward get in the wake of the upper bubbles. The bubbles in the wake not only are accelerated but also could be deviated horizontally. With the continuous release and rising of bubbles, the streamlines become more complex but maintain a relatively good symmetry, which keeps the bubbles being influenced by the bubble wake.
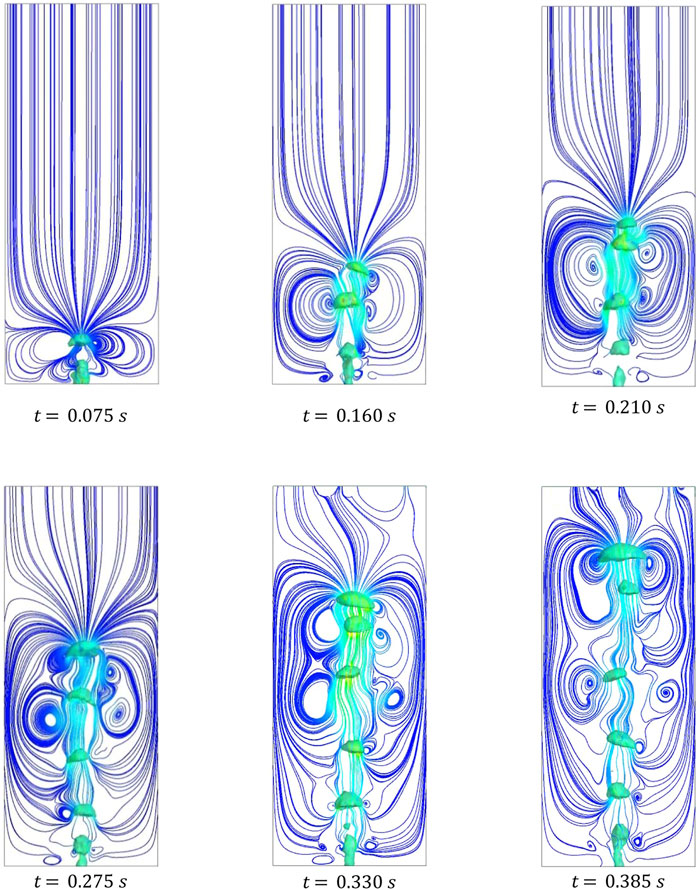
FIGURE 8. Streamlines of the velocity field of bubbles released by gas injection in molten LBE,
Therefore, it can be seen in Figure 7E that no simple or linear relationship exists for the terminal rising velocity of bubbles released by gas injection in molten LBE and it is divided into two cases. One of the cases is the bubbles not being influenced by the bubble wake, and the other is the bubbles influenced by the bubble wake. The first bubble detaching at the orifice and the bubbles after merging with it are not influenced by the wake, and their terminal rising velocities are lower than 0.20 m/s, as shown in Figure 7E, and only after the coalescence, the rising velocity increases slightly. While the bubbles get influenced by the wake of the upper bubble, the wake causes the decrease of the pressure, the increase of fluid velocity, and the formation of vortexes. These differences in the flow field accelerate the bubbles that are in the wake, making their terminal rising velocities greater than 0.20 m/s.
In order to study the effect of gas injection velocity on the bubble migration behavior, the simulations were conducted under the condition of gas injection though the orifice at the bottom surface of the computational domain, with the typical gas injection velocity
The detachment time and equivalent diameter of bubbles in molten LBE at each gas injection velocity are shown in Figure 9A, where the coalescence of bubbles occurs at
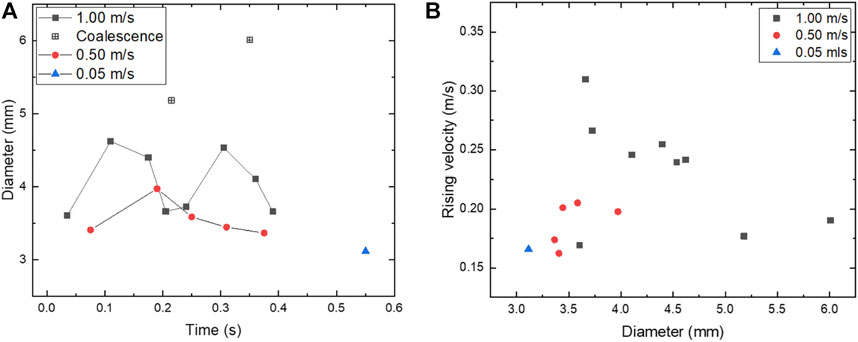
FIGURE 9. Effect of gas injection velocity on the release and migration behavior of bubbles in molten LBE. (A) Equivalent diameter. (B) Terminal rising velocity.
Figure 9B shows the distribution of bubble terminal rising velocity with equivalent diameter at the gas injection velocities of
In order to study the effect of release depth on the bubble migration behavior in molten LBE, a layer of molten LBE of 3 m is added above the computational domain. Due to the limitation of computing resources, it is not possible to directly lengthen the computational domain by 3 m. Instead, the change in the length of the computational domain is equivalent by increasing the back pressure at the pressure outlet. The back pressure of
Simulations were carried out with the increase of release depth
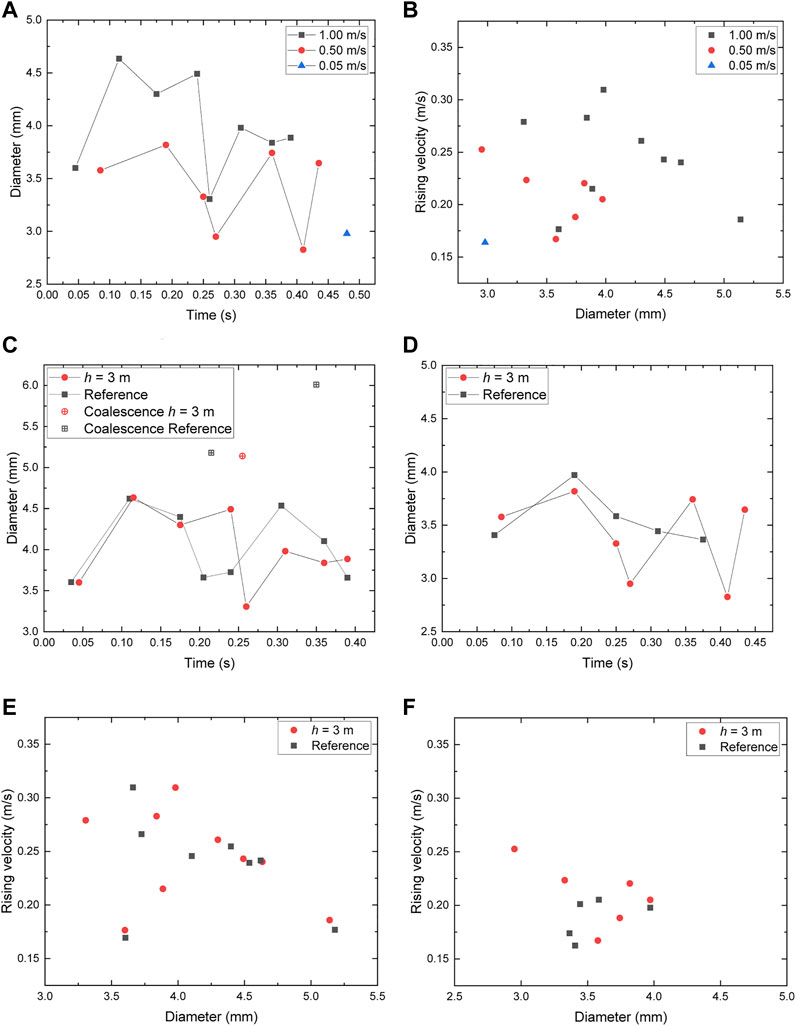
FIGURE 10. Influence of release depth on the release and migration behavior of bubbles in molten LBE. (A) Equivalent diameter. (B) Terminal rising velocity. (C) Equivalent diameter, vo = 1 m/s. (D) Equivalent diameter, vo = 0.5 m/s. (E) Terminal rising velocity, vo = 1 m/s. (F) Terminal rising velocity, vo = 0.5 m/s.
Figures 10C,D show the influence of release depth on the detachment time and equivalent diameter of bubbles at
Figure 10B shows the distribution of bubble terminal rising velocity with equivalent diameter when
Figures 10E,F show the effect of release depth on the distribution of bubble terminal rising velocity with equivalent diameter at
In the reactor, the fuel rods are in a vertical position. Under a postulated severe accident, the damage could happen on a vertical surface, in which the shear force applied on the bubble would be different. Hence, the gas injection angle is to be studied. The orifice with a diameter of 1 mm is located on the midline of a vertical wall, and the distance to the bottom surface is 10 mm. The gas injection velocities of 1 m/s, 0.5 m/s, and 0.05 m/s are applied.
Figure 11 shows the snapshots of simulation of the bubbles generated by gas injection at the wall orifice in molten LBE. It can be observed that the bubbles released at the wall orifice will rise and attach to the wall. The bubbles with a large gas volume tend to form half-cut bubbles, while the bubbles with a smaller gas volume tend to form gas films and the tiny bubbles on the wall surface. Compared to the previous cases where the orifice is on the bottom surface, more bubbles are generated at the orifice on the wall, and the bubbles that attach to the wall are more favorable to the coalescence of bubbles.
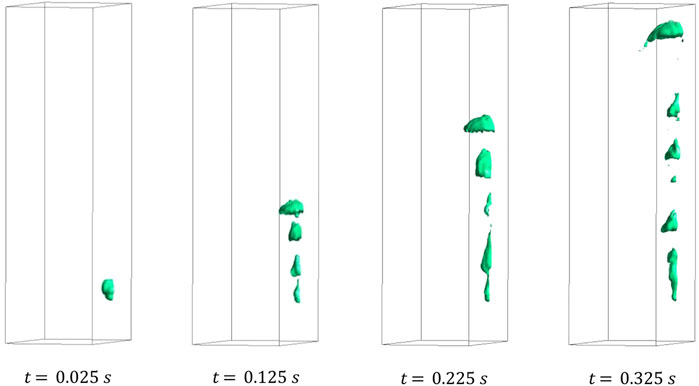
FIGURE 11. Snapshots of simulation of the bubbles generated by gas injection at the wall orifice in molten LBE,
Figure 12A shows the instantaneous rising velocities of bubbles numbered by the order of detachment when
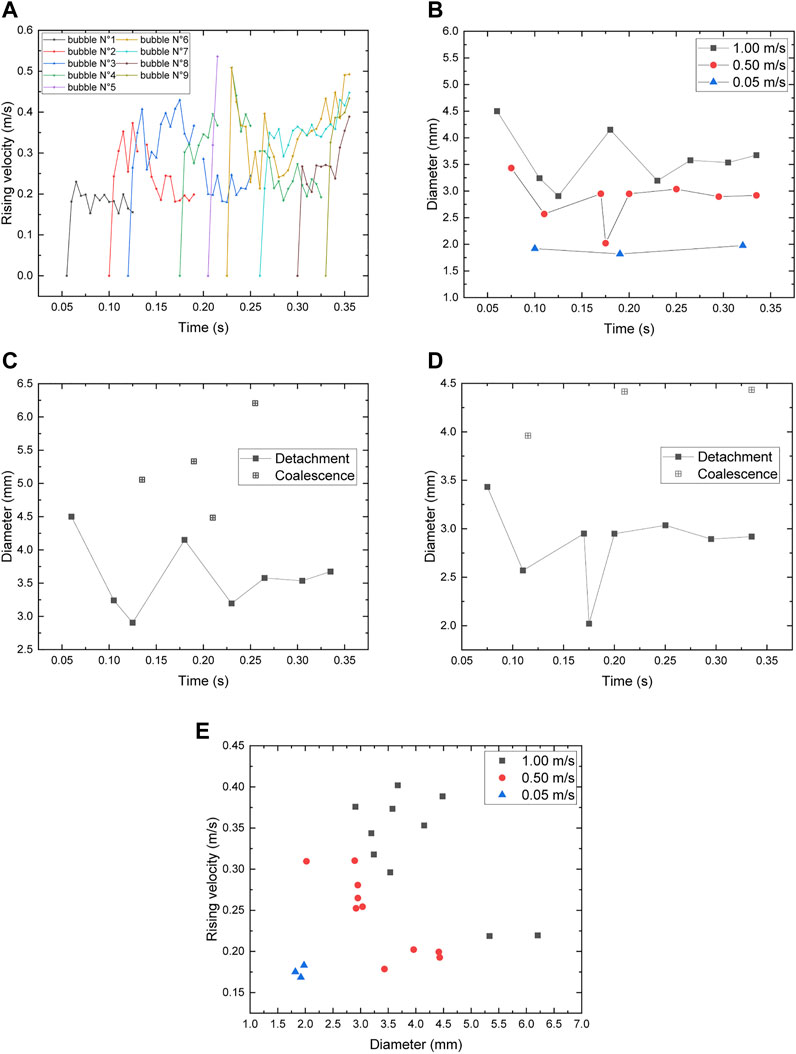
FIGURE 12. Release and migration behavior the bubbles generated by gas injection at the wall orifice in molten LBE. (A) Instantaneous rising velocity. (B) Equivalent diameter. (C) Equivalent diameter, vo = 1 m/s. (D) Equivalent diameter, vo = 0.5 m/s. (E) Terminal rising velocity.
The detachment time and equivalent diameter of bubbles generated by gas injection at the wall orifice in molten LBE at the gas injection velocities of 1 m/s and 0.5 m/s are shown in Figures 12C,D. The first bubble released at the orifice takes a longer waiting time than the rest of the bubbles, and therefore, more gas is accumulated to form a bigger bubble. Meanwhile, the flow field for the first bubble is tranquil, so its rising velocity is relatively low. The rest of the bubbles are smaller, and the time intervals between the bubble detachments are shorter; then these bubbles have short distances with each other. Therefore, theses bubbles are more easily accelerated under the effect of the wake of upper bubbles and the coalescence of bubbles is facilitated. It should be noted that some of the bubbles merge right after their detachment with tiny bubbles, which detach almost at the same time, or with the gas column underneath, such as bubble No. 5 when
Figure 12B shows the detachment time and equivalent diameter at different gas injection velocities at the wall orifice. Compared with the results of the bubbles released at the orifice on the bottom surface in Figure 9A, it is found that bubbles are more easily released at the wall orifice and the bubbles are smaller. When
Figure 12E shows the distribution of terminal rising velocity with equivalent diameter of the bubbles generated by gas injection at the wall orifice in molten LBE. The existence of two zones which depend on the influence of the bubble wake is observed referring to the previous cases. Most of the small bubbles tend to chase after bigger bubbles; then these small bubbles are accelerated and reach higher rising velocities. The bubbles with larger diameters usually formed after merging with other bubbles, and their terminal rising velocities maintain around 0.20 m/s. With the decrease in the gas injection velocity, the equivalent diameter of the bubble decreases, and the terminal rising velocity decreases, which is equivalent to moving the overall distribution to the bottom left. Finally, when the gas injection velocity is very low, the data point converges at the bottom left of the diagram. Compared with Figure 9B, the terminal rising velocity of the bubble released by the wall orifice is generally higher than that of the bubble released by the orifice on the bottom surface.
Numerical simulation provides a more economical and feasible path for more difficult and complex experimental research, especially for the molten LBE of opaque and complicated operations to carry out general experimental research. However, in order to discuss the rationality and accuracy of numerical simulation results, it is still useful to compare the results of numerical simulation with theoretical analysis.
Grace’s graphical empirical correlation (Clift et al., 1987) describes the shape and rising characteristics of the bubble by the dimensionless numbers, namely, the Reynolds number (Re), Morton number (Mo), and Eötvös number (Eo), as follows:
where the subscript
Grace did not provide the curves at an extreme density ratio. The ranges of the dimensionless numbers including
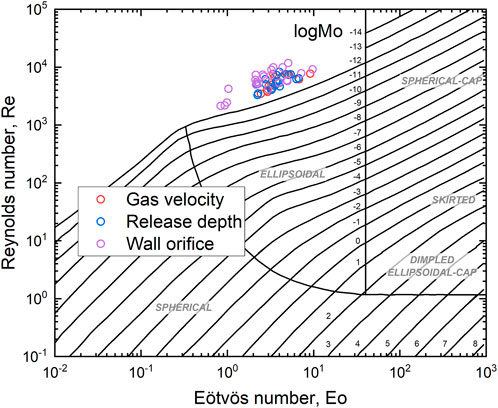
FIGURE 13. Simulation results on Grace’s graphical empirical correlation.
In this paper, a 3D numerical study on the release and migration behavior of the fission gas bubbles in the molten LBE pool of LFR is carried out based on the VOF method. The acceleration effect of the wake of the upper bubble is confirmed, and coalescence of bubbles could be facilitated. The distribution of the terminal rising velocity with equivalent diameter of the bubble has no simple and linear relationship, and it depends on the influence of bubble wake. Decreasing the gas injection velocity delays the detachment time, decreases the bubbling frequency, and releases smaller bubbles. The increase of release depth tends to decrease the lower limit of the range of the bubble equivalent diameters, and the variation of bubble size may be more intense. The bubbles released at the orifice on the wall would reach higher rising velocities under the guidance of the wall and the acceleration effect of the bubble wake. The results of simulation are still comparable to Grace’s graphical empirical correlation at the area of a higher Reynolds number, and the distribution of the terminal rising velocity with equivalent diameter may predict the migration characteristics of the bubbles in molten LBE. This paper contributes to deepening the understanding of the mechanism of the release and migration behavior of fission gas bubbles in the molten LBE pool of LFR and provides references for the system design optimization and safety analysis of LFR.
The raw data supporting the conclusion of this article will be made available by the authors, without undue reservation.
ZM performed the investigation, analysis, and the writing of the first draft of the manuscript. HC wrote and edited sections of the manuscript. All authors contributed to manuscript revision, read, and approved the submitted version.
The research is funded by the Science and Technology Program of Guangdong Province (No. 2021A0505030026), the China Postdoctoral Science Foundation (No. 2019M663128), and the Basic and Applied Basic Research Foundation of Guangdong province (No. 2021A1515010343, No. 2022A1515011582).
ZZ was employed by China Nuclear Power Technology Research Institute Co., Ltd.
The remaining authors declare that the research was conducted in the absence of any commercial or financial relationships that could be construed as a potential conflict of interest.
All claims expressed in this article are solely those of the authors and do not necessarily represent those of their affiliated organizations or those of the publisher, the editors, and the reviewers. Any product that may be evaluated in this article or claim that may be made by its manufacturer is not guaranteed or endorsed by the publisher.
Baroudi, L., and Lee, T. (2021). Simulation of a bubble rising at high Reynolds number with mass-conserving finite element lattice Boltzmann method. Comput. Fluids 220, 104883. doi:10.1016/j.compfluid.2021.104883
Bhaga, D., and Weber, M. E. (1981). Bubbles in viscous liquids: Shapes, wakes and velocities. J. Fluid Mech. 105, 61–85. doi:10.1017/s002211208100311x
Brackbill, J. U., Kothe, D. B., and Zemach, C. (1992). A continuum method for modeling surface tension. J. Comput. Phys. 100, 335–354. doi:10.1016/0021-9991(92)90240-y
Cai, K., Song, Y., Li, J., Wang, D., Yin, J., Liu, W., et al. (2018). Pressure and velocity fluctuation in the numerical simulation of bubble detachment in a venturi-type bubble generator. Nucl. Technol. 205, 94–103. doi:10.1080/00295450.2018.1479575
Cinotti, L., Smith, C. F., and Sekimoto, H. (2009). Lead-cooled fast reactor (LFR) overview and perspectives. Livermore, CA, United States: Lawrence Livermore National Lab. LLNL.
Clift, R., Grace, J. R., and Weber, M. E. (1987). Bubbles, drops, and particles. New York: Academic Press.
Davies, R. M., and Taylor, G. I. (1950). The mechanics of large bubbles rising through liquids in tubes. Proc. R. Soc. Lond. A 200, 375–390.
Fazio, C., Sobolev, V. P., Aerts, A., Gavrilov, S., Lambrinou, K., Schuurmans, P., et al. (2015). Handbook on lead-bismuth eutectic alloy and lead properties, materials compatibility, thermal-hydraulics and technologies-2015 edition. Issy-les-Moulineaux, France: Organisation for Economic Co-Operation and Development.
Hasan, N., and Zakaria, Z. B. (2011). Computational approach for a pair of bubble coalescence process. Int. J. Heat Fluid Flow 32, 755–761. doi:10.1016/j.ijheatfluidflow.2011.02.004
Hibiki, T., Saito, Y., Mishima, K., Tobita, Y., Konishi, K., Matsubayashi, M., et al. (2000). Study on flow characteristics in gas-molten metal mixture pool. Nucl. Eng. Des. 196, 233–245. doi:10.1016/s0029-5493(99)00293-9
Hirt, C. W., and Nichols, B. D. (1981). Volume of fluid (VOF) method for the dynamics of free boundaries. J. Comput. Phys. 39, 201–225. doi:10.1016/0021-9991(81)90145-5
Joseph, D. D. (2003). Rise velocity of a spherical cap bubble. J. Fluid Mech. 488, 213–223. doi:10.1017/s0022112003004968
Kang, I. S., and Leal, L. G. (1988b). Small-amplitude perturbations of shape for a nearly spherical bubble in an inviscid straining flow (steady shapes and oscillatory motion). J. Fluid Mech. 187, 231–266. doi:10.1017/s0022112088000412
Kang, I. S., and Leal, L. G. (1988a). The drag coefficient for a spherical bubble in a uniform streaming flow. Phys. Fluids (1994). 31, 233–237. doi:10.1063/1.866852
Kelly, J. E. (2014). Generation IV international forum: A decade of progress through international cooperation. Prog. Nucl. Energy 77, 240–246. doi:10.1016/j.pnucene.2014.02.010
Keplinger, O., Shevchenko, N., and Eckert, S. (2018). Visualization of bubble coalescence in bubble chains rising in a liquid metal. Int. J. Multiph. Flow 105, 159–169. doi:10.1016/j.ijmultiphaseflow.2018.04.001
Konovalenko, A., Sköld, P., Kudinov, P., Bechta, S., and Grishchenko, D. (2017). Controllable generation of a submillimeter single bubble in molten metal using a low-pressure macrosized cavity. Metall. Materi. Trans. B 48, 1064–1072. doi:10.1007/s11663-017-0914-z
Mendelson, H. D. (1967). The prediction of bubble terminal velocities from wave theory. AIChE J. 13, 250–253. doi:10.1002/aic.690130213
Pioro, I. (2016). Handbook of generation IV nuclear reactors. Duxford, United Kingdom: Woodhead Publishing.
Plesset, M. S., and Chapman, R. B. (1971). Collapse of an initially spherical vapour cavity in the neighbourhood of a solid boundary. J. Fluid Mech. 47, 283–290. doi:10.1017/s0022112071001058
Prosperetti, A. (1977). Viscous effects on perturbed spherical flows. Q. Appl. Math. 34, 339–352. doi:10.1090/qam/99652
Rayleigh, L. (1917). VIII. On the pressure developed in a liquid during the collapse of a spherical cavity. Lond. Edinb. Dublin Philos. Mag. J. Sci. 34, 94–98. doi:10.1080/14786440808635681
Song, Y., Xu, R., Cai, K., Yin, J., and Wang, D. (2021). Numerical studies on bubble dynamics in an unsteady turbulence of the venturi bubble generator applied to TMSR. Ann. Nucl. Energy 160, 108322. doi:10.1016/j.anucene.2021.108322
Tomiyama, A., Celata, G., Hosokawa, S., and Yoshida, S. (2002). Terminal velocity of single bubbles in surface tension force dominant regime. Int. J. Multiph. flow 28, 1497–1519. doi:10.1016/s0301-9322(02)00032-0
Tomiyama, A., Kataoka, I., Zun, I., and Sakaguchi, T. (1998). Drag coefficients of single bubbles under normal and micro gravity conditions. JSME Int. J. Ser. B Fluids. Therm. Eng. 41, 472–479. doi:10.1299/jsmeb.41.472
Tuček, K., Carlsson, J., and Wider, H. (2006). Comparison of sodium and lead-cooled fast reactors regarding reactor physics aspects, severe safety and economical issues. Nucl. Eng. Des. 236, 1589–1598. doi:10.1016/j.nucengdes.2006.04.019
Wallis, G. B. (1974). The terminal speed of single drops or bubbles in an infinite medium. Int. J. Multiph. Flow 1, 491–511. doi:10.1016/0301-9322(74)90003-2
Wang, C., and Cai, J. (2018). Numerical simulation of bubble rising behavior in liquid LBE using diffuse interface method. Nucl. Eng. Des. 340, 219–228. doi:10.1016/j.nucengdes.2018.09.041
Zhang, C., Zhou, D., Sa, R., and Wu, Q. (2018). Investigation of single bubble rising velocity in LBE by transparent liquids similarity experiments. Prog. Nucl. Energy 108, 204–213. doi:10.1016/j.pnucene.2018.05.011
Keywords: lead-cooled fast reactor, lead–bismuth eutectic alloy, bubble migration, VOF method, nuclear safety
Citation: Mai Z, Zhao Z, Cheng H, Cheng S and Zhao J (2022) Numerical study on the release and migration behavior of fission gas in a molten LBE pool. Front. Energy Res. 10:964841. doi: 10.3389/fenrg.2022.964841
Received: 09 June 2022; Accepted: 12 July 2022;
Published: 08 August 2022.
Edited by:
Liangming Pan, Chongqing University, ChinaReviewed by:
Longxiang Zhu, Chongqing University, ChinaCopyright © 2022 Mai, Zhao, Cheng, Cheng and Zhao. This is an open-access article distributed under the terms of the Creative Commons Attribution License (CC BY). The use, distribution or reproduction in other forums is permitted, provided the original author(s) and the copyright owner(s) are credited and that the original publication in this journal is cited, in accordance with accepted academic practice. No use, distribution or reproduction is permitted which does not comply with these terms.
*Correspondence: Hui Cheng, Y2hlbmdoNzhAbWFpbC5zeXN1LmVkdS5jbg==; Songbai Cheng, Y2hlbmdzYjNAbWFpbC5zeXN1LmVkdS5jbg==
Disclaimer: All claims expressed in this article are solely those of the authors and do not necessarily represent those of their affiliated organizations, or those of the publisher, the editors and the reviewers. Any product that may be evaluated in this article or claim that may be made by its manufacturer is not guaranteed or endorsed by the publisher.
Research integrity at Frontiers
Learn more about the work of our research integrity team to safeguard the quality of each article we publish.