 Shiming Jiang
 Yibo Tang
- Provincial Key Laboratory of Informational Service for Rural Area of Southwestern Hunan, Shaoyang University, Shaoyang, China
In order to reduce power energy consumption and ensure the sustainable development of resources, a research on the generation scheduling mechanism of interconnected power systems based on runoff forecasting is proposed. First, by studying energy-saving power generation scheduling and using the average distribution method, there will be a lot of energy consumption and pollution emissions, so it is necessary to formulate a reasonable power generation scheduling plan; secondly, the medium and long-term runoff forecasting method is analyzed, and artificial neural networks are used to select appropriate hidden nodes Finally, the economic characteristics of the two-stage power generation of the hydropower station are explored, and the marginal benefit of the water level storage capacity and the total power generation is obtained by combining the current operating status and forecast information of the reservoir. Through experiments, it is proved that the method in this paper can better predict the power generation scheduling mechanism of hydropower stations, and the annual power generation of the optimized scheduling is 1.92% higher than that of conventional scheduling, which has significant advantages, ensuring the reasonable distribution of power resources and preventing unnecessary waste.
1 Introduction
The current power production scheduling method in the country is to share the power generation of each unit equally, and such a scheduling method will generate a lot of energy consumption and pollution (Le et al., 2021). Under the needs of energy conservation and environmental protection, the country has proposed the implementation of energy conservation and emission reduction plans, in order to achieve the purpose of energy conservation and emission reduction, promote the optimization of the energy structure (Zhang et al., 2022), and guide the energy structure to develop in the direction of high efficiency and low pollution (Li et al., 2021a). In today’s energy shortage and increasingly prominent environmental pollution, developing clean energy, developing green power, and promoting the transformation of energy strategies have become a new trend in global energy development (Li et al., 2021b), and it is also an important direction of energy strategy development. China has developed rapidly in the past 5 years, and will maintain rapid development in the next 10 years. While the country is developing clean energy on a large scale, how to conduct electricity market transactions in the new environment to ensure its efficient use and achieve optimal resource allocation is a practical problem that urgently needs to be studied and solved (Husin and Zaki, 2021), (Yang et al., 2021a).
In order to realize resource complementarity and improve power system operation security (Shang, 2007), it is necessary to interconnect small and medium power grids through tie lines to form a multi-domain interconnected power system. At present, all regions and provinces in China have gradually realized networking, and the networking form has changed from simple bilateral networking to complex networking. After the power systems are interconnected, each system can obtain power from other systems through tie lines, realize mutual support between interconnected subsystems, and obtain benefits such as mutual assistance, peak shifting and mutual backup, thereby improving the reliability level of the entire region. Reference (Fan et al., 2009) proposes an energy-saving power generation dispatching method that takes into account the government’s macro-control and market mechanism, and implements optimal dispatching of various generator sets according to the energy consumption and pollutant emission levels to achieve the power generation dispatching target requirements. Reference (Zhang et al., 2009) proposes a regional power grid energy-saving power generation dispatching model that takes into account the bidding in the electricity market. First, it is sorted by province, and then the grid replacement algorithm is matched in the province, and finally the dispatching situation under various modes is calculated. Reference (Li and Tan, 2012) uses short-term marginal cost pricing as the premise to design a power generation scheduling model. According to the two-part on-grid electricity price mechanism, the transaction plan is clarified by ordering the electricity price of units approved by the government to form a suitable power generation scheduling mechanism. Reference (Yang et al., 2022a) uses the benefit compensation mechanism of the distribution model to formulate a dispatch model, and is compatible with coal consumption ranking and market bidding to implement the power generation dispatch mechanism of the transfer of power generation rights (Fan et al., 2009; Zhang et al., 2009; Li and Tan, 2012; Yang et al., 2022a).
The power generation scheduling situation is not perfect, there is a large planning deviation, lead to serious energy consumption, therefore, this paper puts forward the interconnected power system based on runoff forecast scheduling mechanism research, through the artificial neural network simulation runoff forecast method, analysis of energy-saving power generation scheduling, research of hydropower station optimization scheduling, make a reasonable plan. A power generation model of hydropower station is designed, combined with Markov correction of scheduling error, to improve the mechanism. Through this model, the annual power generation of optimized scheduling is 1.92% higher than that of conventional scheduling, and the optimization effect is obvious. The scheduling scheme formulated by the optimized BP neural network for prediction and runoff is closer to the actual scheduling operation process.
2 Energy-saving power generation scheduling analysis
The current power generation planning mode in the country is to distribute the power generation time of the units equally. For small thermal power units with high energy consumption and high pollution, the power generation time of the high-efficiency, environmental protection, and energy-saving units, no measures have been taken to encourage clean units to generate electricity. Due to the existence of a large number of clean and low-energy equipment in the country’s power system, the use of an even distribution method has resulted in a large amount of energy consumption and pollution emissions. With the rapid development of the national economy, the electricity consumption of the whole society has increased rapidly, and the energy consumption, pollutants, and carbon dioxide emissions have also increased rapidly. The traditional power generation planning model can no longer meet the new needs.
However, the implementation of energy-saving power generation scheduling is a wide-ranging (Yang et al., 2022b) and complex system engineering, and it is also a major reform of the country’s current power generation scheduling system. This reform will have a major impact on the security, continuous and reliable power supply of China’s power grid, and will also cause major adjustments to the interests of power companies (power generation companies and power grid companies) and local interests (local government tax revenue). At the same time, in the actual scheduling process, a large number of technical support systems developed according to the original ideas need to be upgraded, and the operation process needs to be changed.
The power industry is also a producer and user of energy. China’s power industry accounts for more than 80% of coal production and more than 50% of China’s coal consumption. China’s power industry is a real energy-consuming country. On the one hand, energy consumption and emissions can be reduced in the short term through the power-saving dispatch of power plants. On the other hand, in the process of investing in power generation, the introduction of energy-saving and emission-reduction technologies to maximize the elimination of backward production capacity (Wei et al., 2016) has a profound impact on the development of enterprises. The implementation of the energy-saving power generation plan will greatly change the profit distribution of the country’s power generation industry, and will also have a certain impact on power grid companies and users. Research on optimal dispatching of energy-saving power plants is helpful to formulate a reasonable power generation plan. At the same time, in the energy production plan, more technical support is needed, such as optimizing the dispatching scheme.
The economic essence of the current energy-saving power generation dispatching policy is to realize the “macro-control” of power generation (production) between units with different energy types and units with the same energy type and different energy consumption levels through the promulgation of administrative decrees.
1) The purpose of regulation is to overcome the limitation of simply using the market for resource allocation (Liu, 2021), which does not consider the externalities of electricity commodities that damage the environment and consume resources. Regulation is a supplement to market instruments.
2) The power generation of each unit before regulation is gradually determined according to the development and competition of power grids and power generation enterprises over the years. It can be regarded as similar to “market allocation” in economics, that is, each economic entity makes production and trade decisions according to its own economic interests, and the determined production capacity is also the result of market resource allocation. Under the premise that the market is fully competitive and all stakeholders have sufficient information, the result of this resource allocation can be regarded as an efficient, reasonable and optimal allocation for the present generation without considering the environmental impact on future generations.
3) The power generation of each unit after regulation is the result of the government’s redistribution of the production of each enterprise on behalf of the interests of future generations and in accordance with the goal of sustainable development, so as to optimize the interests of present and future generations.
3 Medium- and long-term runoff forecasting methods
3.1 Multiple linear regression model
The multiple linear regression model is a commonly used model in medium and long-term runoff forecasting, and its form is as follows:
In the formula,
The multiple linear regression model treats the relationship between the forecast object and the forecast factor as a linear relationship. The principle is simple and the parameters are easy to set. It has always played an important role in hydrological forecasting. However, when the forecast object and the forecast factor have an obvious nonlinear relationship, the forecast accuracy of the multiple linear regression model will be significantly reduced.
3.2 Support vector machines
Support vector machine is a new type of machine learning method based on statistical learning theory and structural risk minimization principle (Pan et al., 2020). To this end, the support vector machine regression method equation for medium and long-term runoff forecasting is established as follows:
In the formula,
In summary, Support vector machines use quadratic programming to solve support vectors. When the number of samples is large, quadratic programming involves high-order matrix calculations, which consume a lot of machine memory and calculation time. In addition, when using support vector machines to solve nonlinear problems, the kernel function should be selected carefully (Yang et al., 2021b).
3.3 Grey forecasting model
The grey theory was developed to solve the problem of lack of clarity and uncertainty of information, and gradually gained important attention internationally. There are a large number of location factors and uncertainties in medium and long-term runoff forecasting, so this theory can be used to construct a grey forecasting model. The formula is (Feng et al., 2010).
In the formula,
The grey prediction model can effectively use the limited medium and long-term runoff data to forecast future runoff, but when the uncertainty of the runoff sequence is the main component, the prediction accuracy of the model will be seriously reduced.
3.4 Predictor identification and error correction of artificial neural networks
Artificial neural network is a nonlinear, self-adaptive information processing system that simulates the activity of biological neurons, and includes powerful nonlinear mapping capabilities. When the number of neurons in the hidden layer is not limited, the three-layer neural network can approximate any nonlinear function infinitely, and is widely used in hydrological forecasting.
According to Kolmogorov’s principle, the empirical formula to clarify the number of nodes in the hidden layer of the neural network is as follows:
In the formula,
For nonlinear networks, it is difficult to select an appropriate neural network learning rate (Li et al., 2012). A learning rate that is too large will make learning unstable, and a learning rate that is too small will take a long time to learn. In addition, the number of nodes in the hidden layer of the network should also be limited to a certain area, otherwise there will be under-fitting or over-fitting. For this reason, the error is corrected by the Markov model, so that the forecast accuracy is higher and the power generation of the interconnected power system of the hydropower station is better dispatched.
Multivariate linear regression, artificial neural network and support vector machine for medium and long-term runoff forecasting models need to input predictor vectors. A set of predictors is constructed by correlation analysis, and on the premise of the significance level
Under normal circumstances, there is still a corresponding deviation between the predicted value and the actual value of the medium and long-term runoff forecasting model. Using the Markov correction model to correct the error can better improve the forecasting accuracy of the model. In this paper, the positive error describes that the predicted value is greater than the actual value, and the negative error describes that the predicted value is smaller than the actual value. Usually, the error indicates that the difference between the predicted value and the actual value is small. Using the mean and standard deviation method, the errors are divided into 5 grades: extra large positive and negative errors, large positive and negative errors and general errors, and calculate the error mean and error state one-step transition probability matrix of all grades. If the error process satisfies Markov, the error correction expression is:
In the formula,
4 Analysis of benefit characteristics of hydropower stations
The power generation benefit function of a hydropower station is related to the water head and power generation flow, and is affected by the relationship between the water level storage capacity and the tail water level flow. Simplify the problem and treat the tail water level as a constant. In many cases, the dynamic effects of tailwater levels cannot be ignored. Therefore, under the premise of considering the dynamic influence of tail water level, this paper analyzes the economic characteristics of the two-stage power generation of the hydropower station, so as to provide a more effective decision-making basis for the real-time operation of the reservoir (Wang et al., 2012).
4.1 Mathematical description of two-stage power generation of hydropower station
Reservoir scheduling is a two-stage rolling decision problem. Among them,
The two stages of power generation are:
In the formula:
In Eq. 6, it is assumed that the power generation efficiency
4.2 Analysis on the benefit characteristics of power generation in two stages
The total power generation
The marginal contribution of the storage capacity A at the end of the facing period to the two-stage power generation (Zhan and Zuo, 2012) is:
In the formula,
From Taylor’s first-order expansion, we get:
Substitute
Put
In Formula 11,
Since reservoirs with a large drop (Jinghua and Hua, 2011) usually satisfy
It can be seen that for the reservoir satisfying
4.2.1 Analysis of factors affecting total power generation
The marginal benefit of the total power generation
Using
It can be seen from Eq. 14 that the marginal benefit of the total power generation is affected by the current status of the reservoir and the engineering characteristics of the reservoir, namely the water level-capacity relationship of SSR (*) and the tailwater level-discharge relationship of SDR (*). Eq. 15 expresses the influence of the relationship between water level and storage capacity on the marginal benefit of total power generation, and Eq. 16 expresses the influence of the relationship between tail water level and flow on the marginal benefit of total power generation.
4.2.1.1 Influence of water level and storage capacity relationship
From the water balance [30]
In addition, through the first-order Taylor expansion, it can be obtained:
In the formula,
4.2.1.2 The influence of tail water level and flow relationship
In Eq. 16, both the first half and the second half are functions of displacement. First analyze the change law of
The derivative of
It can be assumed that the tail water level flow relationship curve conforms to the series of formulas:
In the formula,
Its second-order formula is
From the above Formulas 23, 24, we can get:
4.2.2 Concavity and convexity analysis of total power generation
The second derivative of the total power generation is:
According to the characteristics of the water level storage capacity relationship curve, it can be known that
4.2.3 Monotonicity analysis of total power generation
It can be obtained by Formulas 8, 16:
It can be obtained by Formulas 14, 20, 27:
To sum up, it is assumed that
It can be known from Formula 28 that if
5 Experiment and analysis of experimental results
This paper takes a hydropower station as the research object, and studies the medium and long-term power generation operation of the reservoir. The hydropower station is a comprehensive water conservancy project focusing on power generation and taking into account flood control. In addition, it also has comprehensive utilization benefits such as retaining sand, improving the navigation conditions of the reservoir area and the river section under the dam. The controlled area of the reservoir is 438,800 square kilometers, accounting for 95,200 square kilometers of the entire basin. The total storage capacity is 12.43 billion m3, the normal water level is 650 m, and the dead water level is 590 m. The corresponding storage capacity is 11.02 billion m3/s and 5.025 billion m3/s respectively. Its annual regulatory performance is incomplete. The rated total installed capacity is 12 million kW, and the average annual power generation is 56.04 billion kW hours. Guaranteed output of 3.409 million kw h.
Combined with the artificial neural network model mentioned in 3.2, the runoff in 2018 is predicted month by month. According to the forecast runoff combined with different scheduling methods, the scheduling scheme is obtained, and the actual working conditions are obtained according to the actual water flow combined with different scheduling methods.
According to the neural network optimization scheduling model, using Java language programming, taking the hydropower station’s maximum power generation as the optimal scheduling objective, a medium and long-term optimal scheduling model for hydropower stations is established. Input the runoff data representing the year, and the model parameters are set as follows: the penalty coefficient is 1, the penalty index is 2, the convergence accuracy is 5 × 10⁻⁵, the maximum discrete step size is 0.4, and the maximum number of iterations is 100. Optimize the water level process for each month in 2018, and then perform scheduling calculations based on the optimized water level process. It was concluded that in 2018 the hydropower plant has a planned annual power generation capacity of 61.340 billion kWh. Tables 1, 2 are the scheduling of traditional and this method respectively.
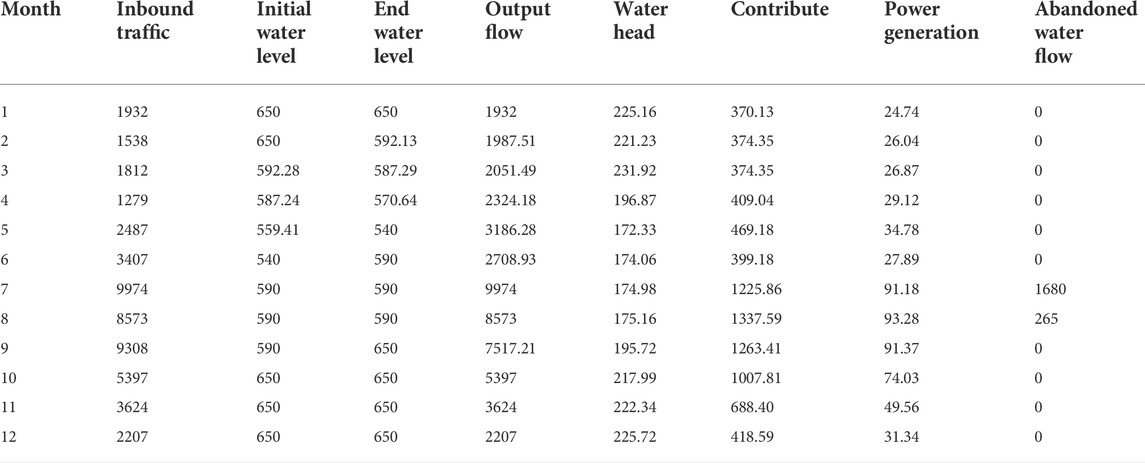
TABLE 1. The running process of the conventional scheduling plan.
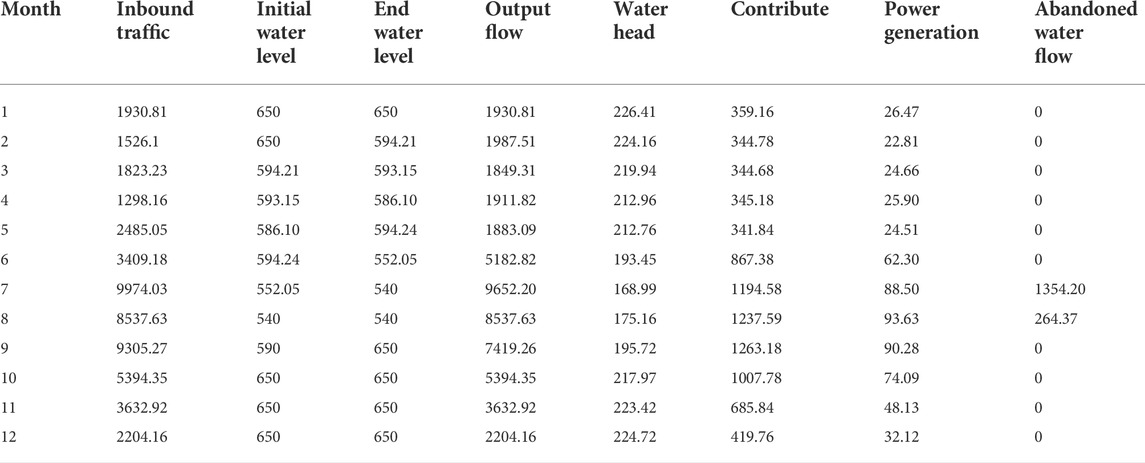
TABLE 2. The scheduling plan running process of the method in this paper.
It can be seen from Tables 1, 2 that in July, the amount of discarded water under conventional dispatch has reached 1680, while the amount of discarded water in this dispatch method is less than 1354.2. In August, the amount of water discarded by the conventional dispatch mechanism was 265, and the amount of water discarded by the dispatch mechanism in this paper was 264.37. This shows that the dispatching mechanism method in this paper has great advantages, reduces the waste of water resources, and can ensure the increase of the power generation of the hydropower station.
To better understand the scheduling situation, Figure 1 shows the comparison results between the traditional scheduling model and the scheduling model in this paper.
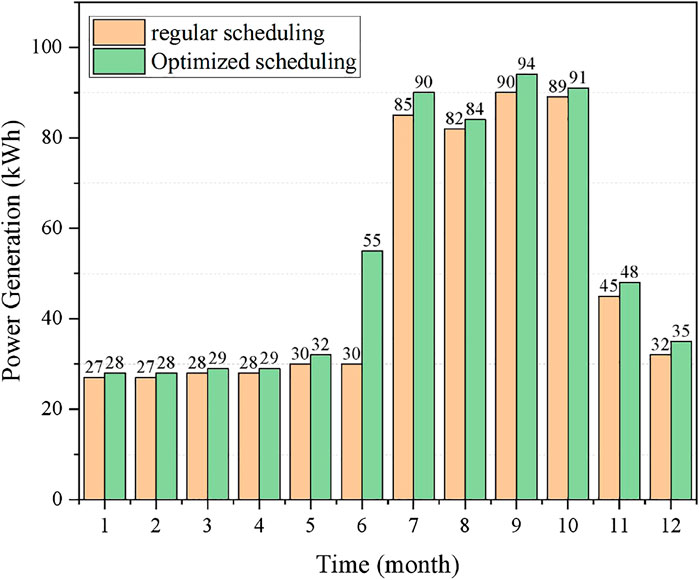
FIGURE 1. Comparison of monthly power generation.
It can be seen from Figure 1 that the power generation of the hydropower station under the conventional dispatching method is not as much as the optimized power generation in this paper, especially in June, when the amount of rainwater is large, this paper can better allocate the water resources of the hydropower station, make better use of resources, and reduce waste, thereby producing more power energy.
The actual operation process of the two scheduling methods and the operation process of different forecast runoff plans are shown in Figure 2. Among them, plan one represents the running process of traditional BP neural network forecasting runoff plan, and plan two represents the running process of optimizing artificial neural network forecasting runoff plan.
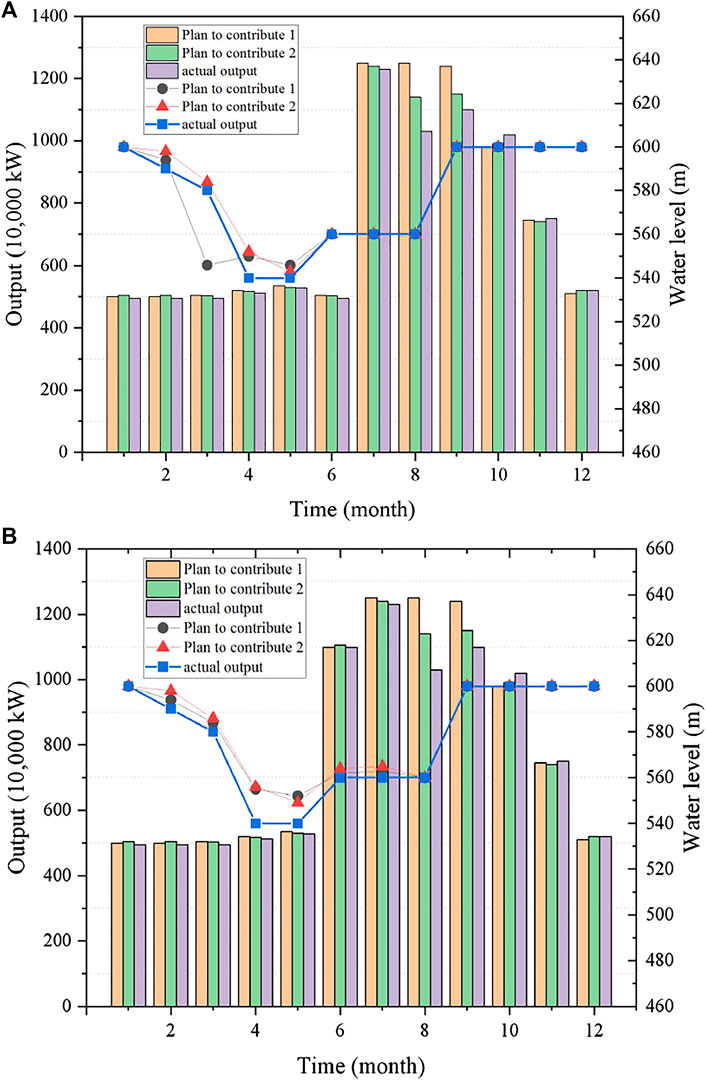
FIGURE 2. The actual operation process of the two scheduling methods and the operation process of different forecast runoff plans. (A) Comparison of the monthly average output process and the water level process in the actual process and planning process of traditional dispatching. (B) Comparison of the monthly average output process and the water level process in the actual process and planning process of optimal scheduling.
The following conclusions can be drawn: the optimal dispatching effect after the whole year is better than the conventional dispatching effect, indicating that the optimal water level adjustment process is obviously helpful to increase the annual power generation. In the process of formulating the dispatch plan, the optimized BP neural network is reasonably used to provide the predicted runoff input for the dispatch model.
6 Conclusion
In this paper, a hydropower station is designed as the research object, and a systematic study on medium and long-term power generation dispatching of the reservoir is carried out according to a series of characteristics such as integrity and dynamicity of reservoir dispatching. It can be seen from the experiment that the annual power generation of optimal dispatch is 1.92% higher than that of conventional dispatch. Comparing the results of conventional dispatch and optimal dispatch, as well as the planned operation process and actual operation process of the two dispatch methods, the following conclusions can be drawn: It further verifies the rationality of BP neural network to provide forecast runoff input for scheduling planning; secondly, compared with conventional dispatching, optimal dispatching has an increase in total power generation; thirdly, according to the operating water level process, optimal dispatching The drop of the dispatched water level is smaller, and the water level process is more stable; fourth, because the water supply period does not fall to the dead water level at the end of the water supply period, the output value of the optimal dispatching in the first month of the water storage period is higher than that of the conventional dispatching, thereby increasing the power generation. To a certain extent, this paper reflects the flexibility of changes in the optimization of power generation scheduling in the medium and long term, and verifies the rationality of the BP neural network to provide runoff input for medium and long-term scheduling. Important guiding role.
Data availability statement
The original contributions presented in the study are included in the article/supplementary material, further inquiries can be directed to the corresponding author.
Author contributions
SJ and YT conceived and designed the calculations and experiments; PW performed the simulation; XP contributed analysis tools; SJ and YT wrote the paper.
Funding
This work was supported by the Scientific Project of the science and technology Department of Hunan province (Grant No. 2020Gk4061, No. 2021Gk5055).
Conflict of interest
The authors declare that the research was conducted in the absence of any commercial or financial relationships that could be construed as a potential conflict of interest.
Publisher’s note
All claims expressed in this article are solely those of the authors and do not necessarily represent those of their affiliated organizations, or those of the publisher, the editors and the reviewers. Any product that may be evaluated in this article, or claim that may be made by its manufacturer, is not guaranteed or endorsed by the publisher.
References
Ansarian, M., Sadeghzadeh, S. M., and Fotuhi-Firuzabad, M. (2015). Optimum generation dispatching of distributed resources in smart grids. Int. Trans. Electr. Energy Syst. 25 (7), 1297–1318. doi:10.1002/etep.1906
Fan, Y. H., Zhang, W., Han, W. C., and Tang, X. J. (2009). Research on energy-saving generation dispatching model in regional grid considering bidding mechanism. Power Syst. Prot. Control 37 (18), 83–88. doi:10.3969/j.issn.1674-3415.2009.18.018
Feng, P., Chen, Z., Wu, D., and Li, J. (2010). Research on implementation of energy-saving power generation dispatching mechanism in anhui province. Energy Technol. Econ. 22 (07), 25–29. doi:10.3969/j.issn.1674-8441.2010.07.005
Husin, H., and Zaki, M. (2021). A critical review of the integration of renewable energy sources with various technologies. Prot. Control Mod. Power Syst. 6 (1), 1–18. doi:10.1186/s41601-021-00181-3
Jinghua, L., and Hua, W. (2011). A multi-agent system to draw up energy-saving power generation dispatching schedule. Power Syst. Technol. 35 (5), 90–96. doi:10.1097/MCC.0b013e328344b397
Kumar, A., Bhadu, M., and Kumawat, H. (2018). “Unit commitment in thermal power generation dispatching with integration of PHEVs,” in 2018 8th IEEE India International Conference on Power Electronics (IICPE).
Le, S., Wu, Y., Guo, Y., and Vecchio, C. D. (2021). Game theoretic approach for a service function chain routing in NFV with coupled constraints. IEEE Trans. Circuits Syst. II 68 (12), 3557–3561. doi:10.1109/tcsii.2021.3070025
Li, C., Lv, S., Cao, Y., He, L., Zhang, W., and Xia, Z. (2012). A new method for day-ahead unit commitment based on energy-saving generation dispatching. Proc. CSEE 16, 70–76.
Li, H., Deng, J., Feng, P., Pu, C., Arachchige, D., and Cheng, Q. (2021a). Short-term nacelle orientation forecasting using bilinear transformation and ICEEMDAN framework. Front. Energy Res. 697, 780–928. doi:10.3389/fenrg.2021.780928
Li, H., Deng, J., Yuan, S., Feng, P., and Arachchige, D. D. (2021b). Monitoring and identifying wind turbine generator bearing faults using deep belief network and EWMA control charts. Front. Energy Res., 770. doi:10.3389/fenrg.2021.799039
Li, X. F., and Tan, L. J. (2012). Research on models and compensation mechanism of energy-saving generation dispatching. Adv. Mater. Res. 354, 1041–1046. doi:10.4028/www.scientific.net/AMR.354-355.1041
Liu, X. (2021). Multiple time‐scale economic dispatching strategy for commercial building with virtual energy storage under demand response mechanism. Int. J. Energy Res. 45 (11), 16204–16227. doi:10.1002/er.6853
Ming, Z., Lianjun, S., and Jun, D. (2007). Study on issues related to Energy-Saving Dispatching of generation that conforms to the market mechanism. Electr. Power Technol. Econ. 1, 1–5. doi:10.3969/j.issn.1674-8441.2007.05.002
Pan, X., Liang, Y., Deng, X., Li, M., Cui, J., and Yang, J. (2020). Low-carbon economic dispatching model of electric-heating combined system considering multi-type energy storage. IOP Conf. Ser. Earth Environ. Sci. 546 (2), 022017. doi:10.1088/1755-1315/546/2/022017
Sakthivel, V. P., and Sathya, P. D. (2021). Single and multi-area multi-fuel economic dispatch using a fuzzified squirrel search algorithm. Prot. Control Mod. Power Syst. 6 (1), 1–13. doi:10.1186/s41601-021-00188-w
Shang, J. (2007). Research on energy-saving generation dispatching mode and operational mechanism considering market mechanism and government macro-Control. Power Syst. Technol. 31 (24), 55–62. doi:10.1016/S1005-8885(07)60138-1
Tan, Z. F., Song, Y., Li, X., Zhang, H., and An, J. (2014). Energy-saving generation dispatching optimization model based on time-of-use price mechanism. Operations Res. Manag. Sci. 23 (1), 101–107. doi:10.3969/j.issn.1007-3221.2014.01.015
Tan, Z., Liu, K., Song, Y., Rao, R., and Xu, J. (2012). Analysis model for the impact of energy-saving generation dispatching policy on energy and environment. East China Electr. Power 40 (9), 1464–1468.
Wang, D., Qiu, Y., Ping, A., and Liu, C. (2012). Problems and considerations on energy-saving generation dispatching in yunnan. Power Syst. Clean Energy 28 (12), 34–37. doi:10.3969/j.issn.1674-3814.2012.12.007
Wei, Q., Han, X., Guo, W., Yang, M., and Liu, G. (2016). Load following mechanism and power flow algorithm under generator rotor angle control mode. IET Gener. Transm. & Distrib. 10 (7), 1510–1518. doi:10.1049/iet-gtd.2015.0131
Yang, N., Dong, Z., Wu, L., Zhang, L., Shen, X., Chen, D., et al. (2021a). A comprehensive review of security-constrained unit commitment. J. Mod. Power Syst. Clean Energy 10 (3), 562–576. doi:10.35833/MPCE.2021.000255
Yang, N., Qin, T., Wu, L., Huang, Y., Huang, Y., Xing, C., et al. (2022b). A multi-agent game based joint planning approach for electricity-gas integrated energy systems considering wind power uncertainty. Electr. Power Syst. Res. 204, 107673. doi:10.1016/j.epsr.2021.107673
Yang, N., Yang, C., Wu, L., Shen, X., Jia, J., Li, Z., et al. (2021b). Intelligent data-driven decision-making method for dynamic multi-sequence: An E-Seq2Seq based SCUC expert system. IEEE Trans. Industrial Inf. 18 (5), 3126–3137. doi:10.1109/TII.2021.3107406
Yang, N., Yang, C., Xing, C., Ye, D., Jia, J., Chen, D., et al. (2022a). Deep learning‐based SCUC decision‐making: An intelligent data‐driven approach with self‐learning capabilities. IET Generation Trans Dist 16 (4), 629–640. doi:10.1049/gtd2.12315
Ye, Y., Zhang, W., and Zhang, Y. (2008). Research on benefit-compensation mechanism of energy saving power generation dispatching in compatible market mechanism. Power Demand Side Manag. 6, 7–10. doi:10.3969/j.issn.1009-1831.2008.06.003
Zhan, Y., and Zuo, Z. (2012). Energy-saving generation dispatching model about power dispatching under carbon emission trading mechanism. Eng. J. Wuhan Univ. 45 (5), 662–666.
Zhang, L., Guohui, X. I. E., and Ze, Z. H. U. (2009). Quasi marketization model of energy-saving generation dispatching. Automation Electr. Power Syst. 33 (8), 29–32.
Zhang, Y., Qian, T., and Tang, W. (2022). Buildings-to-distribution-network integration considering power transformer loading capability and distribution network reconfiguration. Energy 244, 123104. doi:10.1016/j.energy.2022.123104
Keywords: runoff forecast, power system, power generation scheduling mechanism, energy saving, sustainable development of resources
Citation: Jiang S, wu P, Peng X and Tang Y (2022) Research on generation scheduling mechanism of interconnected power system based on runoff forecast. Front. Energy Res. 10:964516. doi: 10.3389/fenrg.2022.964516
Received: 08 June 2022; Accepted: 27 June 2022;
Published: 22 July 2022.
Edited by:
Yusen He, The University of Iowa, United StatesCopyright © 2022 Jiang, wu, Peng and Tang. This is an open-access article distributed under the terms of the Creative Commons Attribution License (CC BY). The use, distribution or reproduction in other forums is permitted, provided the original author(s) and the copyright owner(s) are credited and that the original publication in this journal is cited, in accordance with accepted academic practice. No use, distribution or reproduction is permitted which does not comply with these terms.
*Correspondence: Yibo Tang, NjI2MzIzMzIwQHFxLmNvbQ==