 Di Wang
 Xianghui Lu1
 Suizheng Qiu
94% of researchers rate our articles as excellent or good
Learn more about the work of our research integrity team to safeguard the quality of each article we publish.
Find out more
ORIGINAL RESEARCH article
Front. Energy Res., 22 August 2022
Sec. Nuclear Energy
Volume 10 - 2022 | https://doi.org/10.3389/fenrg.2022.964171
This article is part of the Research TopicExperimental and Numerical Studies on Liquid Metal Cooled Fast ReactorsView all 17 articles
Bubble columns represent an extreme case of gas-liquid two-phase flow, where net liquid velocity is zero and the gas simply bubbles up through the liquid. The bubble column-type gas-liquid metal two-phase flow always appears in an accident scenario for pool-type lead-bismuth eutectic cooled fast breeder reactors. To accurately predict the void fraction for the accident evaluation and design of a reactor system, nine existing drift-flux type constitutive correlations are evaluated with a nitrogen-liquid heavy metal two-phase flow test. Few correlations give a relatively good prediction and the basic assumption in the distribution parameter calculation is not applicable for a bubble column. To solve this problem, analysis based on Clark’s theoretical model is carried out. The results show that the distribution parameter assumes very high values at a low Re number. As the Froude number increases, the distribution parameter tends to decrease. At lower void factions, the distribution parameter is also assumed to be at high values. This indicates that the pipe size, flow rate, and void fraction can all influence the distribution parameter. Considering the quantitative laws of these influence factors obtained by theoretical analysis and fitting the data of Ariyoshi’s test, a new correlation for a bubble column-type gas-LBE two-phase flow is developed and evaluated. The results of the statistical analysis show that the new correlation gives the best prediction for gas-LBE two-phase flow in the void fraction range of 0.018–0.313.
Gas-liquid two-phase flow is a kind of fluid mixture that is capable of efficiently transporting mass, momentum, and heat energy in various engineering fields (Han et al., 2020). A bubble column represents an extreme case of gas-liquid two-phase flow, where net liquid velocity is zero and the gas simply bubbles up through the liquid (Clark and Egmond, 1990). This phenomenon is frequently encountered, especially in chemical engineering and metallurgy. With the development of nuclear power technology, the bubble column-type gas-liquid metal two-phase flow has attracted more attention as a typical thermal-hydraulics phenomenon during a hypothetical accident in pool-type liquid metal cooled fast breeder reactors (FBRs). For instance, in the long-term stage (i.e., the main pump has been shut down) of a steam generator tube rupture (SGTR) in a lead-bismuth eutectic (LBE) alloy cooled fast reactor, steam released from the break of the tube into the reactor vessel may transport upward through the active section from the bottom inlet of the reactor core and introduce additional activity due to the moderation effect of water, which threatens the reactor’s safety. During a severe accident scenario in FBRs, the gas generated from the melting and boiling of fuel, cladding, and liquid metal coolant may also form a multi-phase flow in a static liquid metal pool and relocate the fuel, which causes the risk of re-criticality in the molten core. Meanwhile, the gas-phase fission product may transport upward through the liquid metal into the cover gas and cause a risk of radioactivity release. The basic characteristic of these phenomena during an accident is a bubble column-type gas-liquid two-phase flow. Therefore, to determine the core activity introduced by gas bubbles and to evaluate the consequences of an accident, the void fraction in the vertical flow channel of the reactor core should first be obtained. Therefore, reliable prediction of the void fraction is necessary.
The one-dimensional correlation based on the drift-flux model has been often used for void-fraction prediction (Abbs and Hibiki, 2019), and is one of the most practical and accurate models to solve many engineering problems. In the past few decades, various correlations for calculating the drift-flux model parameters have been developed based on gas-water two-phase flow test with relatively high liquid velocity. Ishii (1977) first considered a fully developed bubbly flow, and assumed that the distribution parameter C0 would depend on the density ratio and Reynolds number (Hibiki and Ishii, 2003), and also gave the correlations applied to fully developed flow in small diameter round pipe. The modified equations considering the Sauter mean diameter (Hibiki and Ishii, 2002) and for boiling bubbles (Ishii, 1977) were then developed. For large diameter pipes, Hills (1976), Shipley (1984), and Clark and Flemmer (1985) measured the void fraction of air-water and developed some correlations. Then, Kataoka and Ishii (1987) found the effect of tube diameter, pressure, gas flux, and fluid physical properties on drift velocity and develop a correlation of about vgj+. In Ishii’s research, C∞, the asymptotic value of C0 is approximated to be constant (C∞ = 1.2) for upward flow in a round pipe based on the water test data. Under this assumption, the C0 only depends on the density ratio between gas and liquid. However, the applicability of the assumption of constant in a bubble column-type gas-liquid metal two-phase flow remains to be discussed. Shen and Hibiki (2020) evaluated the problem with several gas-liquid metal experimental data and showed that the distribution parameter correlation of Ishii with C∞ = 1.2 or 1.35 (rectangular tube) predicted well the N2-Na/K two-phase flow with high gas-to-liquid density ratio but cannot give reasonable predictions for the large C0 values in the other two-phase flows with low gas-to liquid density ratios. Their study also pointed out the extremely high C0 value may appear when the pipe’s diameter is greater than 0.06 m in a N2-Pb/Bi mixture. In another study of bubble column-type two-phase flow, Clark and Egmond (1990) found that the constants vary significantly due to the effect of buoyancy and low liquid velocity. Compared with water, the density of liquid lead-bismuth is about 10 times higher. Therefore, the buoyancy effect is more significant, which may lead to a higher distribution parameter. Consequently, the existing correlation can be further improved by considering the effect of liquid density, Reynolds number, and buoyancy to extend its applicability in bubble column-type gas-liquid metal flow. However, their work is limited by the lack of test data number of existing bubble column-type gas-LBE two-phase flow test because of the difficulty of void fraction and velocity measurement in a non-transparent liquid medium. This makes it difficult to analyze the gas bubble flow mechanism in liquid metal with high density. The existing method is to obtain a certain value of the parameter in a drift-flux model by directly fitting all of the available data points, such as in Mikityuk et al.’s (2005) study, or by combining different correlations based on gas-water two-phase flow by interpolation to approximate the experimental data, such as the modified application in SIMMER-III code (Suzuki et al., 2003).
A method that combines theoretical analysis with experimental data is adopted in this study to clarify the effect of buoyancy, Reynolds number, and so on, on the distribution parameter. Therefore, a theoretical model for velocity radial distribution in bubble columns was proposed by Clark and Egmond. (1990), derived for gas-liquid metal two-phase flow to quantitatively achieve the effect of the above parameter. Based on the calculated result with the theoretical model and Ariyoshi et al.’s (2017) gas-LBE test data, a set of new correlations were applied for bubble column-type gas-liquid lead-bismuth two-phase flow in the drift-flux model and developed and verified by comparing them with test data and other existing correlations.
Zuber and Findlay (1965) were the first to take into account both the effect of nonuniform flow and concentration profiles, as well as the effect of the local relative velocity between the phases in analysis, and developed the following one-dimensional drift-flux model to predict the cross-sectional averaged void fraction in a flow channel:
Where vg, α, j, jg, jf, C0, and vgj are gas velocity, void fraction, mixture volumetric flux, superficial gas velocity, superficial liquid velocity, distribution parameter, and drift velocity, respectively. < > and << >> are the area-averaged and void-fraction weighted mean quantities. The distribution parameter and drift velocity are defined as
The non-dimensional expression is shown as follows, which is derived by dividing Equation 1 by the factor of
where
X represents superficial gas and liquid velocity and drift velocity.
C0 and vgj represent the effect of void distribution and the relative velocity between phases. A number of constitutive correlations of C0 and vgj have been developed based on air/steam-water two-phase flow experimental data. In addition, several new correlations have been derived from the data of gas-liquid metal two-phase flows in recent years.
As mentioned in the introduction, Ishii has indicated that the distribution parameter is modeled by considering the density ratio of gas and liquid phases:
where C∞ is the asymptotic value of the distribution parameter as the density ratio near zero. Meanwhile, as the density ratio approaches unity, the distribution parameter should also become unity. According to the experimental data of the fully developed flow in a round tube (Ishii, 1977), we have
Over a wide range of Reynolds numbers, this equation can be approximated by C∞ = 1.2 for a flow in a round tube. Thus, the following correlation for flow in small size tube:
Drift velocity correlations for different flow regimes are developed by Ishii based on drag law (Ishii, 1977).
Compared with medium size channels, the different flow phenomena observed in large size channels are the formation of liquid recirculation (secondary flow) patterns in a bubbly flow and the disintegration of large bubbles due to surface instabilities (Abbs and Hibiki, 2019). Kataoka and Ishiii (1987) took the secondary flow in gas-water two-phase flow under the stagnant liquid conditions into account and developed the following correlations:
where
Kocamustafaogullari and Ishiii. (1985) considered the dominant effect of large cap bubbles on the drift velocity in two-phase flow and developed the following correlations for cap bubbly flow in vertical flow channels:
As for gas-liquid metal two-phase flow, Mikityuk et al. (2005) analyzed five sets of experimental data with different geometries, working fluids, flow rates, and void fraction ranges and compared four types of correlations for pool-type (average superficial liquid velocity is zero) and loop-type channels. The recommended correlations are given by Equation 12. Because the high value of C0 in the correlations for pool data shows that the liquid’s velocity has a significant effect on the drift-flux parameter, their study indicated that the use of the correlation should be based not on the local characteristic length (bubble size) but on the pool diameter to reflect the fact that the multi-dimensional flow patterns, in this case, influence the two-phase flow parameters. In Mikityuk et al.’s study, the distribution parameter C0 is a certain value, which is obtained by fitting test data directly:
Shen and Hibiki. (2020) developed two correlations for the low and high wettability between the liquid metal and channel wall surface, respectively, as shown in Equation 13.
For the low wettability wall surface
and for the high wettability wall surface
Up to now, we have surveyed a total of nine correlations. Each correlation is allocated a number for comparison in Section 4, as shown in Table 1.
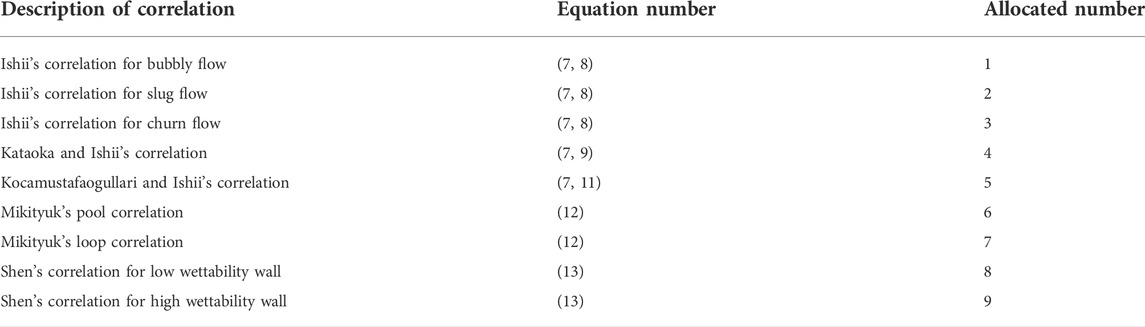
TABLE 1. Summary of the nine correlations.
Although many steam, nitrogen, and air-water two-phase flow tests have been carried out over the last few years, the number of gas-liquid LBE two-phase flow tests is much less due to the limitation of measurement difficulty and applied range, especially the bubble column. Three sets of bubble column-type tests are available and have been adopted for correlation evaluation and development, which is summarized in Table 2. In these tests, LBE and the similar heavy metal Gallium are used. The physical property parameters of liquid metal and water in tests are shown in Table 3.
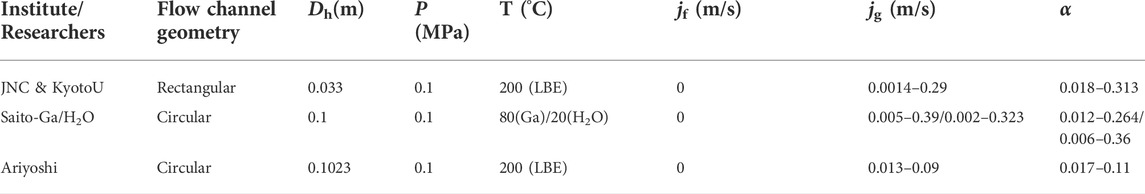
TABLE 2. Experiment study of liquid metal two-phase flow.
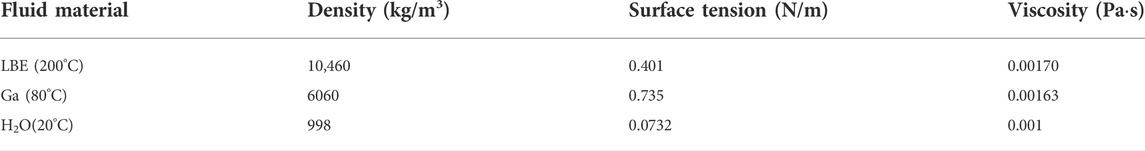
TABLE 3. Physical property parameter of liquid in the experiment.
This test was performed under a joint research project by Japan Nuclear Cycle Development Institute (JNC) and Kyoto University (KyotoU) (Hibiki et al., 2000). Figure 1 shows a schematic diagram of the test facility. The test section is a rectangular tank whose inner height, width, and thickness are 530, 100, and 20 mm, respectively. Molten lead-bismuth eutectic is contained in the tank and nitrogen is injected uniformly from seven vertical nozzles that are mounted on the bottom of the tank. The experiment is conducted by varying gas superficial velocity jg over range of 0.005–0.3 m/s while keeping the temperatures of nitrogen and molten lead–bismuth constant at 473 K.
FIGURE 1. Diagram of the JNC & KyotoU test facility (Hibiki et al., 2000).
In the experiment, high frame-rate neutron radiography technology is adopted to observe the flow regime and bubble shape. Void fraction can be also measured by the post process of the picture taken by a silicone intensifier target (SIT) tube camera (Hibiki et al., 2000). The test results show that a spherical or ellipsoidal bubble can be observed at a low gas velocity. As jg increases, large slug bubbles or cap like bubbles appeared together with highly deformed small bubbles. The 35 sets of databases (time and space averaged void fraction vs. gas superficial velocity) from the three cases are used for correlation evaluation and validation in the current analysis.
This experiment was performed by Saito et al. (1998) in the Tokyo Institute of Technology to study the hydraulic characteristics of a gas-liquid two-phase flow. As shown in Figure 2, the test section is a cylindrical vessel with an inner diameter of 10 cm. Through a plate with 2 mm diameter holes, nitrogen is injected into gallium and water in two cases. This allows the effect of liquid’s physical property on two-phase flow to be compared directly. The void fraction is measured with a differential pressure gauge. The 68 and 43 sets of database (time and space averaged void fraction vs. gas superficial velocity) from gas-water and gas-gallium test cases are used for correlation evaluation and validation in the current analysis.
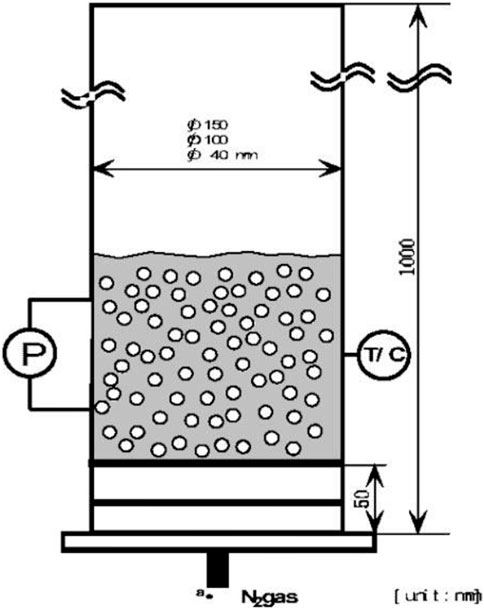
FIGURE 2. Diagram of Saito’s test facility (Saito et al., 1998).
This experiment was performed by Ariyoshi et al. (2017) at Kyoto University. Figure 3 shows the facility. A vertical circular pool is formed by a pipe with an inner diameter of 0.102 m. A three vertical annular pool is established by a combination of the pipe and inner concentric pipes with three different outer diameters. Nitrogen is injected from the bottom of the test section through the gas injector, which consists of 60 stainless steel needle tubes with 0.15 mm in inner diameter. The differential pressure was measured to estimate the time and space averaged void fraction at the measurement section. The database of the circular pool is used for new correlation development in the current analysis.
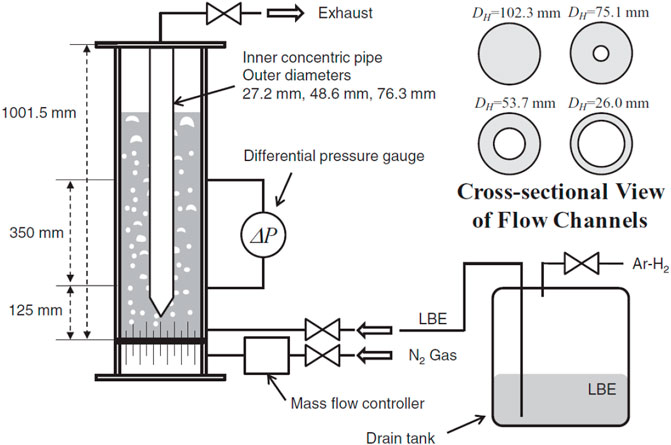
FIGURE 3. Diagram of Ariyoshi’s test facility (Ariyoshi et al., 2017).
The void fraction under different gas superficial velocities can be predicted by Equation 1 with each of the above drift-flux correlations. A comparison between the predicted value of void fraction and the test data in the JNC & KyotoU test is shown in Figure 4. The void fraction calculated by Ishii correlation only agrees relatively well in the range of the void fraction lower than 0.05. When the void fraction is higher than 0.05, Equation 8 for bubbly flow overpredicts significantly. Although the Ishii correlations for slug and churn flow are more applicable to the flow regime under a higher void fraction compared to the bubbly flow, the relative error is greater than 30% in gas-LBE two-phase flow.
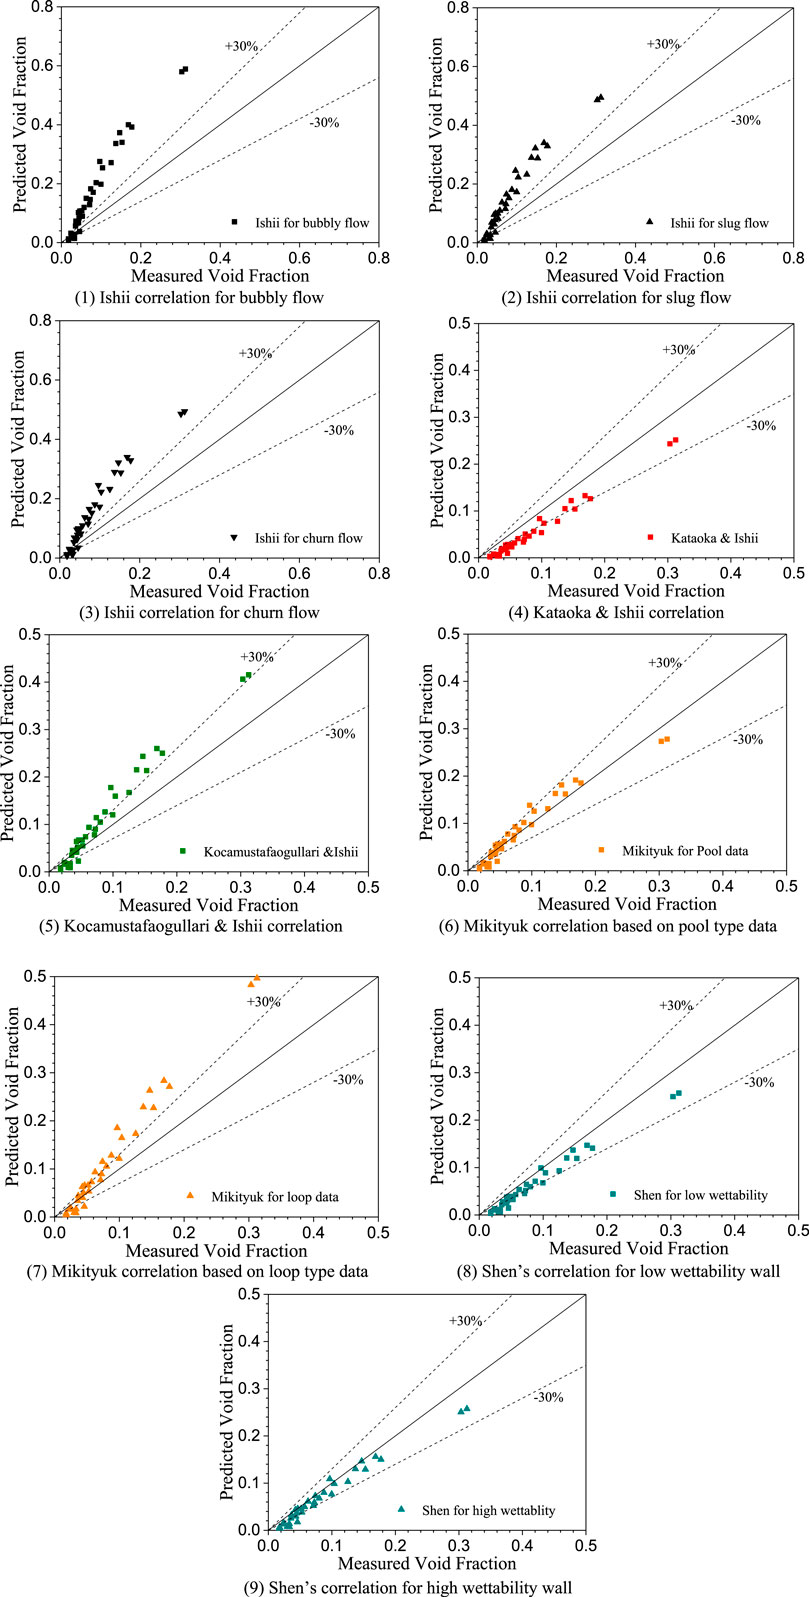
FIGURE 4. Comparisons between the measured (JNC experiment) and predicted void fraction. (A) Ishii correlation for bubbly flow. (B) Ishii correlation for slug flow. (C) Ishii correlation for churn flow. (D) Kataoka and Ishii correlation. (E) Kocamustafaogullari and Ishii correlation. (F) Mikityuk correlation based on pool type data. (G) Mikityuk correlation based on loop type data. (H) Shen’s correlation for low wettability wall. (I) Shen’s correlation for high wettability wall.
In the range of 0.018–0.313, the void fraction is 30% underestimated by Kataoka and Ishii’s correlation, as shown in Figure 4D. When the void fraction is lower than 0.05, this discrepancy increases to 80%. As a whole, as the void fraction increases, the prediction by Kataoka and Ishii’s correlation is improved. This tendency is consistent with the research by Schlegel et al. (2010), who recommended the Kataoka and Ishii correlation for slug flow with cap bubble in gas-water two-phase flow. This happens because, in liquid heavy metal, a bubble is more likely to deform to a cap-shaped in higher gas fluxes (Suzuki et al., 2003), due to the high density ratio between phases.
A comparison between the prediction of Kocamustafaogullari and Ishii correlation and test data is shown in Figure 4E. The result indicates that in the range of 0–0.05, the correlation underpredicts the void fraction. As the void fraction increases, the overestimation is about 30%, which is less than that by Ishii correlations for different flow regimes.
For the drift-flux model based on gas-liquid metal two-phase flow, Mikityuk’s pool-type correlation gives a good consistency with the test data. However, the loop-type correlation overestimates the void fraction, as shown in Figures 4F,G. This indicates that the distribution parameter tends to be greater than 1.0 when liquid velocity is relatively low so that the fitting value reaches 2.4 in Equation 12. It should be pointed out that the database of the JNC & KyotoU and Saito test has been also used for fitting in Mikityuk’s correlations. Therefore, other independent tests are recommended for evaluation in the future.
Figures 4H,I show the comparisons between the void fraction calculated by Shen’s correlation and measured in the JNC & KyotoU test. A little underestimation is observed in the void fraction range of 0.018–0.313. This demonstrates that the predictions of the drift-flux type correlation are in better agreement with the collected data than the correlations that only consider the density ratio in distribution parameter calculation.
Comparisons between predicted void fraction with drift-flux correlations and Saito’s nitrogen-gallium two-phase flow test data are shown in Figure 5. The overall prediction trend is consistent with that observed in the JNC & KyotoU test with liquid lead-bismuth. All of the drift-flux models derived from the gas-water database give more than ±30% deviation of the predicted value. Among the correlations based on gas-liquid metal, Mikityuk’s pool-type correlation and Shen’s correlation for low wettability wall are in good agreement with the test data.
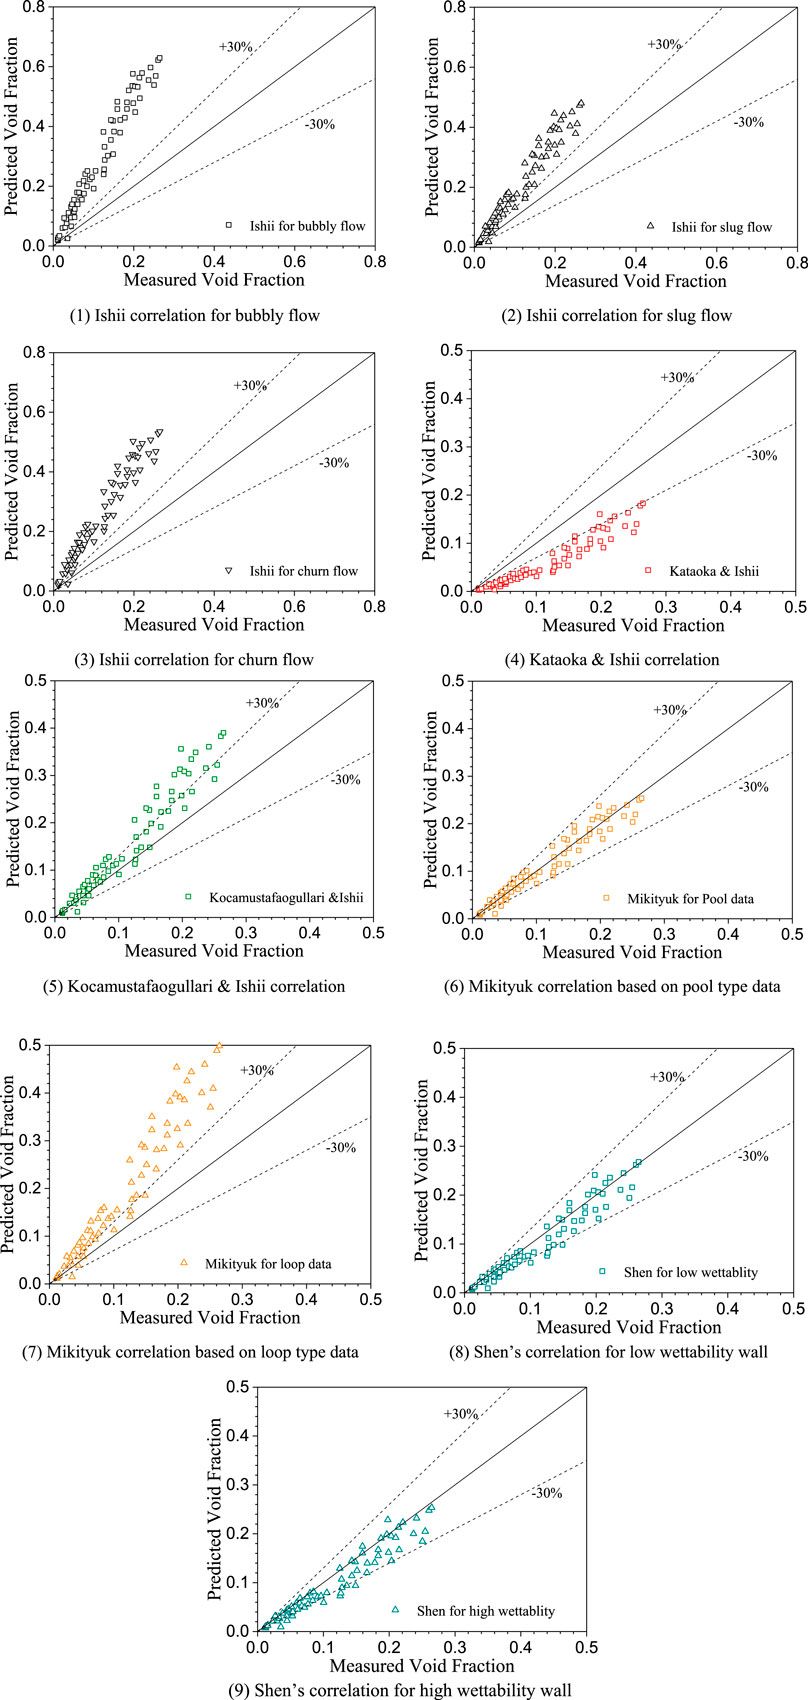
FIGURE 5. Comparisons between the measured (Saito-Ga experiment) and predicted void fraction. (A) Ishii correlation for bubbly flow. (B) Ishii correlation for slug flow. (C) Ishii correlation for churn flow. (D) Kataoka and Ishii correlation. (E) Kocamustafaogullari and Ishii correlation. (F) Mikityuk correlation based on pool type data. (G) Mikityuk correlation based on loop type data. (H) Shen’s correlation for low wettability wall. (I) Shen’s correlation for high wettability wall.
Correlations based on gas-water two-phase flow database are used to enhance the adequacy of the evaluation; that is, Equations 7–11 are further compared with the data obtained by the Saito-H2O test. The predicted deviation by Ishii (for slug flow), Kataoka and Ishii, and Kocamustafaogullari and Ishii correlations is less than ±30%, which is improved compared with the prediction for nitrogen-gallium two-phase flow. It must be pointed out that this comparison is not intended to verify the applicability of these correlations in gas-water two-phase flow (because they have been fully demonstrated with large amounts of test data), but is intended to indicate that the density ratio between phases indeed affects flow characteristics and the drift-flux parameter can be improved when applying to void-fraction prediction in a gas-liquid metal two-phase flow.
In summary, it can be observed that the density difference between liquid metal and water shows an obvious effect on the drift-flux parameter by comparing the predicted void fraction by two types of correlations derived from gas-water and gas-liquid metal two-phase flow database, respectively. For the correlations for gas-liquid metal two-phase flow, Mikityuk’s pool-type model agrees well with the test data. It should be noted that the test data has been also used for data fitting during the correlation development process, the application of which is beyond the range of the experimental parameter and should be further discussed. Other correlations can be further improved to apply better in bubble column-type gas-LBE two-phase flow, see Figure 6.
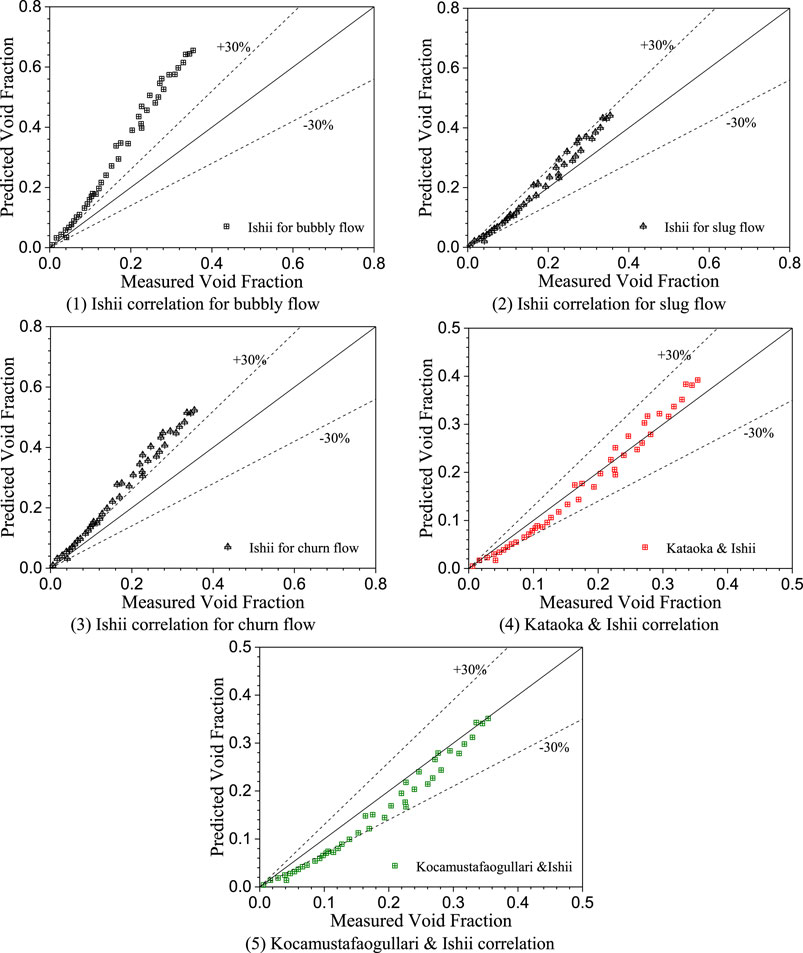
FIGURE 6. Comparisons between the measured (Saito-H2O experiment) and predicted void fraction. (A) Ishii correlation for bubbly flow. (B) Ishii correlation for slug flow. (C) Ishii correlation for churn flow. (D) Kataoka and Ishii correlation. (E) Kocamustafaogullari and Ishii correlation.
According to Clark and Van Egmond’s (1990) model, the two-phase flow along axial direction in a round tube is assumed to be one-dimensional and the void-fraction profile along radial direction r is assumed as in the following equation:
where
The density of two-phase mixture
where
the shear stress
where g is the gravitational acceleration and
As for
where μ is dynamic viscosity, U is the liquid velocity, l is the mixing length used by Clark and Egmond (1990).
By combining Equations 17 and 19, a formula as follows about the U along radius is obtained by introducing Equation 21.
In Equation 21, the wall shear stress
The average liquid velocity can be solved by integrating U(r) over the whole cross section of the channel, as shown in Equation 22:
For the convenience of solving, Equation 21 is converted into a dimensionless form:
where
where Ga is Galileo number, D is the channel diameter, and Equation 22 can be rewritten as
We iterate the wall shear stress until the calculated
where Fr is the Froude number. To solve the problem of the unknown local drift velocity for Fr calculation due to lack of measured data, we refer the reader to the study by Ariyoshi et al. (2017), and the void-fraction-weighted mean drift velocity is applied to Equation 27 as the approximate value of the local drift velocity vgj:
A program based on Fortran90 is coded to solve the distribution parameter by using this theoretical model. The calculation flow chart is shown in Figure 7, the centric void fraction (0.18), channel radius, and Froude number (0.38) are referred from the experiment case with a round tube that was conducted by Ariyoshi et al. (2017).
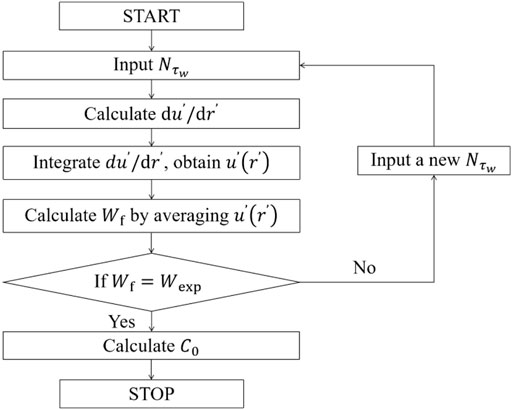
FIGURE 7. Calculation flow chart of Clark’s theoretical model.
The calculated liquid velocity profile over radius is shown in Figure 8. In the center of the flow channel, the liquid metal is entrained by rising bubbles and flows upward. Correspondingly, liquid metal near the wall flows downward to fill the vacancy after the fluid in the center area leaves. A flow circulation over radius forms. Because the liquid metal is contained in a static pool during the experiment, the overall volume flux over channel cross section and the liquid Reynolds number based on average velocity are zero.
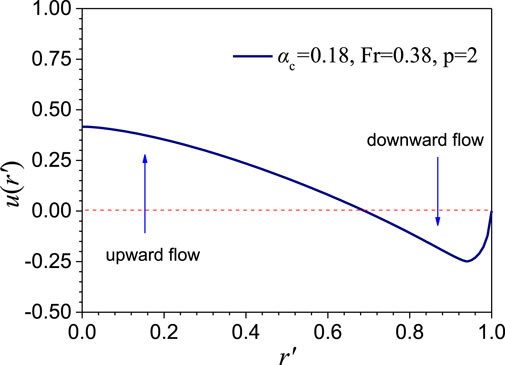
FIGURE 8. Calculated velocity along radial direction.
The distribution parameter calculated with Equation 26 versus Galileo number Ga is shown in Figure 9. Under the same Fr number, with Ga increasing, C0 increases significantly when Ga is in the range of 0–1.0×10⁵. When Ga > 1.0×10⁵, C0 remains almost unchanged. As shown in Equation 24, the definition of Ga includes liquid phase density and dynamic viscosity. It can be seen that the dynamic viscosity of the two kinds of liquid metal (LBE and Gallium) is close to that of water, and the density is about 5–10 times that of water. Therefore, under the same channel diameter, the Ga number of liquid heavy metal tends to be also larger than that of water, which leads to higher distribution parameters. This result is consistent with the phenomena observed in Saito et al.’s (1998) experiment.
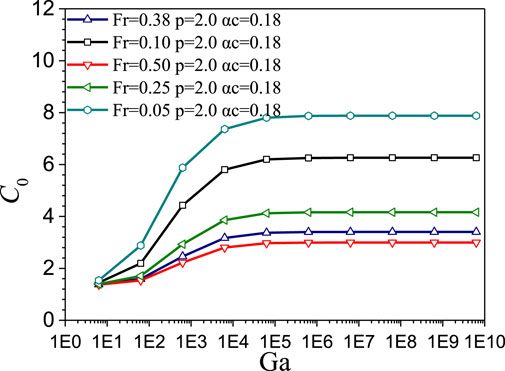
FIGURE 9. The effect of Ga on the distribution parameter.
Velocity profile along radial direction under different liquid Reynolds numbers (i.e., the velocity, viscosity, and density are based on liquid phase) is shown in Figure 10. The greater value of the Reynolds number represents a larger liquid velocity in the same channel. Figure 11 shows that as the Reynolds number increases, the distribution parameter reduces. When the Reynolds number is 100,000, the C0 has reached 1.28. It can be inferred from this that in the pool-type test conducted by JNC and KyotoU, Saito, or Ariyoshi, the liquid superficial velocity and Reynolds number of which are zero, the liquid velocity profile is significantly affected by buoyancy and the distribution parameter could be much higher than 1. This indicates that existing correlations are not suitable for lower liquid velocity two-phase flow. Furthermore, another factor is the Fr number—under larger Fr, the distribution parameter tends to be near 1.
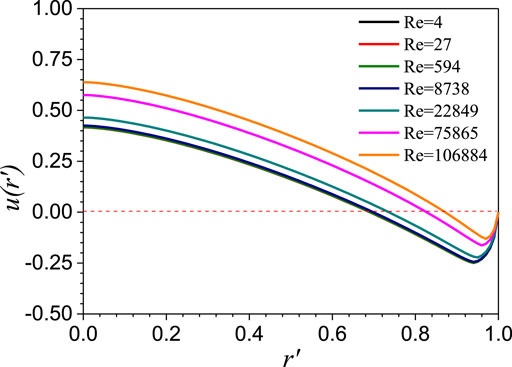
FIGURE 10. Velocity distribution along radial direction under different Reynolds numbers (Fr = 0.38, αc = 0.18, p = 2.0).
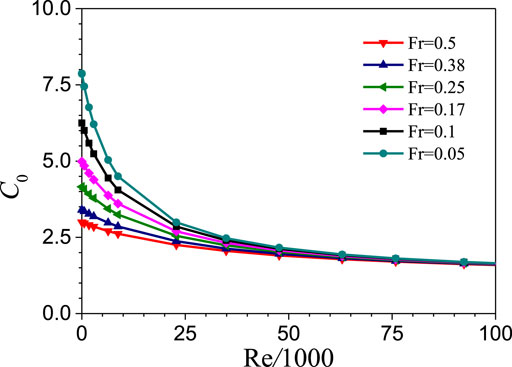
FIGURE 11. The effect of Re on the distribution parameter.
The effect of the void fraction on distribution is shown in Figure 12. Under the same power law (p = 2.0), for the calculated case (Fr = 0.38, Re = 0), when the center void fraction increases from 0.04 to 0.4, the distribution decreases from 6.3 to 2.45.
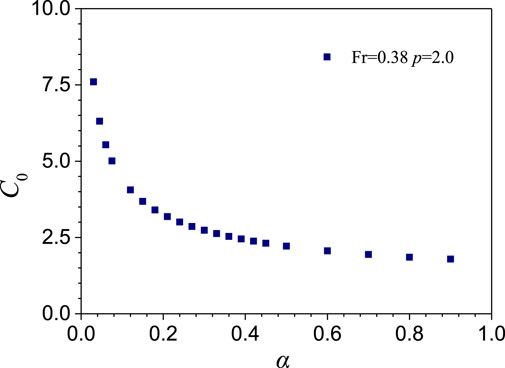
FIGURE 12. The effect of the void fraction on the distribution parameter.
Through the influence analysis of the distribution parameter based on Clark’s theoretical model, it can be seen that the distribution parameter is not only affected by the density ratio of gas and liquid phase but is also affected by the liquid phase velocity, void fraction, and Fr number. In this regard, the following analysis is carried out to consider these factors and develop new correlations. First, the theoretical method in Section 3.1 is used to calculate velocity distribution, as shown in Figures 8 and 10. Based on the velocity distribution and assumed void fraction distribution, C0 is calculated with Equation 26, so the relationship between C0 and Re, Fr, the void fraction can be obtained in the form of calculated datasets, as shown in Figures 11 and 12. In this section, the functions that C0 about Re, Fr, and void fraction is obtained by data fitting.
Ishii’s (1977) study on gas-water two-phase flow, distribution parameter can be represented by replacing Equation 7, as follows:
According to the calculated result shown in Figure 11, the distribution parameter decreases with the increase of Re. At the same time, with the increase of Fr, the distribution parameter corresponding to different Re numbers decreases totally. Therefore, it can be assumed that the f (Re) under different Fr meets
By fitting the calculated C0 versus Re dataset under the Fr is 0.38, the coefficients X1, X2, and X3 are given
Furthermore, the functions g1, g2, and g3 about the Fr number are given by fitting the calculated result of C0 versus Fr, as shown in following equation:
where the Fr number is obtained from Equation 27.
As can be seen from Figure 12, the distribution parameter decreases with the increase of the void fraction in the center of the flow channel. The function of C0 about void fraction when Fr is 0.38 is given by fitting the dataset of void fraction and distribution parameter, as shown in Equation 32:
When p, the exponent of the power law of void fraction distribution along the radius, is 2.0, αc is equal to 2.0<α>, and <α> is given by fitting the dataset from the nitrogen-LBE two-phase flow test case in circular channel conducted by Ariyoshi et al. (2017), as shown in Equation 33:
Consider the influence of void fraction in Equation 28, that is:
As for the gas drift velocity, referring to Shen and Hibiki’s (2020) evaluation result of
Finally, the new correlations consist of Equations 28, 30, and 31 and Equations 33–36.
Figure 13A shows the comparison between the void fraction predicted by newly developed correlations and JNC & KyotoU test data. After considering the influence of liquid phase velocity, Froude number, and void fraction on the distribution parameter, the predicted results with new correlations show agreement with gas-LBE two-phase flow test data. In the void fraction range of 0.018–0.313, most data points fall into the error band of −30% to 30%. A similar predicted result is also observed in the comparison with the Saito-Ga test, as shown in Figure 13B.
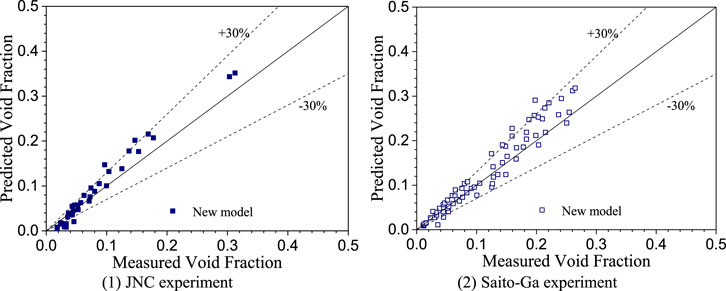
FIGURE 13. Comparisons between measured and predicted void fraction. (A) JNC experiment. (B) Saito-Ga experiment.
For statistical analysis, the relative error of the jth correlation when predicting the ith data point, εij, is defined as
The statistical mean and root-mean-square (RMS) value of εij are defined for a set of N data points in Equations 38 and 39:
These statistical relative errors are shown in Figure 14. It can be observed that the newly developed correlation (No. 10) tends to give the smallest mean relative error for predicting the void fraction in gas-LBE two-phase flow. The RMS of new correlations is also relatively small and comparable to Mikityuk’s (for pool, No. 6) correlation and Shen’s (for low wettability wall, No. 8) correlation. As for the evaluation with the Saito-Ga test, the new correlations also show good agreement with experimental data with a relatively small error.
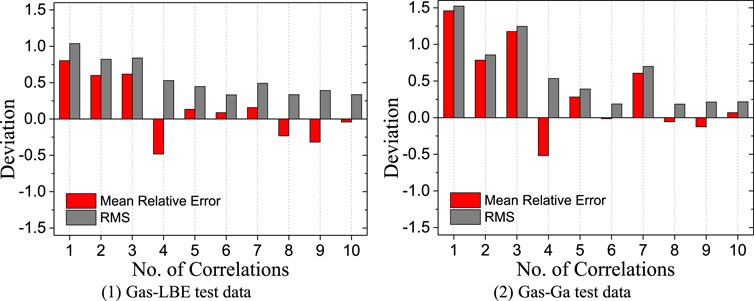
FIGURE 14. Statistical analysis of the predicted void fraction by correlations (1—Ishii for bubbly, 2—Ishii for slug, 3—Ishii for churn, 4—Kataoka and Ishii, 5—Koca and Ishii, 6—Mikityuk for pool, 7—Mikityuk for loop, 8—Shen for low wettability wall, 9—Shen for high wettability wall, 10—New developed model). (A) Gas-LBE test data. (B) Gas-Ga test data.
To determine the best correlation for gas-liquid metal two-phase flow in a bubble column from the statistical result in Figure 14, a benchmark coefficient ξj is used which refers to the method adopted in the evaluation of convective heat transfer correlations (Pacio et al., 2015), as shown in Equation 40. In this coefficient, both the absolute mean relative error and RMS value of correlation are considered. A larger value of the coefficient in the range of 0 ≤ ξj ≤ 1 indicates a better prediction performance:
From Table 4, it can be seen that the new correlation (No. 8) gives a much better prediction for gas-LBE two-phase flow in the bubble column case than any other correlations. For gas-Ga two-phase flow, the prediction performance of the new model ranks third among all of the correlations. When compared with correlation No. 6, although the new model is developed as the best fit of relatively few data points, it has the smallest mean relative error, and the effect of liquid velocity and a void fraction (which generally increase with rising superficial gas velocity) on distribution parameter is considered. In addition, the gas-Ga test data are used for fitting to get the correlation. However, the applicability should be further evaluated beyond the range of 0 < jg<0.4 m/s and α ≤ 0.3. Therefore, the conclusion proposed by Clark’s study that C0 assumes very high values at a low net flow rate can be verified, as shown in Figure 15.
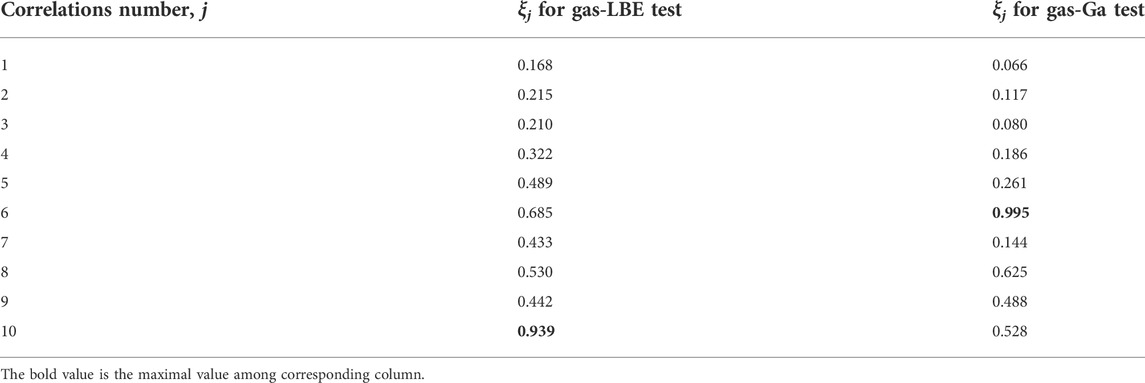
TABLE 4. Comparison of the predicted performance of all of the correlations, in terms of the benchmark coefficient ξj.
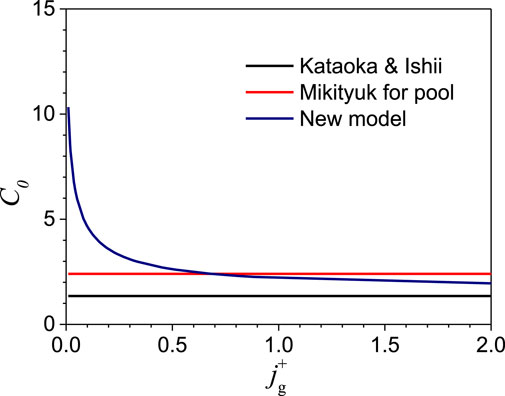
FIGURE 15. The effect of void fraction on distribution parameter considered in each correlation (JNC & KyotoU test).
The drift-flux model is very important for gas-liquid two-phase flow analysis in the safety evaluation of an advanced nuclear system during an accident process. To study the bubble column-type gas-liquid lead-bismuth two-phase flow phenomenon, nine existing drift-flux type correlations are reviewed and evaluated. Based on one-dimensional theory analysis, the distribution parameter is estimated and the effect is quantitatively discussed. A new correlation is then developed. The obtained conclusions and prospects are as follows:
1) To predict the void fraction in a bubble column-type gas-liquid heavy metal two-phase flow, the evaluation result based on the data from JNC & KyotoU and Saito’s test shows that only Mikityuk’s correlation for pool-type flow and Shen’s correlation for low wettability wall give relatively good prediction among the nine correlations. In Mikityuk’s model, the distribution parameter is assumed to be a constant, the applicability of which can be further evaluated under a wider parameter range.
2) The analysis result based on Clark’s theoretical model shows that the distribution parameter assumes very high values at a low Re number. As the Froude number increases, the distribution parameter tends to decrease. At lower void factions, the distribution parameter is also assumed to be a high value. This indicates that the pipe size, flow rate, and void fraction can all influence distribution parameter.
3) Considering the quantitative laws of the influence factors obtained by theoretical analysis and fitting the data of Ariyoshi’s test, a new correlation for bubble column-type gas-LBE two-phase flow is developed and evaluated with JNC & KyotoU and Saito’s test. The statistical analysis result shows that the new correlation gives the best prediction for gas-LBE two-phase flow in the void fraction range of 0.018–0.313.
In future work, a separated effect test of the gas-LBE bubble column in which the void fraction and liquid velocity along the radius are accurately measured is necessary to further verify or modify the initial assumption of the void-fraction profile in the existing theoretical analysis. In addition, an experiment with an extended range of void fractions and Froude numbers is required.
The original contributions presented in the study are included in the article/supplementary material, and further inquiries can be directed to the corresponding author.
DW: methodology, coding, writing-original draft. XL: conceptualization, methodology, supervision. SQ: conceptualization, methodology, supervision. RL: analysis and writing-original draft. ZL: literature survey, proofread, and modification. YO: proofread and modification.
The authors declare that the research was conducted in the absence of any commercial or financial relationships that could be construed as a potential conflict of interest.
All claims expressed in this article are solely those of the authors and do not necessarily represent those of their affiliated organizations, or those of the publisher, the editors, and the reviewers. Any product that may be evaluated in this article, or claim that may be made by its manufacturer, is not guaranteed or endorsed by the publisher.
Abbs, T., and Hibiki, T. (2019). One-dimensional drift-flux correlation for vertical upward two-phase flow in a large size rectangular channel. Prog. Nucl. Energy 110, 311–324. doi:10.1016/j.pnucene.2018.09.023
Ariyoshi, G., Inatomi, R., Ito, D., and Saito, Y. (2017). Effect of wall wettability condition on drift-flux parameters in lead-bismuth two-phase flow in circular and annular bubble columns. J. Nucl. Sci. Technol. 55, 239–253. doi:10.1080/00223131.2017.1394230
Clark, N. N., Flemmer, R., and Atkinson, C. (1987). Turbulent circulation in bubble columns. AIChE J. 33, 515–518. doi:10.1002/aic.690330321
Clark, N. N., and Flemmer, R. (1985). Predicting the holdup in two-phase bubble upflow and downflow using the Zuber and Findlay drift-flux model. AIChE J. 31, 500–503. doi:10.1002/aic.690310323
Clark, N. N., Van Egmond, J. W., and Nebiolo, E. (1990). The drift-flux model applied to bubble columns and low velocity flows. Int. J. Multiph. Flow 16 (2), 261–279. doi:10.1016/0301-9322(90)90058-q
Han, X., Shen, X., Yamamoto, T., Nakajima, K., and Hibiki, T. (2020). Drift-flux correlation for upward gas-liquid two-phase flow in vertical rod bundle flow channel. Int. J. Heat Mass Transf. 162, 120341. doi:10.1016/j.ijheatmasstransfer.2020.120341
Hibiki, T., and Ishii, M. (2002). Distribution parameter and drift velocity of drift-flux model in bubbly flow. Int. J. Heat Mass Transf. 45, 707–721. doi:10.1016/s0017-9310(01)00195-8
Hibiki, T., and Ishii, M. (2003). One-dimensional drift–flux model for two-phase flow in a large diameter pipe. Int. J. Heat Mass Transf. 46, 1773–1790. doi:10.1016/s0017-9310(02)00473-8
Hibiki, T., Saito, Y., Mishima, K., Tobita, Y., Konishi, K., and Matsubayashi, M. (2000). Study on flow characteristics in gas-molten metal mixture pool. Nucl. Eng. Des. 196, 233–245. doi:10.1016/s0029-5493(99)00293-9
Hills, J. H. (1976). The operation of a bubble column at high throughputs. Chem. Eng. J. 12, 89–99. doi:10.1016/0300-9467(76)87002-5
Ishii, M. (1977). One-dimensional drift-flux model and constitutive equations for relative motion between phases in various two-phase flow regimes. ANL- 77-47.
Kataoka, I., and Ishii, M. (1987). Drift flux model for large diameter pipe and new correlation for pool void fraction. Int. J. Heat Mass Transf. 30 (9), 1927–1939. doi:10.1016/0017-9310(87)90251-1
Kocamustafaogullari, G., and Ishii, M. (1985). “Maximum fluid particle size for bubbles and drops,” in Proceedings of Fundamental Aspects of Gas-liquid Flows, FED-Vol. 29, ASME Winter Annual Meeting, Miami Beach, Florida, USA, 17-21 Nov 1985, 99–107.
Levy, S. (1963). Prediction of two phase pressure drop and density distribution from mixing length theory. J. Heat Transf. 85 (2), 137–150. doi:10.1115/1.3686033
Mikityuk, K., Coddington, P., and Chawla, R. (2005). Development of a drift-flux model for heavy liquid metal/gas flow. J. Nucl. Sci. Technol. 42 (7), 600–607. doi:10.1080/18811248.2004.9726427
Pacio, J., Marocco, L., and Wetzel, T. H. (2015). Review of data and correlations for turbulent forced convective heat transfer of liquid metals in pipes. Heat. Mass Transf. 51, 153–164. doi:10.1007/s00231-014-1392-3
Saito, M., Sawada, T., Teraoka, Y., and Nezu, A. (1998). “Dispersion characteristics of gas-liquid two-phase pools,” in The 6th International Conference on Nuclear Engineering, May 10-14, 1998. ICONE-6118.
Schlegel, J., Hibiki, T., and Ishii, M. (2010). Development of a comprehensive set of drift-flux constitutive models for pipes of various hydraulic diameters. Prog. Nucl. Energy 52, 666–677. doi:10.1016/j.pnucene.2010.03.007
Shen, X., and Hibiki, T. (2020). Distribution parameter and drift velocity for upward gas-liquid metal two-phase flow. Appl. Therm. Eng. 184, 116242. doi:10.1016/j.applthermaleng.2020.116242
Shipley, D. G. (1984). Two phase flow in large diameter pipes. Chem. Eng. Sci. 39, 163–165. doi:10.1016/0009-2509(84)80143-8
Suzuki, T., Tobita, Y., Kondo, S., Saito, Y., and Mishima, K. (2003). Analysis of gas-liquid metal two-phase flows using a reactor safety analysis code SIMMER-III. Nucl. Eng. Des. 220, 207–223. doi:10.1016/s0029-5493(02)00349-7
Zuber, N., and Findlay, J. A. (1965). Average volumetric concentration in two-phase flow systems. J. Heat Transf. 87, 453–468. doi:10.1115/1.3689137
C0 distribution parameter
C∞ the asymptotic value of C0
D diameter of the flow channel (m)
Dh hydraulic diameter (m)
f function in new developed model
Fr Froude numberg
g ggravitational acceleration (9.8 m/s2)
g1 function in new developed model about Fr
g2 function in new developed model about Fr
g3 function in new developed model about Fr
Ga Galileo number
h function in new developed model about void fraction
j mixture volumetric flux (m/s)
jg gas superficial velocity(m/s)
jf liquid superficial velocity(m/s)
l mixing length (m)
N number of data points
Nτw non-dimensional wall shear stress
p exponent (in Clark’s model)
R radius of the flow channel
Re Reynolds number
r radial axis
r’ non-dimensional radius
U liquid velocity (m/s)
vg gas velocity (m/s)
vgj drift velocity of gas phase (m/s)
Wexp real liquid average velocity in test case(m/s)
Wf liquid average velocity(m/s)
X velocity in general non-dimensional equation
X1 fitting coefficient in new developed model
X2 fitting coefficient in new developed model
X3 fitting coefficient in new developed model
f liquid-phase
g gas-phase
c center of the tube
+ non-dimensional parameter
* non-dimensional parameter
α void fraction
εij the relative error of the jth correlation when predicting the ith data point
εRMSj the root-mean-square of the jth correlation
ξj benchmark coefficient
σ surface tension(N/m)
μ dynamic viscosity (Pa·s)
ρ density (kg/m3)
τ shear stress (N/m2)
τw wall shear stress (N/m2)
< > area-averaged quantity
<< >> void-fraction weighted mean quantity
Keywords: gas-LBE two-phase flow, drift-flux model, fast reactor, void fraction, bubble column
Citation: Wang D, Lu X, Qiu S, Liang R, Lin Z and Ouyang Y (2022) Development of drift-flux correlations for vertical forward bubble column-type gas-liquid lead-bismuth two-phase flow. Front. Energy Res. 10:964171. doi: 10.3389/fenrg.2022.964171
Received: 08 June 2022; Accepted: 27 June 2022;
Published: 22 August 2022.
Edited by:
Songbai Cheng, Sun Yat-sen University, ChinaCopyright © 2022 Wang, Lu, Qiu, Liang, Lin and Ouyang. This is an open-access article distributed under the terms of the Creative Commons Attribution License (CC BY). The use, distribution or reproduction in other forums is permitted, provided the original author(s) and the copyright owner(s) are credited and that the original publication in this journal is cited, in accordance with accepted academic practice. No use, distribution or reproduction is permitted which does not comply with these terms.
*Correspondence: Di Wang, d2FuZ2RpMjAyMEBjZ25wYy5jb20uY24=
Disclaimer: All claims expressed in this article are solely those of the authors and do not necessarily represent those of their affiliated organizations, or those of the publisher, the editors and the reviewers. Any product that may be evaluated in this article or claim that may be made by its manufacturer is not guaranteed or endorsed by the publisher.
Research integrity at Frontiers
Learn more about the work of our research integrity team to safeguard the quality of each article we publish.