 Yidi Zhang
 Hui Deng2,3
 Jiajia Yang
 Chengwei Xu
 Fushuan Wen
95% of researchers rate our articles as excellent or good
Learn more about the work of our research integrity team to safeguard the quality of each article we publish.
Find out more
ORIGINAL RESEARCH article
Front. Energy Res. , 22 July 2022
Sec. Smart Grids
Volume 10 - 2022 | https://doi.org/10.3389/fenrg.2022.963177
This article is part of the Research Topic Key Technologies, Markets, and Policies towards A Smart Renewables-Dominated Power System View all 13 articles
With the announcement of the carbon peaking and carbon neutrality target in China as well as the launch of the nationwide green power renewable generation trading, one of the key issues is how to design an effective renewable portfolio standard (RPS) and build an efficient tradable green certificate (TGC) market. The quota that stipulates the share of electricity supplied from qualified renewable energy (RE) sources has substantial impacts on the TGC market, the electricity market, and the occurred time of carbon emission peaking. However, few studies have been reported on effectively quantifying the impacts of quota variation. Given this background, this paper presents an innovative system dynamics (SD) model to evaluate the impacts of quota variation on the trading results of the TGC market and the trend of carbon emissions in China for the next decade. The proposed SD model takes factors such as the accommodating capability by the power system for RE generation, the policy-driven carbon emission reduction target as well as the decreasing fixed feed-in tariff (FIT) for RE generation as constraints for the first time. These factors are quantified in the constraints based on the current RE policies and market trading mechanism in China to improve the evaluation accuracy of the SD model. Using real-world data, simulations under various scenarios are carried out to validate the feasibility and efficiency of the proposed model. The methods for further improving the design of TGC market are also further explored, which are expected to effectively guide China to achieve the carbon peaking target.
Climate change is one of the major global challenges currently faced by most countries and governments in the world. In 2020, the Chinese government announced its carbon peaking and carbon neutrality target by the year 2030 and 2060 (the so-called “3,060” target) respectively to achieve a clean and low-carbon energy structure. One of the key measures to achieve the “3,060” target is the restructure of energy mix and the increase of the proportion of renewable energy (RE) generation. Therefore, RE will gradually become the main sources of power supply by replacing traditional fossil fuels. Moreover, the RE generation project in China has no longer been granted the feed-in tariff (FIT) from the central government since 2021 (Shayegh and Sanchez, 2021; Zhou and Solomon, 2021). A new series of policies related to the renewable portfolio standard (RPS) and tradable green certificate (TGC) will be developed for RE generators after ceasing the FIT scheme (Tu et al., 2020; Yang et al., 2021). However, the development of the TGC market and the electricity market is still in its infancy in China, and the RPS policy is still not well defined. The quota in the RPS policy stipulates the share of electricity supplied from qualified RE sources. In practice, the preset quotas in the RPS policy will affect the decision-making of participants in the electricity market and TGC market trading, and then impact the time of reaching carbon peaking in China (Tan et al., 2021). Therefore, setting an appropriate RPS quota and developing a TGC transaction mechanism by studying the dynamic development of RE will be of great significance for achieving the carbon emission target (Feng et al., 2021).
Currently, the TGC market in China is still in the cultivation period (Das et al., 2010; Kreikebaum et al., 2010). Aiming at establishing an effective TGC trading market, several regulations have been proposed by National Development and Reform Commission (NDRC) in China to improve the TGC market and RPS policy, as shown in Table 1. Although relevant policies have been put forward to clearly specify the responsible entities and quota implementation method under the RPS policy, these policies have not established a feasible TGC trading mechanism and an appropriate quota determination technique. Besides, considering China’s RPS policy and TGC market are still in their infancy, the lack of effective quota determination methods will reduce the operation efficiency of the TGC market, thus impede the willingness of responsible entities to trade in the TGC market (Li et al., 2019; Feng et al., 2022). All those would bring extra uncertainty for achieving the carbon peaking target. According to the data from the China Green Certificates Subscription Platform, the cumulative TGC transaction volume of wind power and photovoltaic accounts for only 1.1245% and 10.9850% of the total issued volume. In addition, the highest prices of TGC for wind power and photovoltaic are 382.3 yuan/piece and 872.8 yuan/piece respectively, which are much higher than the international average prices. It can be seen that without an effective method for determining the consumption responsibility weights, the current TGC market is inactive with a high TGC price and fails to promote RE consumption in a market-oriented way. As a result, the quota needs to be appropriately determined and the trading mechanism of the TGC market under RPS policy should be optimized to effectively guide the TGC transaction and thus promote low-carbon development.
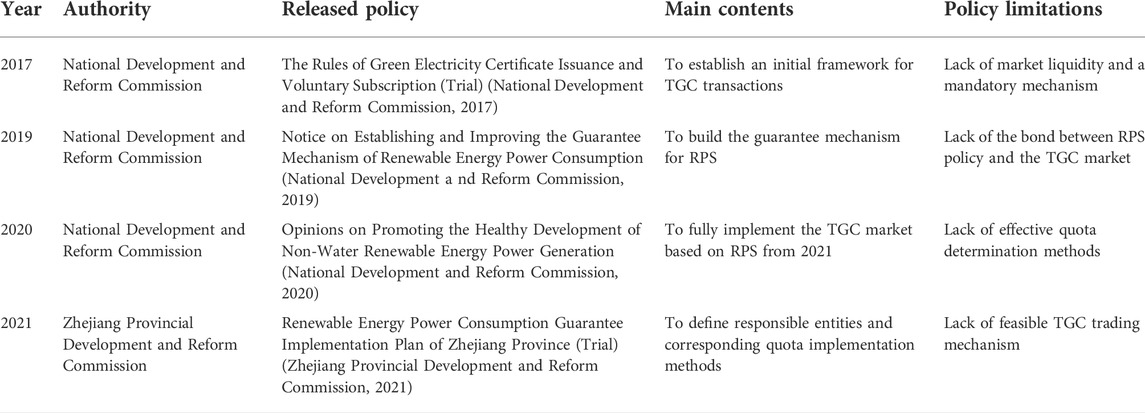
TABLE 1. Issued policies in renewable energy in China.
Meanwhile, existing research on the dynamic development of RE mainly focuses on the following aspects: 1) Investigating RE market systems that are appropriate for national conditions. After studying the incentive policies of RE in various countries, (Jiang et al., 2020), compares these mechanisms, and then puts forward the suggestion that China should promote the RPS in stages; Learning from the successful experience of the RPS policy in Texas, some policy recommendations for China are proposed in (Yang et al., 2011). 2) Studying the relationship between factors such as consumer costs of electricity and electricity price in the electricity market under the RPS. By using the National Energy Modeling System (NEMS), the impact of enforced RPS regulations on the US energy market and the power industry is analyzed in (Kydes, 2007). Studies in (Unger and Ahlgren, 2005) show that the RPS would reduce the prices of wholesale electricity and CO2-emission permits by simulating the electricity markets of Nordic countries. 3) Solving the optimization problem of RPS policy making and trading portfolio: Based on the IOS New England test system, a tri-level optimization model including a state regulator, a power utility, and a wholesale electricity market is proposed in (Kim et al., 2021) and used to analyze the impact of the incentive intensity of the RPS on policy making; A decision-making optimization model of the medium-and long-term electricity market considering the risk cost of RE generation is established in (Feng, 2020), and the best purchase plan of electricity is obtained for organizers.
The development of RE is closely related to a variety of factors such as electricity demand, electricity price, and profit margins that generators can obtain in the electricity industry. Besides, these factors can be further affected by the government’s energy policies. Therefore, the well-developed system dynamics (SD) model is applicable for the research. SD is a discipline that analyzes information feedback systems. It will dynamically simulate the changing process of each unit in the system according to the causal feedback of internal and external factors (Na ncy, 2012; Fetene Adane et al., 2019). Applications of the SD method in hydropower station dispatching, fossil fuel consumption, and other research directions are introduced in (Ebert, Freitag, Sperandio), showing the feasibility and diversity of this method in the electrical industry. However, there are few applications of this method in the field of energy at present. In (Koegelenberg and Pillay, 2015), the future power demand of the forestry and logging sector in South Africa is predicted by SD, and the impact of production lines and technical improvement on power demand is studied through sensitivity analysis. Ref. (Yang et al., 2006). employed the SD approach to model the evolution curve of variables in the California electricity market. Taking policies into account, the effects of different economic growth rates on carbon emissions and energy consumption in China are predicted based on SD in (Liu et al., 2015). The SD model of the electricity market and the TGC market are constructed in (Hasani-Marzooni and Hosseini, 2012) and applied to analyze the incentive effect on wind energy investment.
In general, the application of the SD method in existing research mainly focused on the evaluation and sensitivity analysis of RE proportion in the electricity market. However, the study of the TGC market under the RPS is still insufficient. First, the impact of the RPS policy on carbon emissions and the TGC market needs to be evaluated quantitatively. In existing research, the impact of green certificate quota on the dynamic evolution of TGC market and the electricity market has rarely been studied. Second, the constraints of the power systems in accommodating RE generation are not considered in the existing SD models, which may result in an overestimation of the generation capacity of RE. Third, the current policies in China are not studied sufficiently in existing publications, which makes it impossible to simulate the development of RE there accurately. To fill these knowledge gaps, the main significance and contributions of this paper are summarized as follows:
1) An elaborate curve of RPS quota value for the next decade and three policy recommendations are proposed, which can effectively help China construct the TGC market and achieve the carbon peaking targets.
2) A multi-agent SD model considering multiple types of complex factors is established to improve the assessment accuracy, based on the current RE policies and market trading mechanism in China. The formulated multi-agent SD model can evaluate the impact of quota variation on the trading result of the TGC market and the trend of carbon emissions in China comprehensively and concretely for the next decade.
3) Extensive numerical simulations using practical statistics of China are conducted to demonstrate the feasibility and efficiency of the proposed SD model and policy recommendations.
The rest of this paper is organized as follows: Section 2 constructs the causal loop and SD model to show the overall framework of TGC market and electricity market. Section 3 enumerates the precise data needed in the proposed model and discusses the simulation results of this study. Section 4 is the conclusion of the paper.
Based on the current status of RPS policy and TGC market in China, the formulation of the quota is the key to the effective operation of the RPS policy and corresponding TGC market. Take the Zhejiang Province as an example, under the RPS policy, the government established a series of policies defining responsible entities that are obliged to have quota and corresponding quota implementation methods (Yang et al., 2006). Specifically, the responsible entities are divided into two types. The first type is electricity retailers that supply or sell electricity directly to power end-users. The second type is large scale power users that directly take part in the wholesale electricity market and enterprises with self-provided power plants (Fan et al., 2021; Xu et al., 2021). Each type of the responsible entities can fulfill their demand of RPS quota in three ways: 1) by purchasing or self-providing RE power directly; 2) by subscribing to TGC (a unit of TGC corresponding to 1 MWh of RE consumption); 3) by inter-provincial transaction of excess consumption.
As observed from the practice in the Zhejiang Province, the quota will have an impact on the trading behavior and clearing results of the responsible entities in the power and the TGC markets. The quantitative evaluation of impacts needs to be thoroughly analyzed so as to better determine the policy that improves the RPS policy. The TGC market and the electricity market are linked with each other by shared elements existing in both markets, including the electricity price and electricity demand. Therefore, in this section, an electricity and TGC market-coupled trading SD model is developed to simulate the interactions between electricity and TGC markets as well as the impacts of the RPS policy on market trading results and carbon emissions.
The following assumptions are made when developing the electricity and TGC markets-coupled trading SD model.
1) The subject restricted by the RPS policy in this paper is electricity retailers, which are obliged to purchase a certain percentage of electricity from RE generators.
2) One unit of TGC represents 1000 kWh of electricity generated by RE, and it is the same for all RE generation technologies.
3) Since the subsidized RE projects have already been rewarded for their environmental values by their FIT, the subsidized RE projects are not allowed to participate in the TGC transaction, but they still account for green energy generation.
4) Wind power and photovoltaic generation are selected as the representatives of RE generation technologies.
According to the analysis of the current RPS policy and TGC market in China as well as the assumptions in section 2.1, the causal loop model of the electricity and TGC market-coupled trading is shown in Figure 1. The causal loop model is a method to iconically describe the information feedback of internal and external factors, and the causal loop is widely adopted in the SD model to evaluate the trend of electricity market.
1)TGC Market
The TGC market is presented on the right side of Figure 1.
a) Loop-1 in the TGC market: RE generation →(+) TGC held by RE plants →(+) desired sales →(-) excess demand for TGC →(+) TGC price →(+) RE starting construction →(+) installed capacity of RE; TGC price →(+) desired sales
In the TGC market, the RPS policy encourages RE generators to compensate for the economic losses caused by FIT reduction via selling the TGC. Specifically, the TGC issued by the government will be sent to the RE generators based on their generating capacity. Then the RE generators will sell the TGC in the TGC market, and thus the TGC’s sales volume will be increased. After that, the excess demand for TGC in the market will decrease, which will have a negative effect on the TGC price based on the typical supply-demand relationship. Consequently, due to the decreased excess demand for TGC, the TGC price will be reduced and the profits that RE generators can obtain from selling TGC will be cut down. Since the investment willingness of RE generators is closely related to the profit margin that these generators can get in the TGC market, the investment of RE generators will be reduced. The above process will gradually reduce the number of newly installed RE generators.
b) Loop-2 in the TGC market: TGC held by RE plants →(+) TGC held by electricity retailers →(-) desired purchases →(+) excess demand for TGC→(+) TGC price →(+) RE starting construction →(+) installed capacity of RE →(+) RE generation; quota ratio →(+) TGC turned in for RPS →(-) TGC held by electricity retailers; TGC price →(-) desired purchases; electricity demand →(+) TGC turned in for RPS
The output of RE generators is positively correlated with the number of TGC available to electricity retailers. In the proposed SD model, the number of TGC owned by electricity retailers is defined as the difference between the number of TGC bought from RE generators and the number of TGC that is required to be submitted based on the predetermined quota. If the submitted TGC is decreased, the TGC owned by the electricity retailers will be lifted. Moreover, the increased TGC owned by electricity retailers will cut down their demand in the TGC market, which will further reduce the TGC price and finally cut down the number of newly installed RE generators.
2)Electricity Market
The electricity market is on the left side of Figure 1.
a) Loop-1 in the electricity market: electricity demand →(+) excess demand for electricity →(+) electricity price →(+) TE starting construction →(+) installed capacity of TE →(+) TE generation →(+) electricity supply →(-) excess demand for electricity
In the electricity market, the excess demand for electricity will be increased due to the economic development. The increase in excess demand for electricity will lead to rising electricity prices and the growth of profits for traditional energy (TE) generators, which will further result in an increase in installed generating capacity and total electricity generation. Finally, the increase in electricity supply will in turn cut down the electricity excess demand.
b) Loop-2 in the electricity market: policy restriction →(-) TE starting construction
For China, in order to achieve the target of carbon peaking in 2030, the growth rate of installed construction of TE generators will gradually slow down in the future, and its construction volume will be determined not only by the profit space of TE generators but also by the policy constraints. Considering the limitation of the carbon peaking target, the carbon emission constraint is added to the installed capacity of TE generators in the proposed SD model.
3)Interaction Between the Two Markets
The interaction between the two markets is highlighted by the dotted line in Figure 1.
Loops of interactions: TE generation →(+) RE generation; RE generation →(+) electricity supply; With the expanded integration scale of RE, the fluctuation and randomness of RE have a significant impact on the safe operation of power system. In this context, the fluctuation of renewable power supply will become the main source of system uncertainty. In practice, the power generation of RE will be constrained by power grid dispatching and planning (Al-Shetwi et al., 2020; Lei et al., 2020). Considering that the power system’s capacity to consume RE is limited, the growth of RE generation will be constrained by the system’s capability to consume RE. The above constraints are considered in the proposed model.

FIGURE 1. Illustration of the constructed causal loops.
According to the causal loop, the SD model of market-coupled trading can be obtained based on the operation characteristics of electricity market and TGC market, as shown in Figure 2. Factors in Figure 1 is subdivided into several detailed factors, and the corresponding relationship between the causal loop and SD model is shown in Table 2. The function and logical relationships between the subjects are also determined to illustrate the operation mechanism of the market-coupled trading model, as presented in sections 2.3.1, 2.3.2.
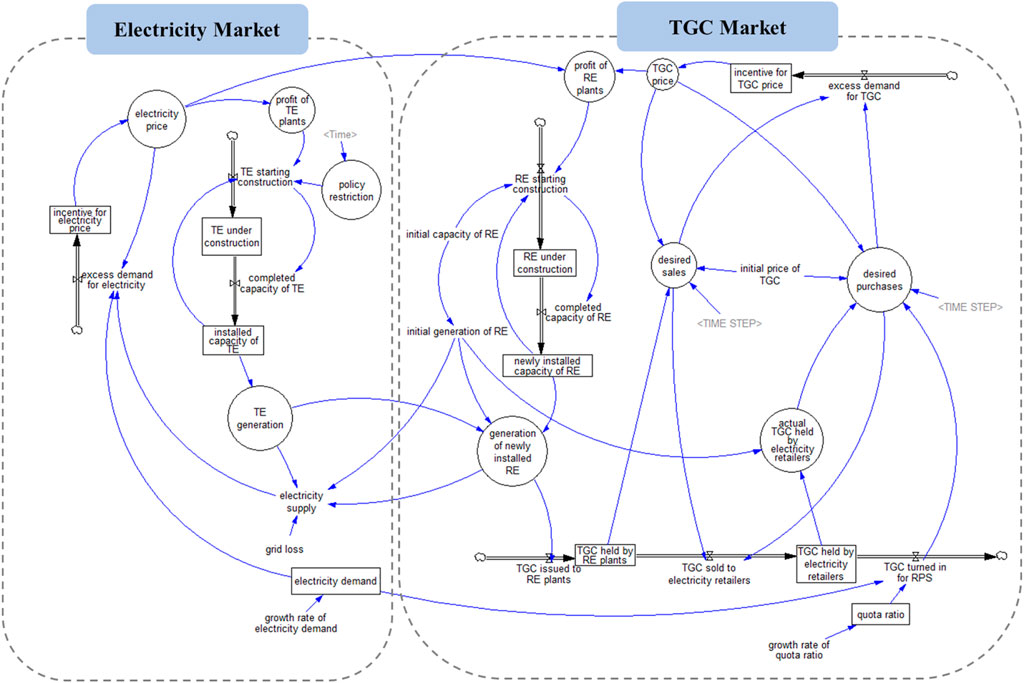
FIGURE 2. Illustration of the developed SD model.
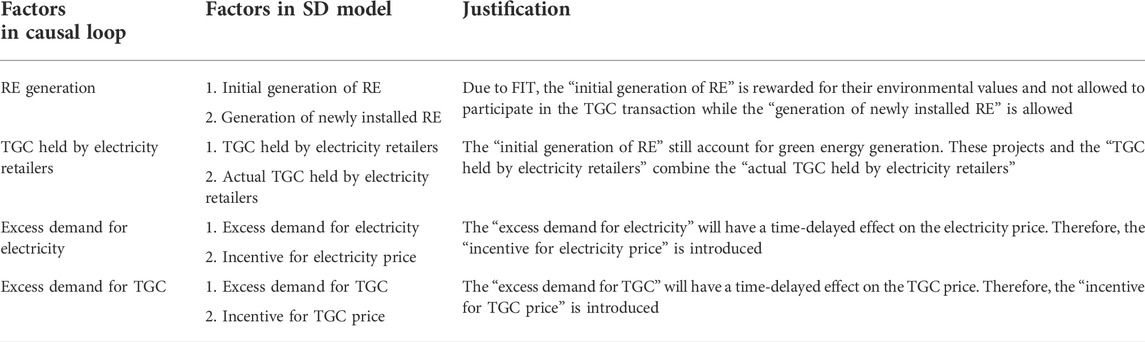
TABLE 2. The corresponding relationship between the causal loop and SD model.
1) TGC price constraints:
In the TGC market, the TGC price is affected by the excess demand for TGC and obtained from the incentive for TGC price through the smooth function. In detail, the excess demand for TGC is collectively determined by the desired purchases and the desired sales of TGC, which depend on the amount of TGC held by electricity retailers and RE plants respectively. According to Assumption 3, the electricity of subsidized RE generators can be converted into the corresponding quantity of TGC. The quantitative relationships between the mentioned variables are given by Eqs 1–3.
where
2) Accommodating RE constraints:
The amount of completed installed capacity of RE is determined by the amount of RE capacity at the beginning of construction through the delay function. Due to the constraints on the ability of the system to integrate RE, the amount of newly installed RE generation is restricted by the amount of TE generation. The specific equations are shown in Eqs 4–6.
where
3) RPS quota constraints:
The quota of RPS is gradually increasing under the influence of the growth rate, and the growth speed is increasing by degrees. The calculation method is shown in Eq. 7.
where
1) Electricity price constraints:
As for the electricity market, the electricity price is affected by the excess demand for electricity and obtained from the incentive for electricity price through the smooth function, which is shown in Eqs 8, (9).
where
2) Relevant policy constraints:
The amount of completed installed capacity of TE is determined by the amount of TE capacity at the beginning of construction through the delay function. Moreover, in order to achieve the target of carbon peaking, policy will be proposed to constrain the construction of TE. The constraint of policy-driven carbon emission reduction target on the amount of TE capacity at the beginning of construction are shown in Eqs 10–13.
where
To enhance the accuracy and credibility of the simulation, the key parameters of the model are from the actual power system operation of Zhejiang Province in 2020, as shown in Table 3. Vensim PLE is used to simulate the SD model. Combined with the actual situation of Zhejiang Province, the simulation cycle is assumed from 2021 to 2030, and the step length is 1 month. The growth rate of electricity demand is estimated based on the average annual growth rate of Zhejiang Province. Meanwhile, the initial value of the RPS quota is determined as 20% based on the target of carbon peaking and the actual situations in Zhejiang Province.
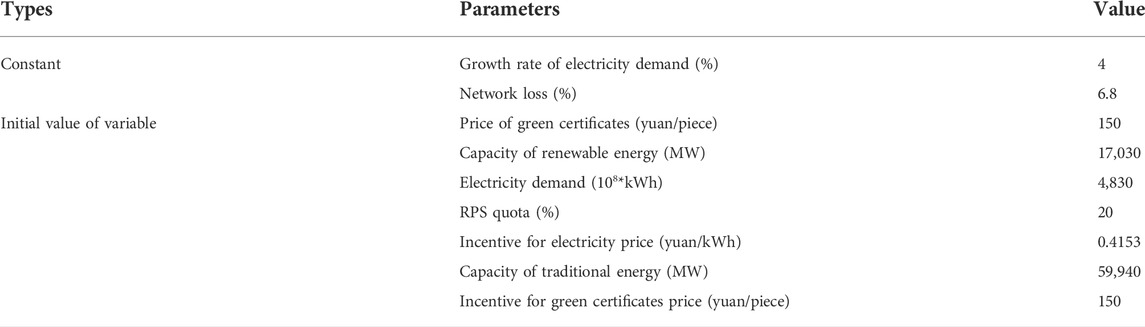
TABLE 3. Specification of key parameters in the simulation.
Determining the appropriate quota is the key to ensure that the TGC market comes into effect under the RPS policy. Furthermore, appropriate quotas will encourage an increase in non-fossil energy consumption (Xin-gang et al., 2020; Yu et al., 2021). In order to research the impact of different quotas on the TGC market and electricity market, three scenarios of high (0.008), medium (0.006), and low (0.004) growth rates are set to simulate the interaction mechanism and development tendency by the SD model. The specific curves of the RPS quota from 2020 to 2030 under three scenarios are shown in Figure 3. Three curves rise at different speeds and reach the highest points of 29%, 41%, and 59% by 2030 respectively.
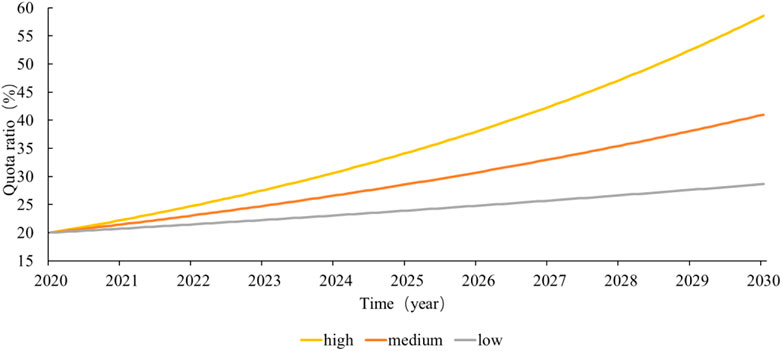
FIGURE 3. RPS quotas under three scenarios.
Through analyzing the variation trend of energy structure under three different quota curves given in Figure 3, it is found that the quota curve under the medium growth rate best meets the requirements of the energy development plan of Zhejiang Province in 2025 (Zhejiang Provincial Development and Reform Commission, 2021). As a result, the following study is conducted under the medium growth rate quota curve.
1) Impacts of RPS on the energy structure
By comparing the simulation results of energy structure change tendency under different scenarios, a series of RPS quotas of medium growth rate is proposed to meet the requirements of “The 14th Five-Year Plan for Renewable Energy Development in Zhejiang Province” (Zhejiang Provincial Development and Reform Commission, 2021). The growth tendency of the energy structure and power generation of RE and TE from 2021 to 2030 is shown in Figure 4.
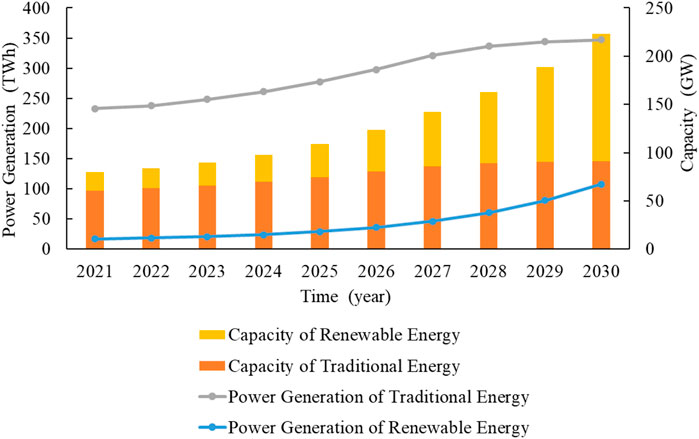
FIGURE 4. Energy structure and power generation.
Figure 4 shows that the capacity of TE and RE will reach 74.6942 and 34.3033 GW respectively in 2025, which approaches the estimated data of thermal power (74.62 GW) and the capacity of non-water RE (34.30 GW) based on the RE development plan of Zhejiang Province in 2025 (Zhejiang Provincial Development and Reform Commission, 2021). The installed capacity and the power generation of TE will be increased in 2021–2027. However, due to the restriction imposed by the RPS policy, the newly installed capacity of TE will be substantially reduced from 2027. As a result, the total capacity of TE is stable at 91 GW and the annual TE power generation stabilizes at 347 TWh. Meanwhile, the installed capacity of RE is increasing annually, and by 2029 the installed capacity of RE will exceed that of TE. In 2030, the total installed capacity of RE reaches 132 GW and the annual RE power generation reaches 108 TWh. It can be concluded from Figure 4 that the TGC market and RPS policy will promote the optimization of energy structures in Zhejiang Province.
2) Impacts of RPS on carbon emissions
The quota of RPS has an effect on the development of RE and further influences the volume of carbon emissions. In order to analyze the variation of carbon emissions under different growth rates and evaluate the time of carbon peaking, three different scenarios are simulated in this subsection.
According to the data of the China Electricity Council (CEC), in 2020, the amount of carbon dioxide emissions per unit of thermal generation is about 832 g/kWh. Meanwhile, the exploitation and development of RE is a replacement of TE, which brings a decline in carbon dioxide emissions. When the monthly carbon emission of traditional energy is greater than the monthly carbon emission reduction of renewable energy, the carbon emission of the power system is in a growth period, and the carbon dioxide emission gradually increases. The carbon peaking target of the power system will be achieved when the carbon emission of TE equals to the carbon emission reduction of RE. The trends of carbon emissions under different RPS quotas are shown in Figure 5.
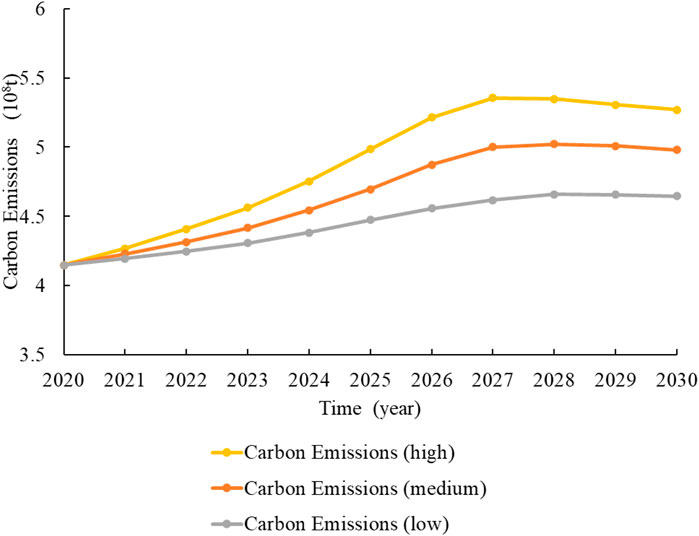
FIGURE 5. Carbon emissions under three scenarios.
In addition to the power generation, carbon emissions also come from steel, cement, chemical industry, crude oil refining and other sources. As a result, the carbon peaking time of the power system obtained from the simulation is earlier than 2030. As shown in Figure 5, the increased growth rate will enhance carbon emission reduction. In addition, it can be seen that the carbon peaking time under different scenarios varies from 2026 to 2028, and the high growth rate will help achieve the carbon peaking target in advance. Meanwhile, in the case of the medium growth rate, the time of carbon peaking is in the first quarter of 2027 when the volume of carbon emissions reaches 5.02*108 t. Figure 5 indicates that the implementation of TGC and RPS could reduce carbon emissions and advance the time of carbon peaking.
3) Impacts of RPS on TGC prices
The tendencies of TGC prices under different scenarios are simulated through the SD model, as shown in Figure 6.
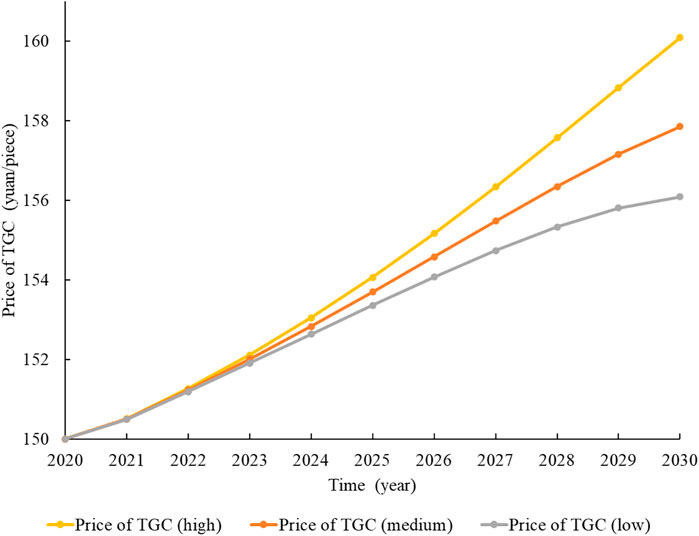
FIGURE 6. TGC prices under three scenarios.
As can be seen from Figure 6, the TGC price keeps on rising from 2020 to 2030. In addition, there is a positive correlation between the quota growth rate and the growth rate of the TGC price. According to the price-demand relationship, an increase in TGC price will reduce the purchase demand of buyers, limiting the transaction scale of the TGC market. However, considering that the TGC market aims to stimulate the development of RE through market-oriented transactions rather than FIT, the limited transaction scale caused by the continuous rise of TGC prices will not be conducive to RE development (Zhao et al., 2019; Li et al., 2020). Considering the current situation in China, the TGC prices in China are much higher than the international average. In addition, for the responsible entities in Chinese enterprises, they still have insufficient understanding of the TGC market and are highly sensitive to the TGC price. Therefore, reducing the TGC price will promote the TGC trading and activate the TGC market in China, which will further help promote the development of China’s RE industry.
To encourage the efficient use of RE, targeted improvements to the system of TGC transactions are proposed from three aspects (Heimvik and Amundsen, 2021). The TGC prices of the improved system and the original price are shown in Figure 7:
1) Improvement of TGC trading rules
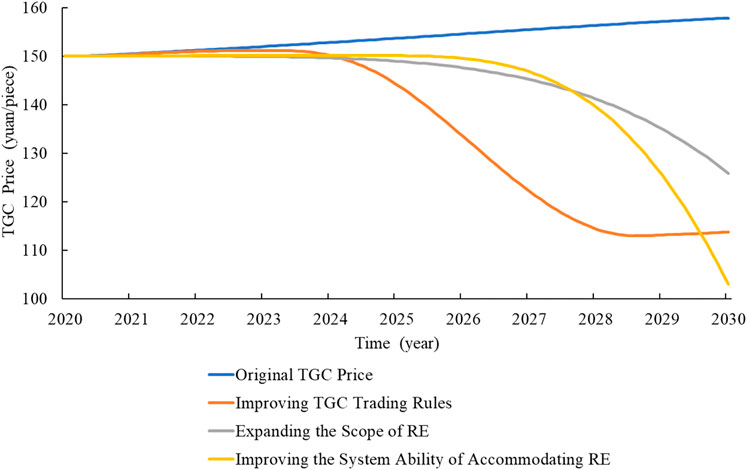
FIGURE 7. TGC prices under different scenarios.
By adjusting the relevant parameters in the process of TGC trading, the changing trend of the TGC price under the improvement of trading rules is simulated. Compared with the original TGC price, the TGC price under the trading rules maintains a similar growth trend during the initial years as shown in Figure 7. However, the price will start to decrease in 2024, and will reach 113 yuan/piece in 2028 and then remain stable. The TGC price reduction brought by the improved trading rules will increase the total TGC trading volume and enhance the transaction efficiency.
In this paper, the improvement of TGC trading rules is realized by the expansion of the desired sales and desired purchases. For the practical TGC market, several suggestions are given to increase the desired sales and desired purchases. Firstly, the secondary market for TGC should be established. According to the existing rules, TGC has no right to conduct a secondary sale after the transaction. Therefore, the secondary TGC market improves the currency of the TGC and reduces the TGC price in a market-oriented way. Besides, a more comprehensive information system should be added to the TGC markets. By displaying detailed transaction information such as TGC trading volume and clearing TGC price in the transaction system, the transparency of the TGC market can be improved. Furthermore, the government can simplify the application and issuance mechanisms of TGC to improve the transaction efficiency of the TGC market.
2) Expanding the scope of RE
As is shown in Figure 7, the TGC price, after expanding the scope of issuance, shows a downward trend annually. Specifically, from 2020 to 2025, the reduction of the TGC price is insignificant. After 2026, the decline of TGC price becomes more and more significant, and it will reach 126 yuan/piece (20% decrease) in 2030. Consequently, expanding the application scope of TGC and increasing the number of traded TGC in the TGC market will decline the TGC prices. Meanwhile, there are few types of RE applicable to TGC in China, including only onshore wind and centralized photovoltaic generation projects that are on the FIT list or sold at regulated prices. With the continuous development of RE, the application scope of TGC should be further expanded to allow more RE projects to participate in TGC trading.
3) Improvement of the system capability of accommodating RE
Since the output of RE has strong uncertainty, the increasing proportion of RE in the power system requires the cooperation of flexible generators and the participation of demand response to realize the interaction of energy, information, and transaction on both supply and demand sides.
It can be seen from Figure 6 that improving the consumption capacity of the power system can reduce the TGC price. From 2020 to 2026, the prices increase slightly due to the delay effect of the implementation of new policies and engineering construction. From 2026 to 2030, the TGC prices will be significantly reduced due to the improvement in the consumption capacity of the system, and will drop to 103 yuan/piece in 2030. Therefore, in the face of a high RE proportion in the power system, it is necessary to improve the system’s capability to consume RE and promote its development.
In the practical power system, the way to improve the system’s capability in accommodating RE, such as transmission channel construction and auxiliary service device investment, will have a positive effect on the TGC market’s development. However, considering both the cost of the above construction and the benefit brought by the TGC market, the reasonable improvement degree needs to be determined.
The implementation of the TGC market based on RPS policy has a significant impact on the development of RE and the achievement of the carbon peaking target. In this paper, a SD model considering multiple types of complex factors is established to construct a market-coupled trading system. Compared with existing algorithms and models, the proposed SD model is innovative by integrating constraints on the system RE integrating capability, the policy-driven carbon emission reduction target, as well as the decreasing fixed FIT for RE. These factors are quantified in the constraints based on the current RE policies and market trading mechanism in China to improve the evaluation accuracy of the SD model. Then, the tendencies of key elements and the volume of carbon emissions from 2021 to 2030 are simulated based on the actual statistics of China. The evolution processes of energy structure, carbon emission and the TGC price are simulated and analyzed under multiple scenarios. Finally, an elaborate curve of RPS quota value for the next decade and policy recommendations on the mechanism of TGC market are proposed from three aspects, which is a useful guideline for China to construct the TGC market and achieve the carbon peaking targets. Based on the proposed model and simulation results, there are still some problems that need to be studied in the future, which are listed as follows: 1) In order to simulate the changing trend of electricity prices more accurately, the electricity market could be further broken down into the spot market and the forward market in the electricity and TGC market-coupled trading SD model. 2) Considering the differences in construction cycles and costs between different types of RE technologies, the unit power generation of different types of RE technologies should be quantified into different numbers of TGCs.
The original contributions presented in the study are included in the article/supplementary material, further inquiries can be directed to the corresponding author.
YZ, HD, and CX conceptualized the study. HD, JY, and CX performed the analysis. YZ, JY, CX, and DQ performed investigations. HD and ZZ acquired resources. HD, CX, and ZZ acquired funding. YZ wrote the original draft. JY, CX, and FW reviewed and edited the manuscript. All authors agreed to be accountable for the content of the work.
The authors declare that this study received funding from a Science and Technology Project of State Grid Zhejiang Electric Power Co., Ltd. (No. B311DS21000A). The funder had the following involvement in the study: HD and CX conceptualized the study and performed the analysis. CX performed investigations. HD and ZZ acquired resources. HD, CX, and ZZ acquired funding. CX reviewed and edited the manuscript.
Authors HD, CX, and ZZ are employed by State Grid Zhejiang Electric Power Co., Ltd., Research Institute and State Grid Zhejiang Electric Power Co., Ltd., Power Market Simulation Laboratory.
The remaining authors declare that the research was conducted in the absence of any commercial or financial relationships that could be construed as a potential conflict of interest.
All claims expressed in this article are solely those of the authors and do not necessarily represent those of their affiliated organizations, or those of the publisher, the editors and the reviewers. Any product that may be evaluated in this article, or claim that may be made by its manufacturer, is not guaranteed or endorsed by the publisher.
Al-Shetwi, A. Q., Hannan, M. A., Jern, K. P., Mansur, M., and Mahlia, T. M. I. (2020). Grid-connected renewable energy sources: Review of the recent integration requirements and control methods. J. Clean. Prod. 253, 119831. doi:10.1016/j.jclepro.2019.119831
Das, D., Kreikebaum, F., Divan, D., and Lambert, F. (2010). “Reducing transmission investment to meet renewable portfolio standards using Smart wires,” in IEEE PES T&D 2010, New Orleans, LA, 1–7. doi:10.1109/TDC.2010.5484217
Ebert, P., Freitag, S., and Sperandio, M. (2017). “Applications of system dynamics in the electrical sector,” in 2017 52nd international universities power engineering conference, Heraklion, Greece, 1–6. doi:10.1109/UPEC.2017.8231899
Fan, J.-L., Wang, J.-X., Hu, J.-W., Yang, Y., and Wang, Y. (2021). Will China achieve its renewable portfolio standard targets? an analysis from the perspective of supply and demand. Renew. Sustain. Energy Rev. 138, 110510. doi:10.1016/j.rser.2020.110510
Feng, C., Liang, B., Li, Z., Liu, W., and Wen, F. (2022). “Peer-to-Peer energy trading under network constraints based on generalized fast dual ascent,” in IEEE trans. Smart grid, 1–12. doi:10.1109/tsg.2022.3162876
Feng, T.-t., Li, R., Zhang, H.-m., Gong, X.-l., and Yang, Y.-s. (2021). Induction mechanism and optimization of tradable green certificates and carbon emission trading acting on electricity market in China. Resour. Conservation Recycl. 169, 105487. doi:10.1016/j.resconrec.2021.105487
Feng, Y., Fan, J., Jiang, Y., Li, X., Li, T., Gao, C., et al. (2020). “Optimal trading strategy of inter-and intra-provincial medium-and long-term power exchange considering renewable portfolio standard.” in 2020 12th IEEE PES Asia-Pacific Power and Energy Engineering Conference, Nanjing, China, 1–5. doi:10.1109/APPEEC48164.2020.9220555
Fetene Adane, T., Bianchi, M. F., Archenti, A., and Nicolescu, M. (2019). Application of system dynamics for analysis of performance of manufacturing systems. J. Manuf. Syst. 53, 212–233. doi:10.1016/j.jmsy.2019.10.004
Hasani-Marzooni, M., and Hosseini, S. H. (2012). Dynamic interactions of TGC and electricity markets to promote wind capacity investment. IEEE Syst. J. 6 (1), 46–57. doi:10.1109/jsyst.2011.2162891
Heimvik, A., and Amundsen, E. S. (2021). Prices vs. percentages: Use of tradable green certificates as an instrument of greenhouse gas mitigation. Energy Econ. 99, 105316. doi:10.1016/j.eneco.2021.105316
Jiang, Y., Cao, H., Yang, L., Fei, F., Li, J., and Lin, Z. (2020). Mechanism design and impact analysis of renewable portfolio standard. Automation Electr. Power Syst. 44 (07), 187–199. doi:10.7500/AEPS20190602001
Kim, J., Bialek, S., Unel, B., and Dvorkin, Y. (2021). Strategic policymaking for implementing renewable portfolio standards: a tri-level optimization approach. IEEE Trans. Power Syst. 36 (6), 4915–4927. doi:10.1109/tpwrs.2021.3078726
Koegelenberg, T., and Pillay, N. S. (2015). A system dynamics approach to simulating the electricity demand for the South African forestry & logging sector,” in International Conference on the Industrial and Commercial Use of Energy (ICUE), Cape Town, South Africa, 84–88. doi:10.1109/ICUE.2015.7280251
Kreikebaum, F., Das, D., and Divan, D. (2010). “Reducing transmission investment to meet renewable portfolio standards using controlled energy flows,” in IEEE Innovative Smart grid technologies (ISGT), Gaithersburg, MD, 1–8. doi:10.1109/ISGT.2010.5434726
Kydes, A. S. (2007). Impacts of a renewable portfolio generation standard on US energy markets. Energy Policy 35 (2), 809–814. doi:10.1016/j.enpol.2006.03.002
Lei, G., Song, H., and Rodriguez, D. (2020). Power generation cost minimization of the grid-connected hybrid renewable energy system through optimal sizing using the modified seagull optimization technique. Energy Rep. 6, 3365–3376. doi:10.1016/j.egyr.2020.11.249
Li, X., Wang, W., Wang, H., Wu, J., Fan, X., Xu, Q., et al. (2020). Dynamic environmental economic dispatch of hybrid renewable energy systems based on tradable green certificates. Energy 193, 116699. doi:10.1016/j.energy.2019.116699
Li, Z., Wang, C., Ye, X., Li, Y., and Lei, X. (2019). “Evaluation of renewables portfolio standards trading volume and analysis of influencing factors,” in 2019 Chinese automation congress (CAC), Hangzhou, China, 3897–3900. doi:10.1109/CAC48633.2019.8997379
Liu, X., Mao, G., Ren, J., Li, R. Y. M., Guo, J., and Zhang, L. (2015). How might china achieve its 2020 emissions target? a scenario analysis of energy consumption and CO2 emissions using the system dynamics model. J. Clean. Prod. 103, 401–410. doi:10.1016/j.jclepro.2014.12.080
Nancy, G. L. (2012). “A brief introduction to system dynamics modeling,” in Engineering a safer world: Systems thinking applied to safety (MIT Press), 517–519.
National Development and Reform Commission, (2019). Notice on establishing and improving the guarantee mechanism of renewable energy power consumption. Available online at: http://zfxxgk.nea.gov.cn/auto87/201905/t20190515_3662.htm.(accessed on April 20, 2022).
National Development and Reform Commission, (2020). Opinions on promoting the healthy development of non-water renewable energy power generation. Available online at: http://www.gov.cn/zhengce/zhengceku/2020-02/03/content_5474144.htm.(accessed on April 20, 2022).
National Development and Reform Commission, (2017). The Rules of green electricity certificate Issuance and voluntary subscription (trial). Policy. Available online at: http://www.nea.gov.cn/2017-02/06/c_136035626.htm.(accessed on April 20, 2022).
Shayegh, S., and Sanchez, D. L. (2021). Impact of market design on cost-effectiveness of renewable portfolio standards. Renew. Sustain. Energy Rev. 136, 110397. doi:10.1016/j.rser.2020.110397
Tan, Q., Ding, Y., Zheng, J., Dai, M., and Zhang, Y. (2021). The effects of carbon emissions trading and renewable portfolio standards on the integrated wind–photovoltaic–thermal power-dispatching system: real case studies in china. Energy 222, 119927. doi:10.1016/j.energy.2021.119927
Tu, Q., Mo, J., Betz, R., Cui, L., Fan, Y., Liu, Y., et al. (2020). Achieving grid parity of solar PV power in China- the role of tradable green certificate. Energy Policy 144, 111681. doi:10.1016/j.enpol.2020.111681
Unger, T., and Ahlgren, E. O. (2005). Impacts of a common green certificate market on electricity and CO2-emission markets in the nordic countries. Energy Policy 33 (16), 2152–2163. doi:10.1016/j.enpol.2004.04.013
Xin-gang, Z., Pei-ling, L., and Ying, Z. (2020). Which policy can promote renewable energy to achieve grid parity? feed-in tariff vs. renewable portfolio standards. Renew. Energy 162, 322–333. doi:10.1016/j.renene.2020.08.058
Xu, J., Lv, T., Hou, X., Deng, X., and Liu, F. (2021). Provincial allocation of renewable portfolio standard in china based on efficiency and fairness principles. Renew. Energy 179, 1233–1245. doi:10.1016/j.renene.2021.07.101
Yang, D.-x., Jing, Y.-q., Wang, C., Nie, P.-y., and Sun, P. (2021). Analysis of renewable energy subsidy in china under uncertainty: feed-in tariff vs. renewable portfolio standard. Energy Strategy Rev. 34, 100628. doi:10.1016/j.esr.2021.100628
Yang, H., Wang, G., Zhou, L., and Zhou, R. (2006). “A study of power market dynamics based on system dynamics modeling.” in International conference on power system Technology, Chongqing, China, 1–6. Available at: https://ieeexplore.ieee.org/document/4116273/. doi:10.1109/ICPST.2006.321448
Yang, J., Zheng, J., Wei, L., and Zhu, S. (2011). “The experience and revelation from renewable portfolio standard in texas for China,” in 2011 International Conference on Electrical and Control Engineering, Yichang, China, 3236–3239. doi:10.1109/ICECENG.2011.6056816
Yu, B., Zhao, Z., Zhao, G., An, R., Sun, F., Li, R., et al. (2021). Provincial renewable energy dispatch optimization in line with Renewable portfolio standard policy in china. Renew. Energy 174, 236–252. doi:10.1016/j.renene.2021.04.055
Zhao, X.-g., Zhou, Y., Zuo, Y., Meng, J., and Zhang, Y.-z. (2019). Research on optimal benchmark price of tradable green certificate based on system dynamics: a china perspective. J. Clean. Prod. 230, 241–252. doi:10.1016/j.jclepro.2019.04.408
Zhejiang Provincial Development and Reform Commission, (2021). Renewable energy power consumption guarantee implementation Plan of Zhejiang Province (trial). Policy. Available online at: http://fzggw.zj.gov.cn/art/2021/8/11/art_1599567_58930212.html.(accessed on April 20, 2022).
Keywords: carbon emission peaking, renewable energy generation, renewable portfolio standard, tradable green certificate, system dynamics
Citation: Zhang Y, Deng H, Yang J, Xu C, Zhou Z, Wen F and Qi D (2022) Impacts of renewable portfolio standard on carbon emission peaking and tradable green certificate market: A system dynamics analysis method. Front. Energy Res. 10:963177. doi: 10.3389/fenrg.2022.963177
Received: 07 June 2022; Accepted: 30 June 2022;
Published: 22 July 2022.
Edited by:
Yang Li, Hohai University, ChinaReviewed by:
Farhad Shahnia, Murdoch University, AustraliaCopyright © 2022 Zhang, Deng, Yang, Xu, Zhou, Wen and Qi. This is an open-access article distributed under the terms of the Creative Commons Attribution License (CC BY). The use, distribution or reproduction in other forums is permitted, provided the original author(s) and the copyright owner(s) are credited and that the original publication in this journal is cited, in accordance with accepted academic practice. No use, distribution or reproduction is permitted which does not comply with these terms.
*Correspondence: Yidi Zhang, aXJpc3lpZGl6QDE2My5jb20=
Disclaimer: All claims expressed in this article are solely those of the authors and do not necessarily represent those of their affiliated organizations, or those of the publisher, the editors and the reviewers. Any product that may be evaluated in this article or claim that may be made by its manufacturer is not guaranteed or endorsed by the publisher.
Research integrity at Frontiers
Learn more about the work of our research integrity team to safeguard the quality of each article we publish.