 Sheng Xiang
 Hongming Yang
 Bo Cao
- 1International Joint Laboratory of Energy Internet Operation and Planning Based on Distributionally Photovoltaic Storage Energy, Hunan International Joint Laboratory of Internet-based Energy Storage, Hunan Provincial Engineering Research Center of Electric Transportation and Smart Distribution Network, School of Electrical and Information Engineering, Changsha University of Science and Technology, Changsha, China
- 2Department of Electrical and Computer Engineering, University of New Brunswick, Fredericton, NB, Canada
Maintaining the frequency of a power system close to its nominal value (50 Hz or 60 Hz) is critical, which comes mainly from generators and flexible loads in traditional power systems. Direct load control (DLC) is a method to control controllable loads for power system optimization. In general, it is used to reduce or shave peak demand. Nonetheless, DLC also can be used to provide frequency control services. Domestic electric water heater (DEWH) is an important kind of controllable load, which takes a high percentage of domestic electric power consumption and has a large thermal energy storage capacity. Hence, DEWH can be a prime candidate for DLC. This study proposes a framework to provide frequency control service with DEWHs. A virtual battery pack system (VBPS) is introduced to be equivalent to the capacity of DEWHs, and a series of measurable indicators are proposed to show the capacity of the VBPS when providing frequency control services. An adaptive criterion is applied to classify controllable DEWHs, which helps to maintain end-user comfort. The performances of the proposed frequency control method during normal and contingency conditions are verified through case studies in CYME.
1 Introduction
With the development of technology, more and more electrical devices are being applied to improve our daily life. However, the total electric power demand and demand variations are increasing, and the pressure on power systems is increasing too. At the same time, renewable energy plants are increasing, e.g., the U.S. will generate 20% of the nation’s electricity from wind energy by 2030 (Lindenberg et al., 2008). The large-scale utilization of renewable energy benefits power systems and the environment. However, the fluctuation of renewable energy occurs frequently, which will increase the pressure on power systems. Hence, more ancillary services are required in power systems, which are necessary to support the transmission of capacity and energy from resources to loads while maintaining reliable operation.
There are many kinds of ancillary services, such as the regulation reserve, load following, spinning reserve, and nonspinning reserve, (Hao et al., 2013; Liu et al., 2000; Meyn et al., 2015; Zhang et al., 2022). These ancillary services can be divided into two groups: the first group contains ancillary services for normal conditions, such as the regulation reserve and load following, and the second group contains ancillary services for contingency conditions, such as the spinning reserve, nonspinning reserve, and replacement reserve.
Power system frequency reflects the balance between the generation and demand, it will keep the nominal value (50 Hz or 60 Hz) when the balance is maintained. The frequency will drop when the generation becomes lower than the load demand, and vice versa. In normal conditions, the balance between generation and demand is maintained, and the frequency is close to its nominal value. The frequency should be recovered to its nominal value after contingency events with frequency control.
In traditional power systems, the frequency control services are provided by generators and flexible loads, and it requires additional costs for these services. In practice, generators are not working under full-power output, the residue capacity is used to provide these reserves. With a fixed number of generators, the total rated output power is fixed; when power demand is increasing, the generation should be increasing accordingly. Hence, the residue capacity is decreasing; in other words, the capacity of frequency control service is decreasing. However, when power demand is increasing, the required reserve capacity is increasing too. As a result, more generators are required, which will increase the construction, operation, and maintenance costs. Moreover, due to the demand variations, we cannot take full advantage of all generators, which will cause a lot of waste. Furthermore, generators provide frequency control services, and more capacity is required than the generation requirement. For example, when power systems make a generation schedule, the total capacity of online generators should meet the peak demand when the maximum generator is lost. This is a constraint that limits the capacity of online generators. As a result, there are some drawbacks to conventional generator frequency control services.
When frequency control services are provided by flexible loads, the loads in power systems can be divided into three levels: The first level is the most important load; outages will cause serious accidents and losses. The second level is less important, but outages will cause some economic losses. The third level, such as residential loads, is the first to be reduced when power system generation cannot meet the load demand, but it will have an impact on the comfort of the end-user. Overall, traditional frequency control resources have extra economic costs or affect the comfort of the end-user, and then, new resources are required.
Direct load control (DLC) regulates power demand by remotely activating or shutting down controllable loads/devices (Ericson, 2009; Gomes et al., 2007; Zhang et al., 2017; Zhang et al., 2018). It can be used not only to reduce or alter peak demand but also to provide ancillary services (Wang et al., 2017; Solanki et al., 2017; Al-jabery et al., 2017). Controllable loads should have energy storage capacity so that end-user comfort can be maintained when these loads are interrupted. These controllable loads are frequently used, and they occupy a large part of the demand for supply systems. Domestic electric water heater (DEWH) is a kind of important component of controllable loads. It has a large energy storage capacity, and it also takes up a large part of overall power consumption: 18% in the U.S. (Government of Canada, 2018), 19% in Canada (Nehrir et al., 1999), and approximately 30% domestically (Kondoh et al., 2011). The mechanism of DEWH is as follows: when the temperature of the DEWH meets its lower limit, the local thermostat turns on, and the DEWH turns on; when the temperature of the DEWH meets its upper limit, the local thermostat turns off, and the DEWH turns off; for other situations, the local thermostat maintains its previous state. A remotely controllable relay is used to control a DEWH. It can be turned off to turn off the DEWH when it is on, and the DEWH will be turned on again when the remote relay turns back; the relay cannot turn on the DEWH when its thermostat is off. Hence, the control method is called off-control. It is easy to realize in practice; we had applied it in our lab and projects.
There has some literature about controllable loads to provide ancillary services. As Lu (2012) described the potential for regulation service by water heaters, the characteristics of water heaters are not considered. In Hao et al. (2013) and Kirby et al. (2008), ancillary services are provided by heating ventilation air conditioning systems. A hotel load response for the spinning reserve is introduced in (Mathieu et al., 2015). The benefits potential of residential loads to provide ancillary services in California is shown in Vrettos (2016). Fridges and freezers were employed to collectively provide second-by-second electricity balancing (Webborn, 2019). In Biegel et al. (2013), these on-off loads were controlled when the frequency thresholds were exceeded and then the primary frequency control services were provided. Literature (Kasis et al., 2020) proved that secondary frequency control services could be provided too. Overall, DLC provides additional ancillary services, which may be an attractive option for power systems. However, obtaining end-user permission will require maintaining their comfort during DLC, which is not described in those studies. The main objective of this research is to propose a framework to provide frequency control services with DEWHs and maintain end-user comfort without temperature information.
The contributions of this study can be summarized as follows:
1) A virtual battery pack system (VBPS) is introduced as a centralized controller for DEWHs, and several indicators are employed to show the frequency control ability of the VBPS. DEWHs in the VBPS can be divided into four groups. Different groups are selected for control in different cases based on the estimated controllable abilities of DEWHs.
2) An adaptive parameter,
3) The end-user comfort is maintained in the proposed control method; whenever the estimated AEL is lower than the tolerance value, the DEWH is turned on and cannot be turned off until the AEL reaches 0.
The article is made up of five sections. Detailed analysis of the frequency control is provided in Section II. Section III presents the VBPS and objective functions for frequency control. Some case studies are provided in Section IV. Some conclusions, finally, are shown in Section V.
2 Frequency control
When all loads in a power system can be supplied by existing generators without violating any operation constraints, the power system is operated in a normal state. When the system remains in a normal state after critical unforeseen events, the power system is secure and operates in a normal safe state. Otherwise, when the balance between generation and demand is maintained, all operating inequality constraints are satisfied. However, the response to some considered contingencies is vulnerable, the power system is operating in a normal insecure state. Preventive control is required to prevent the power system from going into an emergency state. If there has a violation of any operating constraints in the power system, the power system is operating in an emergency state, and contingency services are required to correct and bring the power system into a normal state immediately. As the result of corrective control measures on the power system to avoid system collapse, the operating limit violations may be eliminated, and the system may recover stability with reconfigured topology and restore the balance between generation and demand, the power system is operating in a recovery state. The state diagram in Figure 1 illustrates the transitions between different states and necessary services.
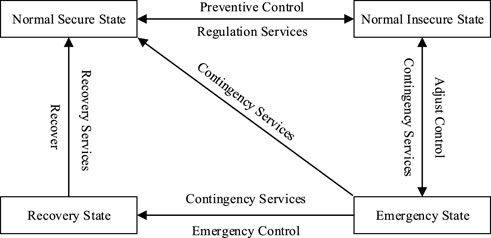
FIGURE 1. Power systems operation states and required services.
Frequency control services are required to maintain the frequency throughout the power systems to its nominal value in all the states. The frequency is affected by active power. There are three kinds of frequency control services in the power system: primary, secondary, and tertiary control (Hui et al., 2017). Considering the communication delays, only the secondary frequency control is provided in this study. The secondary frequency control is a centralized controller that restores the frequency to its nominal value and maintains the desired exchanges between neighboring control areas. It is activated from 30 s to 15 min (Hui et al., 2017; Stephen, 2012). In this study, the frequency controls services are provided in 1 min.
The ancillary services for frequency control can be divided into two groups: for normal conditions, such as the regulation service and load following; for contingency conditions, such as spinning, nonspinning reserve, and replacement reserve (Meyn et al., 2015; Hui et al., 2017).
2.1 Frequency control during normal conditions
When the balance between generation and demand is maintained, and the inequality constraints are afforded, the power system is in its normal state. Regulation reserve is automatically provided by online resources (generators or flexible loads), and its goal is to correct the minute-to-minute deviations between the generation and demand, under normal conditions. The minimum bid size in Pennsylvania, Jersey, and Maryland Power Market is 100 kW (Hui et al., 2017; PJM Manual, 2019) and is typically in the range of 1–10 MW (Webborn, 2019; Nousios and Aebi, 2022). The control signal is typically the output of a proportional-integral controller with the area control error as an input.
Load following is similar to the regulation service, but it has a slower ramp rate and fewer sign changes per unit time. It is used to bridge the gap between the hourly energy markets and frequency regulation. It is still under normal conditions, and it can be manually activated. When a power system with load follows, the frequency regulation signal is usually unrelated and crosses zero frequently (NERC, 2011).
2.2 Frequency control during contingency conditions
When there are some disturbances in power systems, such as transmission faults, and generator losses, the stability of power systems will be affected. Contingency services are required to keep power systems stable under those situations.
Spinning reserve is provided by online generators that are not fully loaded or online loads in response to the disturbances immediately. In other words, it changes the generation or loads to response disturbances. As per the North America Reliability Corporation (NERC) disturbance standard, Spinning reserve is available within 10 min and can be maintained for 10–120 min (Pijnenburg et al., 2016). It is typically activated automatically using an automatic generation control (AGC) signal.
The nonspinning reserve is similar to the spinning reserve. The main difference is that the nonspinning reserve does not need to respond immediately. The resources can be offline but still must be capable of reaching full output within the required 10 min (Paull et al., 2010). Nonspinning reserve is typically dispatched using an AGC signal.
Some regions specify a third contingency reserve called replacement reserve. Online generators, offline generators, and responsive loads can provide this kind of reserve, which can be capable of sustaining response for 2–4 h. It is a type of tertiary control reserve.
Of course, load shedding is the last choice for power systems when the frequency decline cannot be arrested through the above actions. Loads are tripped off to maintain power system stability.
No matter what kind of contingency services resources, the required response speed is from seconds to no more than 10 min. All in all, contingency services restore the generation/load balance after a short time when the sudden unexpected loss by change generation or loads.
3 Virtual battery pack system for frequency control
It is obvious that decreasing the loads is equivalent to increasing generation, and vice versa. This is the basic theory for DLC to provide ancillary services. A DEWH is similar to a battery. When the DEWH gets energy from power systems, it is equivalent to the charging process of the battery. When the DEWH is controlled to reduce its electricity consumption, it is equivalent to the discharging process of the battery. The difference between a DEWH and a battery is the thermal energy stored in the DEWH can be consumed through hot water consumption. In this study, we use a VBPS to represent a DEWHs system. Figure 2 shows the framework of the VBPS to provide frequency control services for the power system.
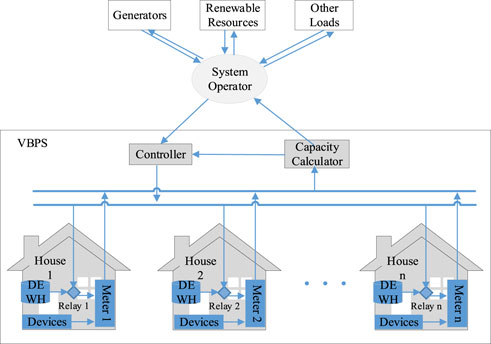
FIGURE 2. Framework of the virtual battery pack system (VBPS) that provides frequency control in the power system.
DEWHs’ states can be identified from smart meters. When the power ramp-up/down value is equal to the rated power of the DEWH, the state of the DEWH turns on/off respectively (Xiang et al., 2020; DeOreo and Mayer, 2000). All the control actions are applied through additional relays; it is called off-control. Considering the available control actions require communication times, it is not realistic to provide the primary frequency control. Hence, we discuss the VBPS providing the secondary frequency control in this study. The capacity of the VBPS is sent to the system operator (SO). Then, an objective will send to the controller to select control actions.
Based on the continuous-time state space model of air conditioners (Lu, 2012), the DEWH can be written as follows:
where T(t) is the temperature of DEWH, AS is the surface area of DEWH, R is the thermal resistance of the insulation material, c is the specific heat capacity of water, ρ is the density of water,
The state of DEWH is decided by its internal thermostat state (Thm (t)) and relay state (R (t)).
The relay state is controlled by control actions. The internal thermostat state follows a mechanical mechanism: if the temperature reaches its upper limit (TH), the thermostat state turns “off”; if the temperature reaches its lower limit (TL), the thermostat turns “on”; otherwise, the previous state is maintained. The thermostat state can be written as follows:
The input for the DEWH is its relay state R(t), then rewrite 1) as follows:
where the state is T(t), the input is U(t), and D(t) is the disturbance as follows:
With a first-order Euler discretization, the discrete time model maintains the structure of the continuous-time matrices and can be written as follows:
where
Furthermore, the output of the state space model is the total consumed electric power as follows:
To maintain end-user comfort, these available control actions are shown in Table 1. It is obvious that when DEWHs in condition 2 get “off” signals, the demand is reduced; it is equivalent to the discharging process of the VBPS. Nevertheless, these DEWHs in condition 5 should be turned back and increase demand. The available discharging rate of the VBPS is decided by the number of DEWHs in conditions 2 and 5. The discharging rate should be as follows:
where k2(t) and k5(t) are the total number of DEWHs in conditions 2 and 5 at time t, respectively.
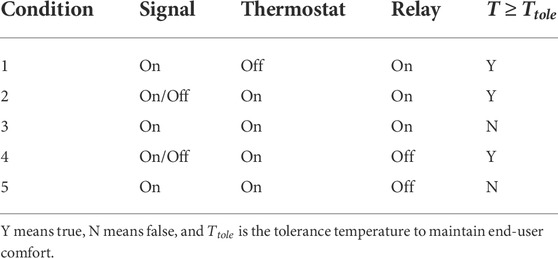
TABLE 1. Available control signals.
The available charging rate of the VBPS is decided by the number of DEWHs, the thermostats of which are “on.” The charging rate can be as follows:
where N is the total number of DEWHs in the VBPS and
In practice, it is hard to measure the DEWH’s temperature. In our previous control algorithm (Xiang et al., 2020), we can control DEWHs without temperature measurements and maintain end-user comfort. In Eqs. 6 and 7, it is clear that the disturbances that affect the DEWH’s temperature are the ambient temperature and draw-out hot water. With the analysis of hot water consumption activities and their probabilities, the disturbances in the worst cases can be easily presented as that in Xiang et al. (2020). Then, the estimated temperature of the DEWH in the worst case will be calculated. The available energy level,
where
It is obvious that the maximum discharging rate and the maximum charging rate vary with the number of DEWHs in each condition, which is decided by the tolerance temperature; hence, with the changing of the tolerance temperature, the two parameters can be changed.
Similar to the description above, the primary frequency control will let the frequency be in an acceptable range; then, the secondary frequency control through VBPS will let the frequency be maintained at its nominal value. The flow chart of the proposed method is shown in Figures 3 and 4, which is the pseudocode. The details are as follows:
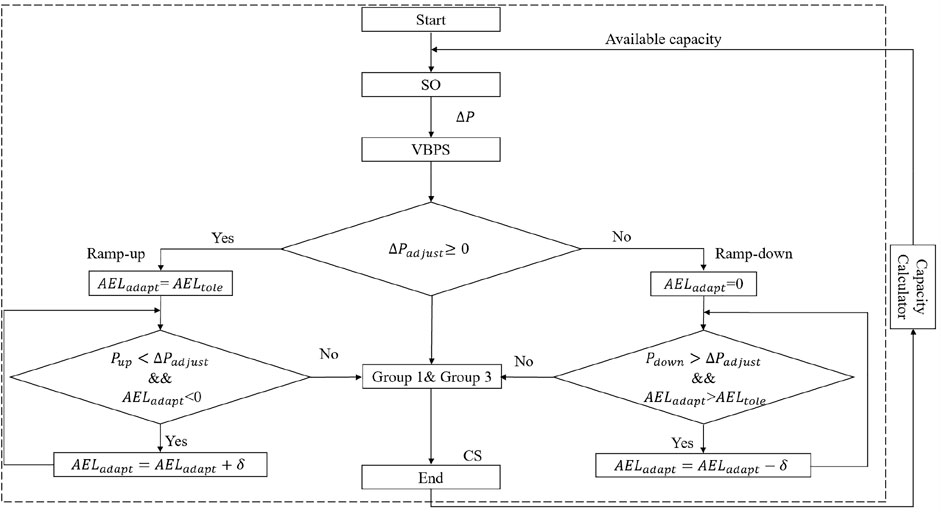
FIGURE 3. Schematic representation of the VBPS that provides ancillary services.
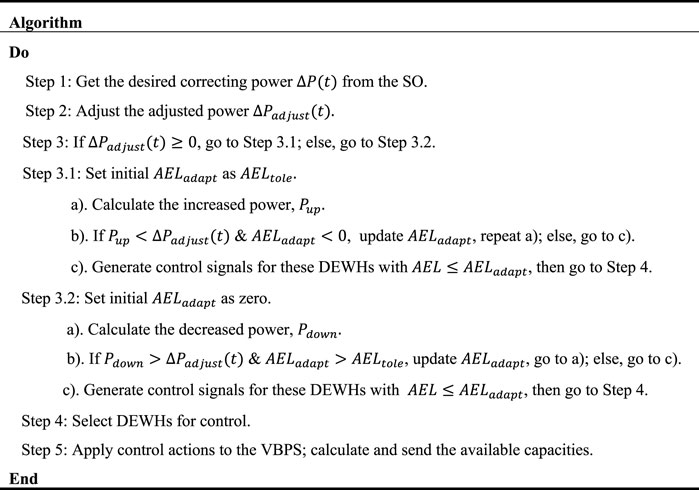
FIGURE 4. Pseudocode of proposed algorithm.
Step 1. Get
Step 2. Generate
where k3(t) is the total number of DEWHs in condition 3.Then, adjust it with the constraint of the VBPS:
Step 3. If
Step 3.1. Set the initial value of the adaptive
where
where
Step 3.2. Decrease the VBPS power to respond to a negative
where
b) If
If
Step 4. Generate control signals for the controllable DEWHs. If
Step 4.1. If
where w1 is the number of DEWHs in the descending order and
Step 4.2. If
where k1 is the number of DEWHs in the ascending order.
Step 5. Execute control signals on the VBPS.In this control algorithm, the
3.1 Virtual battery pack system provides frequency control services during normal condition
When the VBPS provides regulation service, its demand can be as follows:
where
The regulation capacity
As the hourly regulation reserve bid for the power market is preprovided, the maximum charging and maximum discharging rate should be forecasted. In the discrete time model (5), the disturbance parameters include hot water consumption V(t) and ambient temperature
Nowadays, the increasing use of renewable energy as an alternative to fossil fuels is a general trend that has a benefit for the environment. However, due to the randomness of weather, cloud, wind, etc., the generation from renewable resources is varied, which will increase the pressure on power systems to maintain the balance between generation and demand. In general, it can be defended by storage devices or regulation reserves (Chau et al., 2018; Mahdavi et al., 2017). Through charging and discharging, the VBPS can match the fluctuation and maintain the balance between generation and demand.
3.2 Virtual battery pack system provides contingency reserve
When a disturbance is occurring, generation or demand will be changed, and the VBPS will provide the capacity to match the variation. When generators are lost due to the disturbance, the VBPS will be discharged to match the generation decrease; when loads are lost due to the disturbance, the VBPS will be charged to match the load decrease. The contingency reserve can be provided before the VBPS capacity is used up; with our previous control method, the sustainable time is long enough to meet the requirement of the contingency reserve.
When the capacities are used up, the VBPS loses the ability for frequency control services. However, with the varying tolerance temperature, the available capacity will increase. With the increasing number of DEWHs in the systems, the capacity can be increased. Moreover, because of the installation of DEWHs diffusely in North America, the expandable capacity is substantial enough. Hence, there is enough available capacity of the VBPS to provide frequency control services.
4 Case studies
A VBPS consists of 20,000 DEWHs, the hot water consumptions are generated from CREST_Demand_Model v2.2 (Richardson et al., 2008). Some case studies are implemented to prove the ability of the VBPS to provide frequency control services with CYME. The test model structure is an IEEE 34-node test feeder (Schneider et al., 2017). It is shown in Figure 5, and load data are 30-min uncertain data downloaded from PJM. The electricity consumption of the VBPS takes 6.4% of the total electricity consumption of the whole test system and approximately the maximum demand of 20% (morning peak). The transient stability analysis tool of CYME power engineering software is used to show the frequency variations, the simulation time step is 0.0167 s. The CYME power engineering software is a suite of applications composed of a network editor, analysis modules, and user-customizable model libraries from which you can choose to get the most powerful solution.
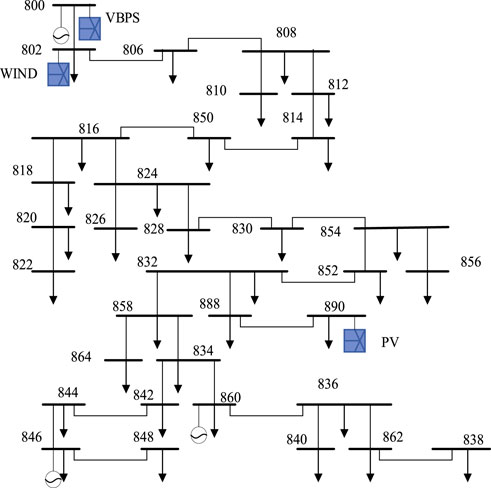
FIGURE 5. Diagram of IEEE 34-bus system.
4.1 Normal condition services
4.1.1 Renewable generation variations
When building a generating schedule for generators, the loads and renewable generations will be forecasted. However, there are differences between forecasting values and actual values. Some reserve capacity should be used to match these differences. Figure 6A shows the frequency drop of 0.03 Hz because of a lack of 1 MW renewable generation when there is no secondary frequency control. The generators in the test model will increase generation to recover the lack of renewable generation, which is shown in Figure 6B. In this case, a 1-MW reserve of online generators is used to match the lack of renewable generation, and the power system is still stable. However, the frequency is not at its nominal value.
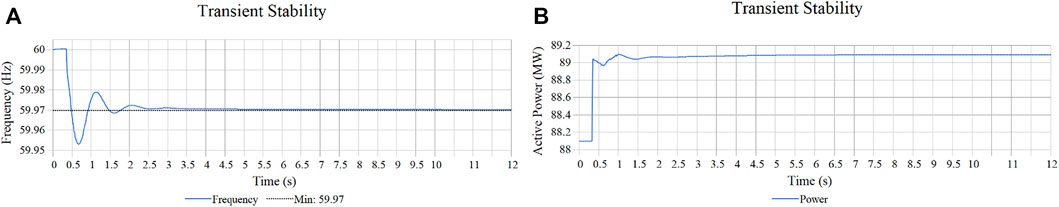
FIGURE 6. (A) Frequency without the VBPS in CYME, (B) Power generation without the VBPS in CYME.
With the VBPS providing the secondary frequency control services 1-min after the unbalance, the frequency and generation are shown in Figure 7. It is clear that the system frequency is recovered to its nominal value as shown in Figure 7A, B, and the spinning reserve of online generators is recovered too.
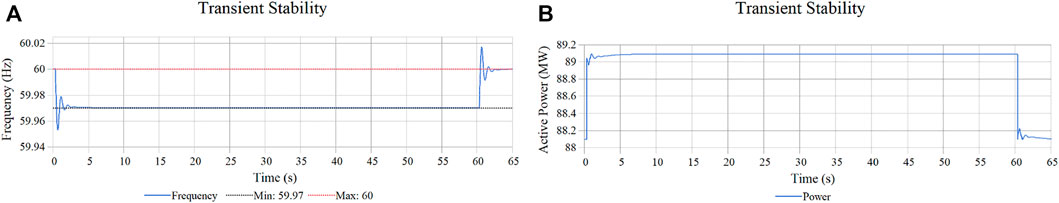
FIGURE 7. (A) Frequency with the VBPS in CYME, (B) Power generation with the VBPS in CYME.
Hence, with the VBPS providing the secondary frequency control, the frequency can be maintained at its nominal value, and the capacity of generators can be restored, which will increase the stability for another unbalance.
The VBPS provides the secondary frequency control to match the differences between actual and forecasted renewable generation from 7:00 a.m. to 0:00 a.m. The renewable generation is shown in Figure 8, the actual and forecast generation is not matched, which is normal in practice. With the VBPS to provide secondary frequency control, when the actual generation is less than the forecast value, the VBPS will be discharged, and vice versa. The Ref line in Figure 9 is the objective of the VBPS charge/discharge to defend the frequency variations, and the solid line is the actual charge/discharge rate of the VBPS. The two lines are approximately coinciding.
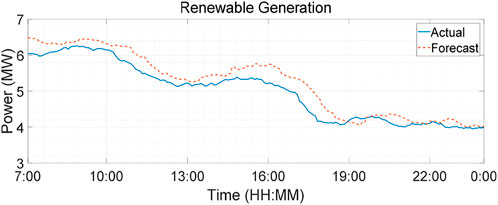
FIGURE 8. Actual and forecast renewable generation.
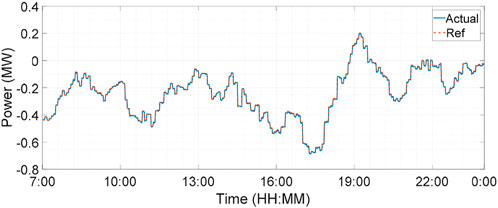
FIGURE 9. Charge/discharge rate of the VBPS.
A metric is selected to present the tracking performance, the root-mean-square (RMS) power tracking error as a percentage of the total steady-state power consumption (Mathieu et al., 2013).
where L is the length of the following duration,
The average price ($/MWh) of regulation services is $15.5/MWh (Hummon et al., 2013); in this case, the VBPS provides approximately 4.2 MWh, and the benefit is approximately 65 $.
4.1.2 Regulation
In general, regulation services are required to correct the minute-to-minute deviations between the generation and demand. For this model, the required regulation service capacities of the test model are 800 kW (4–8 a.m. and 4 p.m. to 0 a.m.) and 525 kW (besides time), as the up and down lines in Figure 10. The case study of the VBPS provides regulation services is carried out, and the regulation test signals are downloaded from PJM.
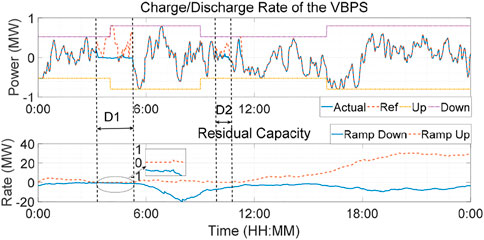
FIGURE 10. Regulation services.
From Figure 10, for 24 h, besides these durations (D1 and D2 in the figure) when the ramp-up capacity (charging) is used up, the VBPS provides regulation services with a good performance, and the RMS value is 2.1%. The durations D1 and D2 when the ramp-up capacity is used up are because the number of DEWHs in conditions 4 and 5 is 0, and all the relays are on; hence, the available ramp-up capacity is used up. The durations are, fortunately, short, and the available capacity can be extended through increase the capacity of the VBPS. In Figure 10, there still has a lot of available capacity during the evening peak.
The minimum temperatures of the VBPS under the original case and with the proposed method are shown in Figure 11. The adaptive criterion helps to increase the minimum temperature, which benefits the end-user comfort.
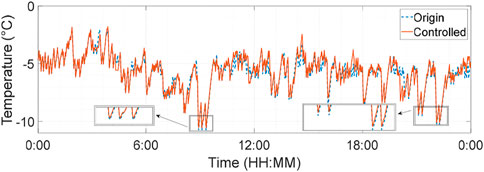
FIGURE 11. Minimum temperature.
The available capacity calculator in Figure 2 is used to send the available capacity to the SO, the SO cannot send the requirement that exceeds the available capacity.
4.2 Contingency response services
As DEWHs can be turned off immediately, the VBPS can be used to respond to contingency events quickly; then, the balance can be maintained.
In general, the start time of generators is approximately 30 min; hence, contingency response resources should provide services for at least 30 min.
The generator on Bus 846 is lost, and the generation loss is 3 MW at 7:30 a.m., with the discharging of the VBPS to maintain the contingency event in 30 min; the VBPS will keep discharging and maintain the system frequency at its nominal value. Figure 12 shows the total demand of the VBPS; during the 30 min, the VBPS discharge in 3 MW matches the lost generation, and the RMS value is 0.01%. The residual available charge/discharge capacity is also shown in Figure 12. It is clear that the VBPS still has enough capacity.
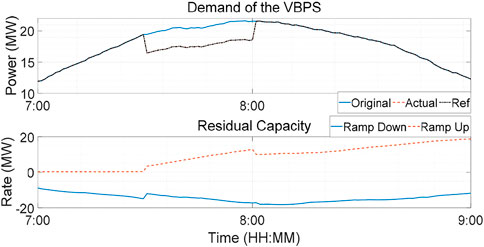
FIGURE 12. Contingency frequency control.
Figure 13A shows the frequency drop of 0.074 Hz when the generation is lost; then, with the VBPS discharge in 3 MW, the balance is recovered, and the frequency backs to its nominal value. Figure 13B shows that the total generation besides the lost generation increases to defend the contingency event with the primary frequency control, and a 3 MW spinning reserve is used. With the VBPS providing secondary frequency control 1 min later, the generation backs to its previous value and the spinning reserve is recovered.
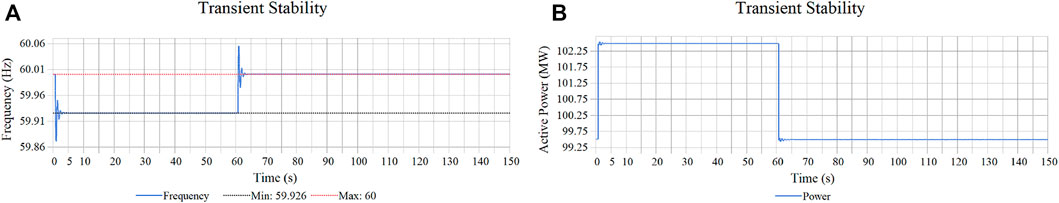
FIGURE 13. (A) Frequency in CYME with a generator loss with the VBPS, (B) Power generation in CYME with a generator loss with the VBPS.
With all the case studies above, the ability of the VBPS to provide frequency control service is excellent, and the benefit is attractive. With the expansion of the VBPS, the available capacity will be more and more. It could be an important frequency control service resource in the future.
5 Conclusion
As an important component of controllable load, DEWHs can be used for peak shaving. It also has a great capacity for ancillary services. In this study, a VBPS is proposed to represent the state and available capacity of DEHWs systems, which will be a virtual unit in power systems. When the system frequency is shifted from its nominal value, a charge or discharge requirement will be sent to the VBPS, then some relays will be turned on or off to respond to the requirement. An IEEE 34 nodes test model is selected to test the performances of the VBPS that provides secondary frequency control services in CYME. Case studies show that with the VBPS providing secondary frequency control services, the system frequency can be maintained at its nominal value. It is obvious that with the VBPS, the reserve capacity of online generators is not consumed, which will increase the stability of power systems or reduce the requirement of these reserves to save money.
The advantages of taking the VBPS as a frequency control services resource include the following: a). The available capacity is large, which is because the thermal storage in a DEWH is large, and it can be turned off without affecting end-user comfort for a long duration; the time duration is related to hot water consumption. b). The system expansion is very easy, which is due to the widespread implementation of DEWHs in North America; the more DEWHs in the VBPS, the more the available capacity. c). The energy stored in the VBPS will be directly used by hot water consumption, which is different from other energy storage devices, such as a battery or flywheel; it does not need to convert the stored energy back into power systems, and the energy loss is less than other storage devices. d). The state of the VBPS can be directly controlled by control signals, and the response speed is quick. Hence, the DEWH system providing frequency control services is a feasible method, and the ability of DEWHs is further excavated.
Data availability statement
The original contributions presented in the study are included in the article/supplementary material; further inquiries can be directed to the corresponding author.
Author contributions
SX designed and wrote this manuscript HY revised this manuscript and will provide the payment BC revised this manuscript.
Acknowledgments
This work was supported in part by the National Natural Science Foundation of China (No. 71931003, No. 72061147004, and No. 72171026), the Science and Technology Projects of Hunan Province under (No. 2019GK5015, No. 2020GK1014, and No. 2021WK2002), the University Industry Collaborative Education Program (No. 202102574001 and No. 202102574005), the Young Talent Project of the Provincial Education Department of Hunan Province (No. 21B0334), the Hunan International Scientific and Technological Cooperation Base of Energy Storage Interconnection (No. 2018WK4010), the Big Data-driven Energy Internet International Science and Technology Cooperation Based of the Ministry of Science and Technology (No.2017D01011).
Conflict of Interest
The authors declare that the research was conducted in the absence of any commercial or financial relationships that could be construed as a potential conflict of interest.
Publisher’s note
All claims expressed in this article are solely those of the authors and do not necessarily represent those of their affiliated organizations, or those of the publisher, the editors, and the reviewers. Any product that may be evaluated in this article, or claim that may be made by its manufacturer, is not guaranteed or endorsed by the publisher.
References
Al-jabery, K., Xu, Z., Yu, W., Wunsch, D. C., Xiong, J., Shi, Y., et al. (2017). Demand-side management of domestic electric water heaters using approximate dynamic programming. IEEE Trans. Comput. -Aided. Des. Integr. Circuits Syst. 36 (5), 775–788. doi:10.1109/tcad.2016.2598563
Nousios, D., and Aebi, S. (2022). Basic Principles of ancillary service products. Switzerland: Swissgrid Ltd.
Biegel, B., Hansen, L., Andersen, P., and Stoustrup, J. (2013). Primary control by ON/OFF demand-side devices. IEEE Trans. Smart Grid 4 (4), 2061–2071. doi:10.1109/tsg.2013.2257892
Chau, T. K., Yu, S. S., Fernando, T., and Iu, H. H. (2018). Demand-side regulation provision from industrial loads integrated with solar PV panels and energy storage system for ancillary services. IEEE Trans. Ind. Inf. 14 (11), 5038–5049. doi:10.1109/tii.2017.2782244
DeOreo, W. B., and Mayer, P. W. (2000). The end uses of hot water in single family homes from flow trace analysis. California, Hayward: Aquacraft Inc Rep. Undated.
Goverment of Canada (2018). Energy Use Handbook 1990 to, 2018. Ottawa, Canada: Natural Resources Canada.
Ericson, T. (2009). Direct load control of residential water heaters. Energy Policy 37 (9), 3502–3512. doi:10.1016/j.enpol.2009.03.063
Gomes, A., Antunes, C. H., and Martins, A. G. (2007). A multiple objective approach to direct load control using an interactive evolutionary algorithm. IEEE Trans. Power Syst. 22 (3), 1004–1011. doi:10.1109/tpwrs.2007.901468
Hao, H., Kowli, A., Lin, Y., Barooah, P., and Meyn, S. (2013). “Ancillary service for the grid via control of commercial building HVAC systems,” in 2013 American Control Conference, Washington, DC, USA, 17-19 June 2013, 467–472.
Hui, H., Ding, Y., Liu, W., Lin, Y., and Song, Y. (2017). Operating reserve evaluation of aggregated air conditioners. Appl. Energy 196, 218–228. doi:10.1016/j.apenergy.2016.12.004
Hummon, M., Denholm, P., Jorgenson, J., and Palchak, D. (2013). Fundamental drivers of the cost and price of operating reserves. Golden, Colorado: National Renewable Energy Lab.
Kasis, A., Monshizadeh, N., and Lestas, L. (2020). Secondary frequency control with on-off load side participation in power networks. IEEE Trans. Control Netw. Syst. 7 (2), 603–613. doi:10.1109/tcns.2019.2934386
Kirby, B., Kueck, J., Laughner, T., and Morris, K. (2008). Spinning reserve from hotel load response. Electr. J. 21 (10), 59–66. doi:10.1016/j.tej.2008.11.004
Kondoh, J., Lu, N., and Hammerstrom, D. J. (2011). “An evaluation of the water heater load potential for providing regulation service,” in 2011 IEEE Power and Energy Society General Meeting, Detroit, MI, USA, 24-28 July 2011,
Lindenberg, S., Smith, B., and O’Dell, K. (2008). 20% wind energy by 2030. Denver, Colorado: Natl. Renew. Energy Lab. NREL US Dep. Energy Renew. Energy Consult. Serv. Energy. Inc.
Liu, Y., Alaywan, Z., Rothleder, M., Liu, S., and Assadian, M. (2000). “A rational buyer’s algorithm used for ancillary service procurement,” in 2000 IEEE Power Engineering Society Winter Meeting. Conference Proceedings (Cat. No.00CH37077), Singapore, 23-27 January 2000, 855.
Lu, N. (2012). An evaluation of the HVAC load potential for providing load balancing service. IEEE Trans. Smart Grid 3 (3), 1263–1270. doi:10.1109/tsg.2012.2183649
Mahdavi, N., Braslavsky, J. H., Seron, M. M., and West, S. R. (2017). Model predictive control of distributed air-conditioning loads to compensate fluctuations in solar power. IEEE Trans. Smart Grid 8 (6), 3055–3065. doi:10.1109/TSG.2017.2717447
Mathieu, J. L., Dyson, M. E. H., and Callaway, D. S. (2015). Resource and revenue potential of california residential load participation in ancillary services. Energy Policy 80, 76–87. doi:10.1016/j.enpol.2015.01.033
Mathieu, J. L., Koch, S., and Callaway, D. S. (2013). State estimation and control of electric loads to manage real-time energy imbalance. IEEE Trans. Power Syst. 28 (1), 430–440. doi:10.1109/tpwrs.2012.2204074
Mayer, P. W., and DeOreo, W. B. (1999). Residential end uses of water. Denver, Colorado, United States: Amer Water Works Assn.
Meyn, S. P., Barooah, P., Bušić, A., Chen, Y., and Ehren, J. (2015). Ancillary service to the grid using intelligent deferrable loads. IEEE Trans. Autom. Contr. 60 (11), 2847–2862. doi:10.1109/tac.2015.2414772
Nehrir, M. H., LaMeres, B. J., and Gerez, V. (1999). “A customer-interactive electric water heater demand-side management strategy using fuzzy logic,” in Power Engineering Society 1999 Winter Meeting IEEE, New York, NY, USA, 31 January 1999 - 04 February 1999, 433.
NERC (2011). IVGTF task 2.4 report, operating practices, procedures, and tools. Atlanta, Georgia, United States: North American Electric Reliability Cop.
Paull, L., Li, H., and Chang, L. (2010). A novel domestic electric water heater model for a multi-objective demand side management program. Electr. Power Syst. Res. 80 (12), 1446–1451. doi:10.1016/j.epsr.2010.06.013
Pijnenburg, P., Saleh, S. A., and McGaw, P. (2016). Performance evaluation of the ZIP model-phaselet frame approach for identifying appliances in residential loads. IEEE Trans. Ind. Appl. 52 (4), 3408–3421. doi:10.1109/tia.2016.2535268
PJM Manual (2019). PJM, manual 11: energy & ancillary services market operations revision: 106, 30. Norristown, Pennsylvania, United States: PJM.
PJM (2019). Available at: https://www.pjm.com/.
Richardson, I., Thomson, M., and Infield, D. (2008). A high-resolution domestic building occupancy model for energy demand simulations. Energy Build. 40 (8), 1560–1566. doi:10.1016/j.enbuild.2008.02.006
Schneider, K. P., Mather, B. A., Pal, B. C., Ten, C. W., Shirek, G. J., Zhu, H., et al. (2017). Analytic considerations and design basis for the IEEE distribution test feeders. IEEE Trans. Power Syst. 33 (3), 3181–3188. doi:10.1109/tpwrs.2017.2760011
Solanki, B. V., Raghurajan, A., Bhattacharya, K., and Cañizares, C. A. (2017). Including smart loads for optimal demand response in integrated energy management systems for isolated microgrids. IEEE Trans. Smart Grid 8 (4), 1739–1748. doi:10.1109/tsg.2015.2506152
Stephen, Koch. (2012). “Demand response methods for ancillary services and renewable energy integration in electric power systems,” (Stuttgart, Germany: Dipl. -Ing. Univ. Stuttgart). Ph.D. dissertation.
Vrettos, E. (2016). Control of residential and commercial loads for power system Ancillary services. Zürich, Switzerland: ETH Zurich.
Wang, J., Zhang, H., and Zhou, Y. (2017). Intelligent under frequency and under voltage load shedding method based on the active participation of smart appliances. IEEE Trans. Smart Grid 8 (1), 353–361. doi:10.1109/tsg.2016.2582902
Webborn, E. (2019). Natural heterogeneity prevents synchronization of fridges with deterministic frequency control. IEEE Access 7, 130206–130214. doi:10.1109/access.2019.2923158
Xiang, S., Chang, L., Cao, B., He, Y., and Zhang, C. (2020). A novel domestic electric water heater control method. IEEE Trans. Smart Grid 11 (4), 3246–3256. doi:10.1109/TSG.2019.2961214
Zhang, C., He, Y., Yuan, L., and Xiang, S. (2017). Capacity prognostics of lithium-ion batteries using EMD denoising and multiple kernel RVM. IEEE Access 5, 12061–12070. doi:10.1109/access.2017.2716353
Zhang, C., Zhao, S., and He, Y. (2022). An integrated method of the future capacity and RUL prediction for lithium-ion battery pack. IEEE Trans. Veh. Technol. 71 (3), 2601–2613. doi:10.1109/tvt.2021.3138959
Zhang, X., Hug, G., Kolter, J. Z., and Harjunkoski, I. (2018). Demand response of ancillary service from industrial loads coordinated with energy storage. IEEE Trans. Power Syst. 33 (1), 951–961. doi:10.1109/tpwrs.2017.2704524
Keywords: frequency control, direct load control, domestic electric water heater, virtual battery pack system, end-user comfort
Citation: Xiang S, Yang H and Cao B (2022) An evaluation of domestic electric water heaters for frequency control. Front. Energy Res. 10:962361. doi: 10.3389/fenrg.2022.962361
Received: 06 June 2022; Accepted: 12 July 2022;
Published: 17 August 2022.
Edited by:
Xiao Wang, Wuhan University, ChinaReviewed by:
Hua bao, Anhui University, ChinaJiaqiang Tian, Xi’an University of Technology, China
Ping Yang, Southwest Jiaotong University, China
Copyright © 2022 Xiang, Yang and Cao. This is an open-access article distributed under the terms of the Creative Commons Attribution License (CC BY). The use, distribution or reproduction in other forums is permitted, provided the original author(s) and the copyright owner(s) are credited and that the original publication in this journal is cited, in accordance with accepted academic practice. No use, distribution or reproduction is permitted which does not comply with these terms.
*Correspondence: Hongming Yang, eWhtNTIxOEAxNjMuY29t