 Chengyu Li
 Zhaoqiang Liu1
95% of researchers rate our articles as excellent or good
Learn more about the work of our research integrity team to safeguard the quality of each article we publish.
Find out more
ORIGINAL RESEARCH article
Front. Energy Res. , 04 August 2022
Sec. Process and Energy Systems Engineering
Volume 10 - 2022 | https://doi.org/10.3389/fenrg.2022.960600
This article is part of the Research Topic CO2-Based Energy Systems for Cooling, Heating, and Power View all 7 articles
The use of heat pump is a promising way of energy conservation to improve the driving range of electric vehicles. In this study, the thermodynamic characteristics of CO2–based blends in the operation of a subcritical heat pump cycle are evaluated at different ambient temperatures considering two operation modes. Coefficient of performance (COP) and volumetric heating capacity (VHC) are used to evaluate heat pump performance. Optimization and comparison of both transcritical and subcritical cycles are conducted using various refrigerants. The results indicated that CO2/R32 (50/50) always outputs higher COP than CO2 or other mixtures. The COP of CO2/R41 (90/10) is inferior to that of CO2 in a transcritical cycle due to the more power consumption of compressor. The blends of R1234yf and R152a with low GWP have lower COP, but a much lower operation pressure is also achieved. CO2 blends have larger VHC, which facilitates simple cycle configuration and compact compression.
In view of the strengthened environmental regulations on greenhouse gas emissions, electric vehicles (EVs), including pure electric vehicles (PEVs), hybrid electric vehicles (HEVs), and fuel cell vehicles (FCVs), are considered promising and are under rapid development owing to their superior environmental protection characteristics (Chen et al., 2021; Kim et al., 2021). Unlike traditional gasoline engine vehicles, less waste heat is generated in EVs, which leads to heating problems during winter. Due to the insufficient waste heat in PEVs and HEVs, more energy from battery are needed for cabin heating, which causes a sharp decline in mileage. For FCVs, auxiliary heating is also needed to shorten the warm-up time and enable rapid start-up performance of PEMFCs. A positive temperature coefficient (PTC) heater is commonly used in EVs. However, the driving range of EV can be reduced by up to 50% with the PTC electric heater owing to its low heating efficiency (<1) (Ls et al., 2022). It was concluded that driving range reduction was very sensitive to heating system operations (Zhaogang, 2014). From this point of view, improvement of the heating efficiency is imperative.
The use of heat pump (HP) is considered an energy conservation option for heating. R134a is a conventional refrigerant used in the air-conditioning/heat pump (AC/HP) system of vehicle. According to the Kigali Amendment to the Montreal Protocol, hydrofluorocarbon (HFC) emissions should be gradually reduced; thus, the phaseout of R134a for vehicle AC/HP systems is inevitable worldwide (Wu et al., 2020). New synthetic hydrofluoroolefins (HFOs) are considered as part of the fourth generation of low GWP refrigerants used as a replacement for hydrofluorocarbons (HFCs); for instance, R1234ze and R1234yf are gaining increasing attention as alternatives to R134a (Dai et al., 2015; Mateu-Royo et al., 2020). However, owing to their complex molecular structures, HFOs are costly. Furthermore, an HP system with a conventional refrigerant (R134a or R1234yf) significantly suffers from diminished heating capacity and system efficiency as the ambient temperature decreases below −10°C (Binbin et al., 2018; Wang et al., 2018).
Regarding natural refrigerants, CO2 (R744) has been considered as a promising candidate as it has zero GWP and a negligible ODP of 1; moreover, it is nontoxic and non-flammable and has excellent thermophysical and transport properties. The use of CO2 in refrigeration, air-conditioning, and HP systems, especially in vehicle AC/HP systems, has been widely investigated (Lee et al., 2012; Wang et al., 2018; Dong et al., 2021; Wang et al., 2021; Zou et al., 2022). Owing to its higher volumetric capacity and better heat transfer properties, CO2 is seen to outperform R134a in terms of thermodynamic performance and system compactness (Wang et al., 2021). Novel configurations of CO2 HP cycles have been proposed and investigated. For instance, the introduction of an ejector can improve the COP of an HP system by 18–19.79% (Zou et al., 2022). However, the high pressure of the transcritical cycle poses significant challenges regarding system reliability in EVs (Binbin et al., 2018).
To improve the characteristics of the CO2 HP system, CO2-based mixtures were considered as potential alternatives (Sarkar and Bhattacharyya, 2009; Hakkaki-Fard et al., 2014; Ju et al., 2018; Wang et al., 2019; Luo et al., 2022). Several types of eco-friendly refrigerants have been evaluated to blend with CO2 in previous works. The mixtures could reduce cycle pressure in contrast to pure CO2; in addition, they could significantly diminish flammability compared with hydrocarbon alone (Sarkar and Bhattacharyya, 2009). Moreover, the temperature glide of the mixture improves the thermal matching between a refrigerant and an external fluid, acting like the Lorenz energy cycle and performing better than pure refrigerant (Luo et al., 2022). Ju et al. (2018) evaluated CO2/R290 mixture in water-source HP water heater system. The results indicated that the CO2/R290 mixture exhibits excellent performance and is an appropriate substitute refrigerant for R22. Hakkaki-Fard et al. (2014) investigated mixtures with temperature glide for residential air-source HPs in cold climates to increase HP performance. The results indicated that the CO2/R32 (20/80) mixture demonstrated the best improvement in heating capacity. The COP of the HP system with CO2/R600 and CO2/R600a was evaluated and compared with pure fluids by Sarkar et al. (Sarkar and Bhattacharyya, 2009). They found that CO2/R600a can be the best substitute refrigerant for R114 for high-temperature heating owing to their superior COP and reduced high side pressure. Guo et al. (2019) conducted performance analysis and optimization of high-temperature HP with CO2-based blends. The results showed that the CO2/R32, CO2/R143a, and CO2/R41 subcritical cycles increased the COP by approximately 8.88, 6.55, and 4.95%, respectively, in comparison with the CO2 transcritical cycle. Throughout the literature review, it was found that CO2-based mixtures have a clear advantage to pure fluid in the HP system for various applications.
However, there are few researches about an HP system with CO2-based mixtures for vehicle cabin heating. The performance of an HP is sensitive to ambient temperature, and the operating temperature range significantly differs in different zones or months in winter. Therefore, it is of great importance to investigate the performance of an HP with CO2-based mixtures in a wide range of cold ambient temperatures. In this study, two operating modes of HP using CO2-based mixtures are investigated for use in vehicle at a temperature range of −20°C to 10°C. A comprehensive thermodynamic analysis was conducted for a subcritical HP cycle. Parametric optimization and comparison between subcritical and transcritical cycles were also performed using CO2 and various mixtures.
In general, a vapor compression HP system comprises a compressor, evaporator, expansion valve, and gas cooler (supercritical) or condenser (subcritical), as shown in Figure 1. HP cycle consists of four processes: compression (1→2), heat rejection (2→3), throttling (3→4), and heat addition (4→1). The external fluids to transfer heat are both air, whose temperature significantly changes during heat exchange.
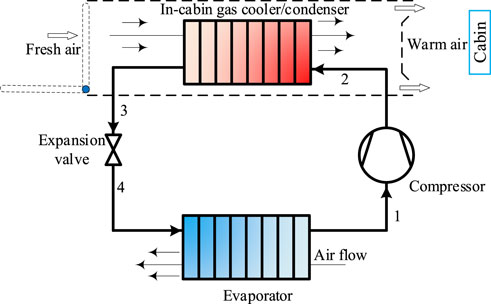
FIGURE 1. Schematic diagram of an air-source heat pump system.
For the fresh air mode of cabin heating, ambient air is directly heated by the gas cooler/condenser, which means that the heated air exhibits a rather high temperature rise in cold climate. In a subcritical cycle, the use of a zeotropic mixture with a larger temperature glide could achieve good thermal match with external air flow. On the other hand, a transcritical cycle has a variable temperature heat rejection process, which provides superior matching to the air-source temperature profile than a subcritical cycle. It undergoes a much higher heat rejection pressure. In this study, both the subcritical and transcritical HP cycles were considered for the cabin heating of EVs.
The analysis was based on the first law of thermodynamics. Coefficient of performance (COP) and volumetric heating capacity (VHC) were considered as metrics to evaluate HP performance. COP represents the thermodynamic performance of HP. A high VHC is advantageous for the reduction in the size and investment costs of compressors. The basic equations for the energy analysis of HP system are as follows:
Working fluid pump power consumption:
where ηm and ηe denote the mechanical and electrical efficiencies, respectively, both assumed to be 0.95.
Compressor isentropic efficiency:
where r = p2/p1 is the compression ratio (Luo et al., 2022).
Heat rejection in the condenser:
Heat input in the evaporator:
Throttling in the expansion valve:
The expansion valve is considered to be adiabatic, resulting in equal enthalpy before and after throttling.
For the total system, COP is the ratio of the heat delivered to the overall power consumption of the cycle:
VHC is the product of enthalpy difference supplied to the heat sink and the suction vapor density:
To investigate the effect of key parameters on system performance, two modes were considered. A common method for HP analysis, called model 1, is to fix the refrigerant temperature at the gas cooler/condenser outlet (T3). The heat sink outlet (fresh warm air) temperature is obtained on the basis of energy balance. In this mode, the heat sink outlet temperature varies in different conditions due to the pinch temperature restriction, i.e., a mode of variable warm air temperature. However, to satisfy the comfort demands of the cabin, temperature control of warm air is necessary. In this way, the fresh hot air temperature is a fixed target value, and T3 is varied until the pinch temperature difference inside the gas cooler/condenser meets the set value, i.e., a mode of fixed warm air temperature named as mode 2.
Working fluids are essential to HP cycle. For the screening of working fluids, thermodynamic properties, stability and compatibility, safety, availability, cost, etc., should be considered. In particular, the new mixture should truly improve the thermodynamic performance of HP cycle. By blending CO2 with different additives, the mixture could obtain various temperature glide and critical characteristics. A mixture with suitable temperature glide and critical characteristics is essential to HP cycle design and performance. For the subcritical cycle, the critical point temperature of additive should be greater than that of CO2, which is advantageous for the design of a binary mixture with a high critical temperature. For the transcritical cycle, the critical point temperature of additive should be similar to that of CO2, and the mixture should have a moderate critical pressure. Furthermore, the additive should be nontoxic, stable, and nonreactive with CO2; its flammability is less important due to the excellent flame-retardant property of CO2. From a view point of environmental properties, the additives should have zero ODP and low GWP. In this study, five working fluids were chosen as potential additives to CO2 as listed in Table 1. Among them, R32 and R134a, which have high GWP, were also investigated owing to their wide application in air-source HP.
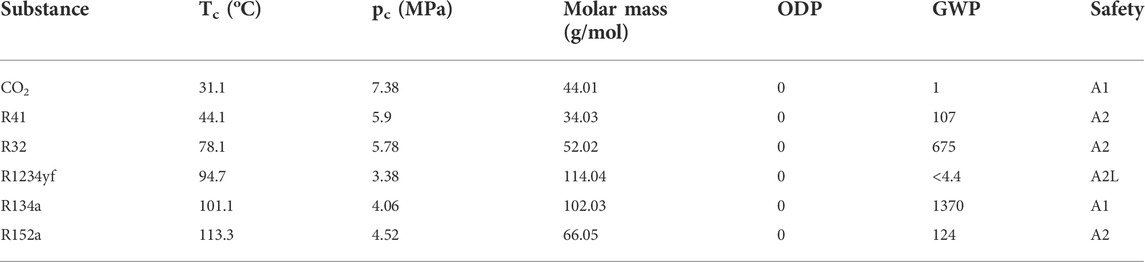
TABLE 1. Physical, environmental, and safety data of working fluids (Dai et al., 2015).
Figure 2 illustrates the variations of critical temperature and critical pressure with CO2 mass fraction for different mixtures. As presented in the figure, the addition of the substance with high critical temperature increases the critical temperature of the mixture, which is directly proportional to the mass fraction of the additive. The critical pressure exhibits a different trend from the variation of mixture composition. For CO2/R41, critical pressure decreases with the increase in R41 mass fraction, indicating that the mixture is suitable for a transcritical cycle owing to its low operation pressure. The critical pressure initially increases and then decreases as the additive mass fraction increases for other mixtures. For a subcritical cycle, condensation should occur away from the near-critical region to achieve stable operation and high heating capacity. Other four mixtures seem to be more suitable than CO2/R41 for a subcritical cycle owing to their higher critical temperature. To obtain hot air temperature higher than 40°C, a critical temperature higher than 50°C for the mixture is suggested.
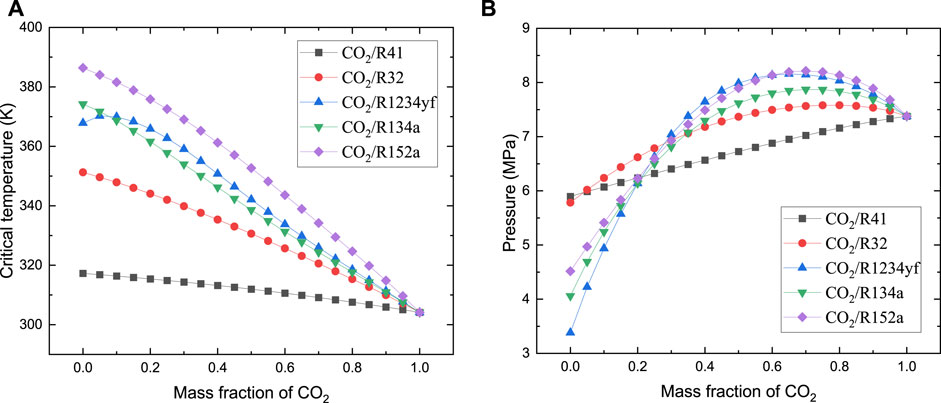
FIGURE 2. Variation of the critical parameters of CO2-based mixture with CO2 mass fraction: (A) critical temperature; (B) critical pressure.
The temperature glide for CO2-based mixtures at various mass fractions is depicted in Figure 3, with a fixed dew point temperature of 0°C. As illustrated in the figure, an additive with a higher critical temperature usually has a larger temperature glide at the same CO2 mass fraction. The temperature glide of CO2/R41 is relatively small, not more than 2°C. CO2/R32 has a moderate temperature of about 14°C, which matches well with the temperature change of the external source during evaporation. For the other mixtures, a high CO2 concentration is recommended to achieve a suitable evaporating temperature glide.
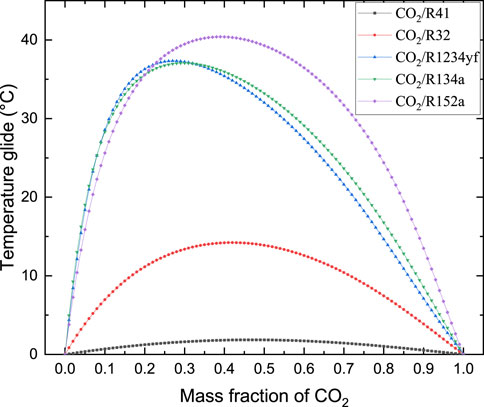
FIGURE 3. Temperature glide variation of mixtures at a dew point temperature of 0°C.
In this study, the mathematical model of heat pump was encoded in MATLAB, along with REFPROP 10.0 for the calculation of the properties of both pure and mixed refrigerants. To simplify the calculation, the following typical assumptions were made:
1) Each component of the HP system is considered to be steady-state and steady-flow.
2) Pressure and heat losses in all the heat exchangers and pipelines are neglected.
3) The overall composition of mixture in each component remains constant.
4) Only counter-flow heat exchangers are used in the system.
5) The environmental temperature is equal to the inlet temperature of external air flow.
6) The leakage of the working fluid from the components is negligible.
7) The condensing and evaporating temperatures of the mixtures refer to dew point temperature.
The simulation conditions used in this study are listed in Table 2. The mass flow rate of the refrigerant is set to 0.01 kg/s. A temperature ranging from −20°C to 10°C is considered a basic ambient condition for the vehicle HP to evaluate the system performance in cold climate. The target temperature of heated air (outlet of the gas cooler/condenser) is set to 40°C (Lee and Lee, 2016), which is considered to satisfy the comfortability of cabin heating. The outlet temperature of the refrigerant and the mass flow of external air in the condenser are calculated based on heat balance, considering pinch restriction. The pinch point temperature difference between refrigerant and air is fixed to 5°C (Binbin et al., 2018). The pinch point location is calculated using an element division and iteration method, as used in our previous work (Li et al., 2020). A superheating degree of 2°C is assumed at the evaporator outlet.
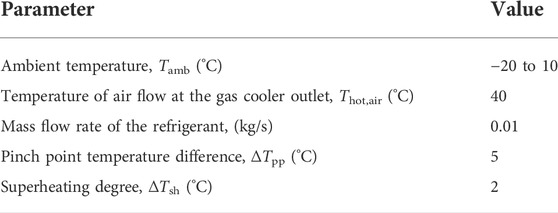
TABLE 2. Specifications of the model.
To validate the thermodynamic model, the pure transcritical CO2 HP cycle was simulated to compare the current air-to-air model in this project with the counter-flow water-to-water HP model in the study by Dai et al. (2015), with key operation parameters set similar to the reference, i.e., the heat sink inlet/outlet temperature is set to 15°C/40°C, the heat rejection pressure to 9.187 MPa, and the pinch temperature differences to 5°C for both exchangers. The calculated COP of such cycle is 4.59, which is 2.7% higher than the simulation result (COP = 4.47) in the study by Dai et al. (2015), indicating a satisfying agreement.
The CO2/R32 mixture has moderate temperature glide in a large composition range; therefore, the thermodynamic analysis in Section 3.1 was conducted based on the CO2/R32 mixture. Figure 4 illustrates the variation of the COP with mixture composition, taking 30°C condensing temperature as an example. In this case, the COP first decreases and then slightly increases with the increase in CO2 mass fraction at different ambient temperatures for mode 1. For mode 2, the variation of the COP is more complex due to the change in T3. At an ambient temperature above −5°C, the COP increases as the CO2 mass fraction increases. However, the variation of curve could be divided into two segments: COP gradually increases in the first part but overlaps with curve of mode 1 in the second part. As is shown in Figure 4, lower COP at higher ambient temperature is achieved, mainly because T3 is lifted by the pinch restriction. Under the condition of low CO2 mass fraction, the refrigerant at the condenser outlet is still in the two-phase region, and the corresponding heating capacity is significantly reduced.
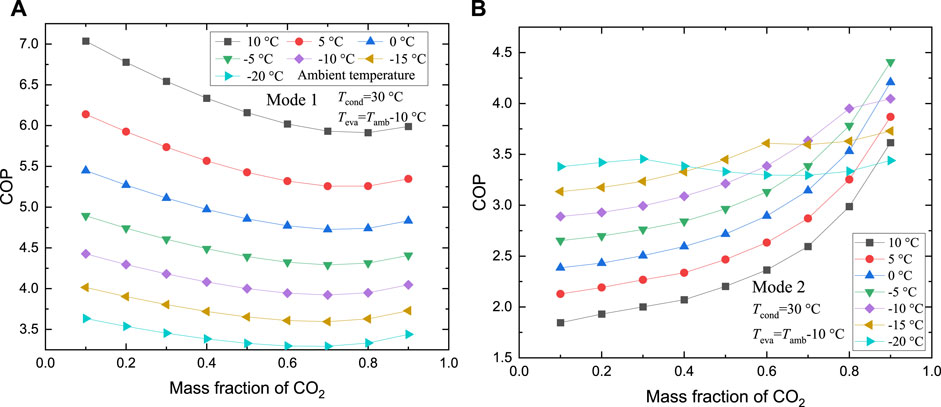
FIGURE 4. Variation of coefficient of performance (COP) with CO2 mass fraction: (A) for mode 1; (B) for mode 2.
The variation of VHC with CO2 mass fraction is illustrated in Figure 5. It can be observed that VHC increases with CO2 mass fraction under various conditions for both modes 1 and 2. Due to the increasing density of higher CO2 concentration, despite the decrease in heating capacity, the VHC still increases monotonically with CO2 mass fraction for mode 1. For mode 2, the heating capacity is largely affected by the variation of T3. For instance, under the condition of Tamb = −20°C, T3 first decreases and then remains constant with the CO2 concentration; consequently, the heating capacity initially increases and then decreases afterward. Therefore, the increasing rate of VHC is lower than that at higher ambient temperature with the increase in CO2 mass fraction.
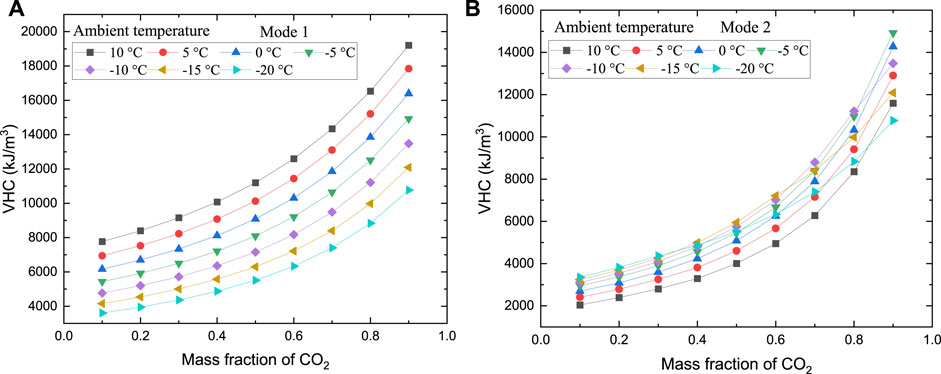
FIGURE 5. Variation of volumetric heating capacity (VHC) with CO2 mass fraction: (A) for mode 1; (B) for mode 2.
The variation of COP with condensing temperature (dew point) under different conditions is presented in Figure 6. The following analysis was based on a typical composition of CO2/R32 (50/50). For mode 1, COP declines with the increase in condensing temperature, except for the ambient temperature of 10°C. In this mode, the pinch point is always located at the low-temperature end of the condenser, and the condenser outlet temperature is only related to ambient temperature. Therefore, thermal matching only affects the warm air outlet temperature, which is determined on the basis of energy balance rather than the heat capacity of HP. In view of the mixture temperature glide during condensation, the refrigerant at the condenser outlet is still in the two-phase region under the condition of low condensing temperature and high ambient temperature. As the condensing temperature increases, the refrigerant at the condenser outlet moves into the liquid region; hence, more heat is rejected, and the COP initially increases.
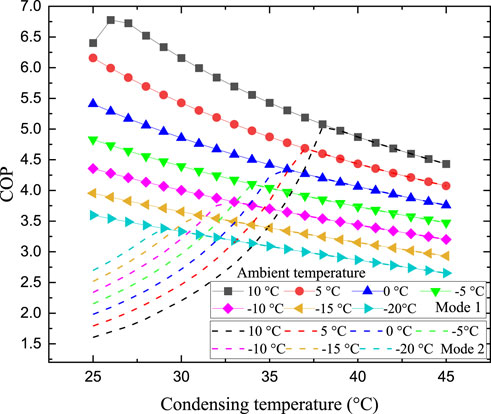
FIGURE 6. Effects of condensing temperature on COP.
For mode 2, the COP first increases and then decreases with the increase in condensing temperature. This is mainly because a higher refrigerant outlet temperature is calculated due to the pinch point limit inside the condenser and less heat capacity is output. As the condensing temperature increases, the pinch point location moves downward to the cold end; in this case, the operation parameters of the two modes coincide, and metrics obtained are equal, as shown in the figure. The maximum COP is obtained when the pinch point is located at the right side of the condenser outlet as the condensing temperature increases.
The variation of VHC with the condensing temperature is depicted in Figure 7. For mode 1, as the condensing temperature increases, the heat capacity increases, whereas the suction density remains constant. Therefore, VHC exhibits a positive relationship with the condensing temperature. As shown in detail in Figure 8, the temperature of the refrigerant at the condenser outlet first decreases and then remains constant as the condensing temperature increases in mode 2. After a sharp increase at the beginning, the VHC and heating capacity then overlap with mode 1 and increase smoothly with the increase in condensing temperature.
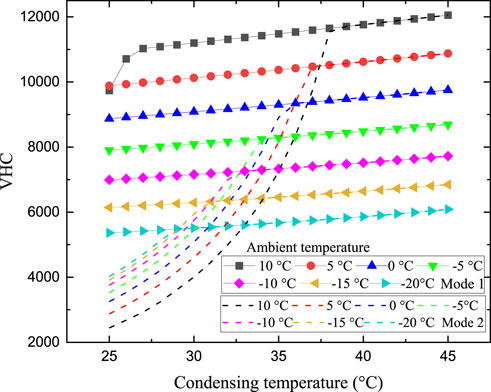
FIGURE 7. Effects of condensing temperature on VHC.
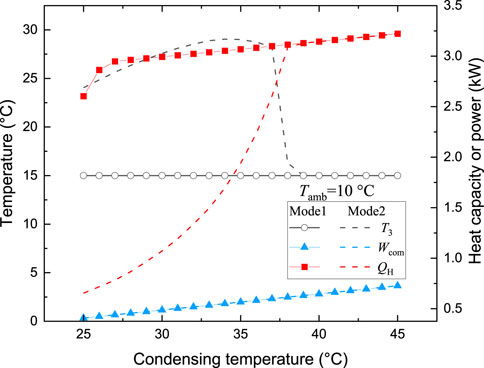
FIGURE 8. Effects of condensing temperature on system operating characteristics.
Figure 9 illustrates the variation of warm air temperature at the condenser outlet with condensing temperature. In view of the increasing compressor discharging temperature, the plot exhibits a progressive increase in warm air outlet temperature with the increase in condensing temperature for mode 1. Considering the fixed T3, although COP increases with the increase in condensing temperature, the maximum warm air temperature is fairly low. For example, warm air temperature is only 21.2°C at Tcond = 25°C, which may not satisfy cabin comfort.
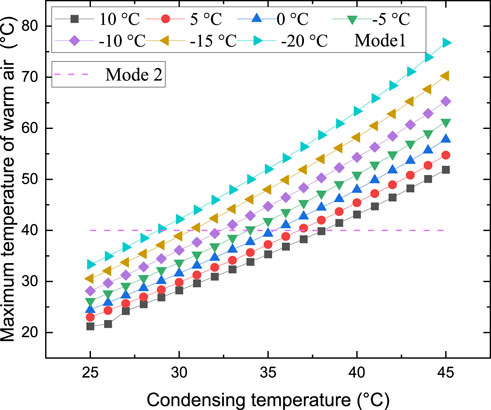
FIGURE 9. Variation of maximum heating temperature with condensing temperature.
To conduct further analysis, the thermal matching of condensation is clearly depicted in a T–Q diagram at different condensing temperatures. For mode 1, two pinch points may appear during condensation, one inside and the other at the cold end of the condenser, as shown in Figure 10. The maximum warm air outlet temperature is mainly limited by the inside pinch of condenser. A larger temperature lift for heated air, i.e., higher air outlet temperature is obtained as the condensing temperature rises. For instance, the maximum warm air temperature is only 23°C at Tcond = 25°C, whereas the value increases to 54.7°C at Tcond = 45°C. A high condensing temperature deteriorates the COP of HP; nevertheless, it is more flexible to satisfy the comfort demand in view of high heating temperature.
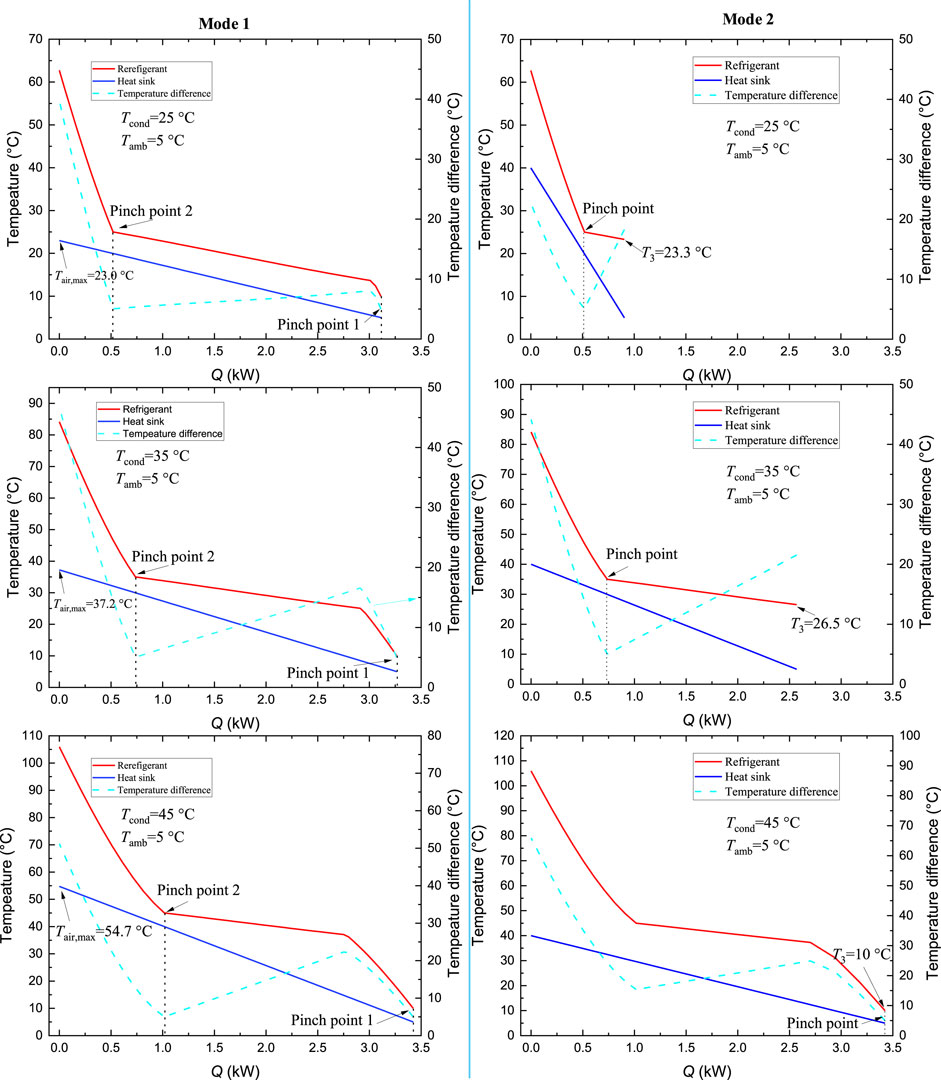
FIGURE 10. T–Q diagram of the condenser at various condensing temperatures.
For mode 2, to ensure that warm air outlet temperature could reach 40°C, the refrigerant temperature at the condenser outlet (T3) might be lifted at low condensing temperature, on the basis of energy balance. As shown in the figure, the pinch point is inside the condenser at condensing temperatures of 25°C and 35°C, and the corresponding refrigerant outlet temperatures are 23.3°C and 26.5°C, respectively. Due to the insufficient heat recovery in the condenser, the corresponding heating capacities are only 0.91 and 2.57 kW. As Tcond rises to 45°C, the pinch point moves downward to the cold end; in this case, T3 is fixed and is equal to the summation of Tamb with pinch temperature. Therefore, the operation parameters of the cycle are the same for both modes.
The temperature of pure refrigerant remains constant during vaporization, whereas the air temperature decreases as the heat is extracted. Therefore, the pinch point always appears at the cold end of the evaporator as shown in Figure 11. In a limiting case, a second pinch point will appear at the hot end of the evaporator; in this case, Teva = Tamb—Tpinch—Tsh. However, the temperature change of cold air flowing through the evaporator is fairly negligible, which means that more air mass flow is needed for the same heat exchange capacity. In other words, a lower evaporating temperature is applied to ensure a suitable temperature change of heat source and corresponding mass flow rate, which will deteriorate the COP in turn.
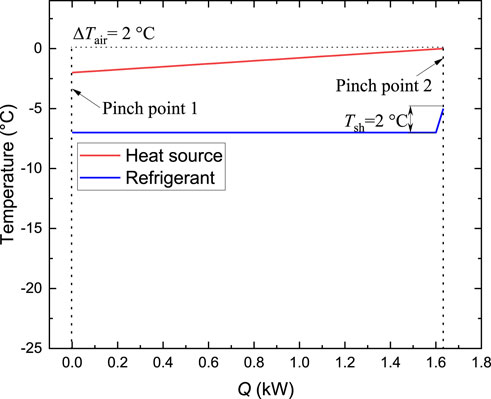
FIGURE 11. T–Q diagram of the evaporator for pure CO2.
Due to the temperature glide of the zeotropic mixture during evaporation, a better thermal matching between the refrigerant and external heat source could be achieved. Figure 12 illustrates the profiles for different evaporating temperatures, taking the ambient temperature of 0°C as an example. At a low evaporating temperature of −10°C, the pinch point is located at the cold end, and the terminal temperature difference at the hot end is 8°C. As Teva rises to −7°C, a new pinch point appears at the hot end. In this condition, the temperature profiles of the refrigerant and external source are almost parallel with each other, indicating satisfying thermal matching. Through the mixture temperature glide, a proper temperature change of heat source could be achieved at a high evaporating temperature, even if a second pinch point appears at the hot entrance. And the lifted evaporating temperature is beneficial to increase of COP.
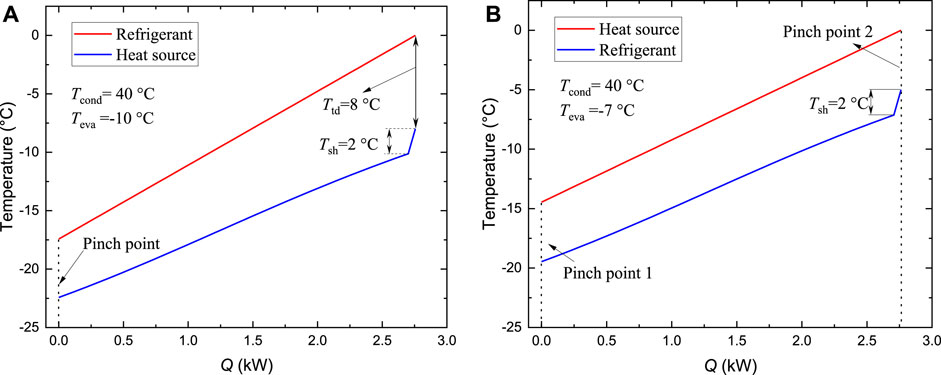
FIGURE 12. T–Q diagram of the evaporator for mixture at different evaporating temperatures.
The maximum COP under the optimization of condensing temperature for both modes is depicted in Figure 13. As shown in the figure, the COP increases with the ambient temperature for both modes. Mode 1 always outperforms mode 2, but the gap enlarges as the ambient temperature increases. The COP increases from 3.6 to 6.8 with the increase in ambient temperature from −20°C to 10°C for mode 1, whereas the value changes from 3.4 to 5.0 for mode 2. The corresponding VHC at the maximum COP is shown in Figure 13B; the value also increases with ambient temperature due to the high suction density and large heating capacity.
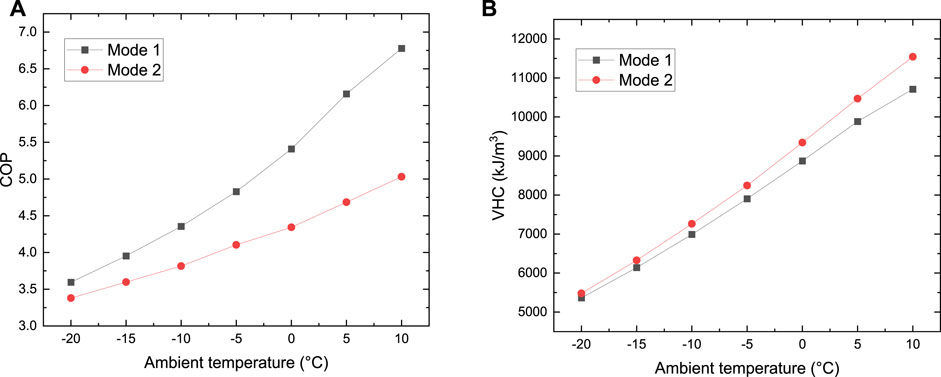
FIGURE 13. Variation of COP and VHC with ambient temperature.
Figure 14 illustrates the effects of heating target temperature for mode 2. To supply higher warm air temperature, a higher condensing temperature is needed. Hence, the COP decreases as the heating target temperature increases. VHC slightly increases with the increase in heating target temperature at different ambient temperatures.
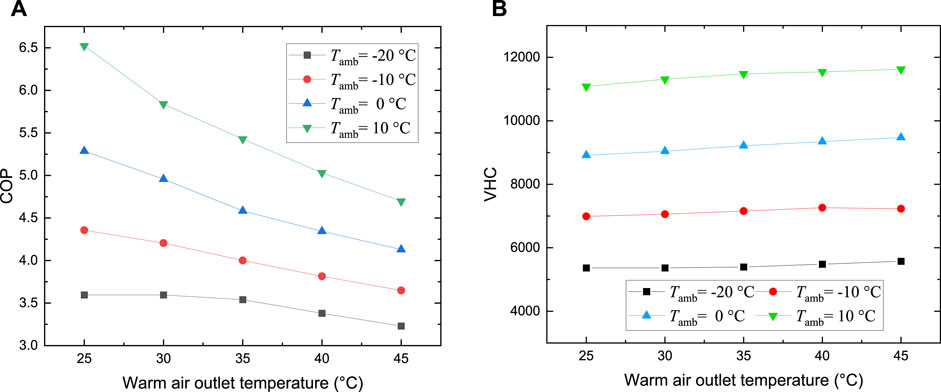
FIGURE 14. Variation of COP and VHC with warm air outlet temperature.
Figure 15 illustrates the maximum COP curves for different refrigerants at various ambient temperatures for mode 2, and the corresponding VHC is depicted in Figure 15B. A subcritical cycle using CO2/R32 (50/50) outperforms other working fluids in the whole ambient temperature range, with COP varying from 3.57 to 5.41. For a transcritical cycle, CO2/R41 (90/10) produces a higher heating capacity, yet a higher power consumption during compression, and its COP is lower than that of pure CO2. CO2/R134a (70/30) and CO2/R152a (80/20) exhibit a relatively poor performance. The COP of CO2/R1234yf (80/20) is rather close to that of the CO2 transcritical cycle at lower ambient temperature, but it becomes inferior as the ambient temperature increases. Due to the relatively lower condensing pressure, the subcritical cycle using CO2-based mixture is competitive than the transcritical cycle.
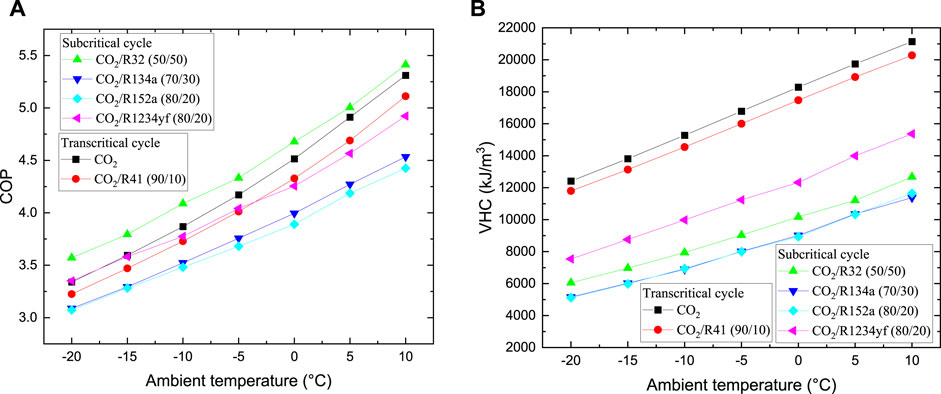
FIGURE 15. Optimal COP and corresponding VHC at various ambient temperatures.
The VHC monotonically increases with ambient temperature, in view of the evaporating pressure. The transcritical cycle has a higher VHC than the subcritical cycle, which implies lower compressor size and investment cost for the same heating capacity. CO2/R134a (70/30) and CO2/R152a (80/20) have the lowest VHC ranging from about 5,100 kJ/m3 to 11,000 kJ/m3; nevertheless, the values are still lager than the common values [between 3,000 kJ/m3 and 6,000 kJ/m3 (Arpagaus et al., 2019)], indicating a relatively high heat supply rate with compact compression equipment.
To improve the performance of HP in the application of vehicle cabin heating at a cold ambient temperature, CO2-based mixtures with some typical organic fluids were evaluated. In this study, two modes, i.e., variable warm air temperature and fixed warm air temperature, were adopted. The thermodynamic characteristics of a subcritical HP cycle using CO2/R32 (50/50) were comprehensively investigated, and the effects of the key parameters were analyzed. This study compared the performances of subcritical and transcritical HP cycles using CO2 and other mixtures. Based on the study, the following conclusions were drawn:
(1) In the mode of variable warm air temperature, HP outputs lager heating capacity and COP, and COP decreases with the increase in condensing temperature. In view of the relatively low operating temperature, this mode is suitable for the rapid start-up stage of cabin heating.
(2) In the mode of fixed warm air temperature, an optimal condensing temperature exists for the subcritical cycle, and the optimal value increases with the ambient temperature. The maximum COP is obtained when two pinch points appear in the condenser.
(3) The subcritical cycle using CO2/R32 (50/50) produces greater COP than that using other refrigerants. In the transcritical cycle, pure CO2 performs better than CO2/R41 due to the reduced pressure ratio. Other mixtures are inferior to the CO2 transcritical cycle, but the subcritical cycle has as much as 37% reduction in high operation pressure.
(4) The CO2 transcritical cycle has maximum VHC, which is much greater than that of the subcritical cycle. Nevertheless, the subcritical cycle using CO2-based mixtures still has higher VHC values than the traditional organic refrigerants. In view of the high VHC, a single-stage compression satisfies the requirement even at cold ambient temperature. This will facilitate simple cycle configuration and compact compressor, which is significant in automotive applications.
The original contributions presented in the study are included in the article/supplementary material; further inquiries can be directed to the corresponding authors.
CL: Conceptualization, Investigation, Methods, Formal analysis, Writing—original draft. ZL: Software, Formal analysis, Investigation, Writing—original draft, Visualization. BS: Supervision, Funding acquisition. YW: Writing—review and editing, Project administration. SG: Supervision. TZ: Resources. BW: Resources.
The authors gratefully acknowledge the support from the Youth Innovation Technology Project of Higher School in Shandong Province (No. 2021KJ083), the Major Scientific and Technological Project of Shandong Province (No. 2020CXGC010405, No. 2020CXGC010406) and the Zibo City – Shandong University of Technology Cooperative Projects (No. 2019ZBXC081).
Baolong Wang was employed by Zhongtong Bus Holdings, Co., Ltd.
The authors declare that the research was conducted in the absence of any commercial or financial relationships that could be construed as a potential conflict of interest.
All claims expressed in this article are solely those of the authors and do not necessarily represent those of their affiliated organizations, or those of the publisher, the editors, and the reviewers. Any product that may be evaluated in this article, or claim that may be made by its manufacturer, is not guaranteed or endorsed by the publisher.
Arpagaus, C., Prinzing, M., Kuster, R., and Uhlmann, M. (2019). “High temperature heat pumps-Theoretical study on low GWP HFO and HCFO refrigerants,” in IIR Int. Congr. Refrig., Montreal, Québec, Canada, 25 August 2019, 8.
Binbin, Y. U., Yang, J., Wang, D., Shi, J., and Chen, J. (2018). Modeling and theoretical analysis of a CO2 -propane autocascade heat pump for electrical vehicle heating. Int. J. Refrig. 95, 146–155. doi:10.1016/j.ijrefrig.2018.07.030
Chen, Y., Zou, H., Dong, J., Wu, J., Xu, H., and Tian, C. (2021). Experimental investigation on the heating performance of a CO2 heat pump system with intermediate cooling for electric vehicles. Appl. Therm. Eng. 182 (1), 116039. doi:10.1016/j.applthermaleng.2020.116039
Dai, B., Dang, C., Li, M., Tian, H., and Ma, Y. (2015). Thermodynamic performance assessment of carbon dioxide blends with low-global warming potential (GWP) working fluids for a heat pump water heater. Int. J. Refrig. 56, 1–14. doi:10.1016/j.ijrefrig.2014.11.009
Dong, J., Wang, Y., Jia, S., Xianhui, Z., and Linjie, H. (2021). Experimental study of R744 heat pump system for electric vehicle application. Appl. Therm. Eng. 183, 116191. doi:10.1016/j.applthermaleng.2020.116191
Guo, H., Gong, M., and Qin, X. (2019). Performance analysis of a modified subcritical zeotropic mixture recuperative high-temperature heat pump. Appl. Energy 237, 338–352. doi:10.1016/j.apenergy.2018.12.094
Hakkaki-Fard, A., Zine, A., and Ouzzane, M. (2014). Applying refrigerant mixtures with thermal glide in cold climate air-source heat pumps. Appl. Therm. Eng. 62 (2), 714–722. doi:10.1016/j.applthermaleng.2013.10.033
Ju, F., Fan, X., Chen, Y., Ouyang, H., Kuang, A., Ma, S., et al. (2018). Experiment and simulation study on performances of heat pump water heater using blend of R744/R290. Energy Build. 169 (6), 148–156. doi:10.1016/j.enbuild.2018.03.063
Kim, S., Jeong, H., and Lee, H. (2021). Cold-start performance investigation of fuel cell electric vehicles with heat pump-assisted thermal management systems. Energy 232, 121001. doi:10.1016/j.energy.2021.121001
Lee, H., and Lee, M. (2016). Steady state and start-up performance characteristics of air source heat pump for cabin heating in an electric passenger vehicle. Int. J. Refrig. 69, 232–242. doi:10.1016/j.ijrefrig.2016.06.021
Lee, M. Y., Lee, H. S., and Won, H. P. (2012). Characteristic evaluation on the cooling performance of an electrical air conditioning system using R744 for a fuel cell electric vehicle. Energies 5 (5), 1371–1383. doi:10.3390/en5051371
Li, C., Pan, L., and Wang, Y. (2020). Thermodynamic optimization of Rankine cycle using CO2-based binary zeotropic mixture for ocean thermal energy conversion. Appl. Therm. Eng. 178, 115617. doi:10.1016/j.applthermaleng.2020.115617
Ls, A., Cy, B., Jy, A., and Kim, M. S. (2022). Investigation on the performance enhancement of electric vehicle heat pump system with air-to-air regenerative heat exchanger in cold condition. Sustain. Energy Technol. Assessments 50, 101791. doi:10.1016/j.seta.2021.101791
Luo, J., Yang, K., Zhao, Z., Chen, G., and Wang, Q. (2022). Experimental investigations on the performance of a single-stage compound air-source heat pump using CO2/R600a in cold regions. Appl. Therm. Eng. 205, 118050. doi:10.1016/j.applthermaleng.2022.118050
Mateu-Royo, C., Mota-Babiloni, A., Navarro-Esbrí, J., and Barragán-Cervera, Á. (2020). Comparative analysis of HFO-1234ze(E) and R-515B as low GWP alternatives to HFC-134a in moderately high temperature heat pumps. Int. J. Refrig. 124, 197–206. doi:10.1016/j.ijrefrig.2020.12.023
Sarkar, J., and Bhattacharyya, S. (2009). Assessment of blends of CO2 with butane and isobutane as working fluids for heat pump applications. Int. J. Therm. Sci. 48 (7), 1460–1465. doi:10.1016/j.ijthermalsci.2008.12.002
Wang, D., Liu, Y., Kou, Z., Yao, L., Lu, Y., Tao, L., et al. (2019). Energy and exergy analysis of an air-source heat pump water heater system using CO2/R170 mixture as an azeotropy refrigerant for sustainable development. Int. J. Refrig. 106, 628–638. doi:10.1016/j.ijrefrig.2019.03.007
Wang, D., Yu, B., Li, W., Shi, J., and Chen, J. (2018). Heating performance evaluation of a CO2 heat pump system for an electrical vehicle at cold ambient temperatures. Appl. Therm. Eng. 142, 656–664. doi:10.1016/j.applthermaleng.2018.07.062
Wang, Y., Dong, J., Jia, S., and Huang, L. (2021). Experimental comparison of R744 and R134a heat pump systems for electric vehicle application. Int. J. Refrig. 121, 10–22. doi:10.1016/j.ijrefrig.2020.10.026
Wu, J., Zhou, G., and Wang, M. (2020). A comprehensive assessment of refrigerants for cabin heating and cooling on electric vehicles. Appl. Therm. Eng. 174, 115258. doi:10.1016/j.applthermaleng.2020.115258
Zhaogang, Q. (2014). Advances on air conditioning and heat pump system in electric vehicles. Renew. Sustain. Energy Rev. 38, 754–764. doi:10.1016/j.rser.2014.07.038
Keywords: heat pump, CO2-based mixture, air-source, vehicle, cold climate
Citation: Li C, Liu Z, Sun B, Wang Y, Gao S, Zhang T and Wang B (2022) Thermodynamic analysis of CO2 blends for vehicle heat pump at cold ambient temperature. Front. Energy Res. 10:960600. doi: 10.3389/fenrg.2022.960600
Received: 03 June 2022; Accepted: 29 June 2022;
Published: 04 August 2022.
Edited by:
Wen Su, Central South University, ChinaReviewed by:
Rui Zhai, Hefei University of Technology, ChinaCopyright © 2022 Li, Liu, Sun, Wang, Gao, Zhang and Wang. This is an open-access article distributed under the terms of the Creative Commons Attribution License (CC BY). The use, distribution or reproduction in other forums is permitted, provided the original author(s) and the copyright owner(s) are credited and that the original publication in this journal is cited, in accordance with accepted academic practice. No use, distribution or reproduction is permitted which does not comply with these terms.
*Correspondence: Binbin Sun, c3VuYmluX3NkdXRAMTI2LmNvbQ==; Youtang Wang, d3l0QHNkdXQuZWR1LmNu
Disclaimer: All claims expressed in this article are solely those of the authors and do not necessarily represent those of their affiliated organizations, or those of the publisher, the editors and the reviewers. Any product that may be evaluated in this article or claim that may be made by its manufacturer is not guaranteed or endorsed by the publisher.
Research integrity at Frontiers
Learn more about the work of our research integrity team to safeguard the quality of each article we publish.