 Ye Wang
 Weidong Meng1
 Bo Huang
 Yuyu Li
- 1School of Economics and Business Administration, Chongqing University, Chongqing, China
- 2School of Business & Economics, Chongqing Normal University, Chongqing, China
The new energy vehicle (NEV) product subsidy policy did not achieve a satisfactory effect on encouraging enterprise R&D as the government ignored the consumer technology thresholds—the minimum requirements of NEV consumers on a specific technology or performance of NEV. We built a game model under subsidies among the government, NEV companies, and NEV consumers considering NEV consumer characteristics such as technology thresholds. We solved the optimal retreating product subsidy policy of the government. We also analyzed the incentive effect, efficiency, and application scope of product subsidy policies and the impacts of the technology thresholds on them. We found that the government should subsidize NEV firms with medium R&D ability and encourage them to upgrade NEV technical level to the upper limit in the current stage or the highest level under financial constraints. The government should gradually reduce the unit subsidy until withdrawn with the improvement of the R&D ability of NEV firms. The technology thresholds increase the optimal unit subsidy and decrease the subsidy efficiency. Furthermore, the retreating policy is a cherry-picking subsidy method that causes companies with lower R&D ability to drop R&D.
1 Introduction
To encourage NEV companies to improve their technologies, the Chinese government has provided NEV product subsidies since 2010. The accumulative central and local subsidies exceeded 100 billion yuan by 2017, while the total amounts may exceed 300 billion yuan by 2022 (Zhang et al., 2013; Li C et al., 2019). However, the excessive reliance of NEV firms on subsidies has led to their lack of R&D motivation and low R&D investment (Lou, 2016). Then, the Chinese government implemented the retreating product subsidy policy—gradually reducing the unit subsidy until withdrawn—to change the status quo and increase firms’ R&D investment. However, the effectiveness of the retreating policy remains controversial (Xu and Xu, 2021). Therefore, we need to study whether the retreating policy is effective and how to improve it.
In fact, social dilemmas such as insufficient R&D investment of NEV firms are encountered in many fields of economy and society, and government usually interventions to solve them via many kinds of policies and tools, such as subsidy. Meanwhile governmental interventions to solve social dilemma were studied in depth (Zhou et al., 2019; Tanimoto, 2021; Yuichi et al., 2021). The existing literature held different views on the effects of product subsidy policy but agreed that different subsidy scenarios should consider different key influencing factors (Lee, 2011; Santos and Rembalski, 2021; Song et al., 2021). However, the literature ignored a critical factor influencing NEV product subsidy policy—the technology thresholds of NEV consumers (Eggers and Eggers, 2011; Hackbarth and Madlener, 2013; Liu et al., 2018). Firstly, the technology thresholds are one of the most typical characteristics of NEV consumers. They have essentially caused some widespread problems in the NEV market, such as “range anxieties” and “recharge anxieties” of Chinese consumers, driving mileage requirements of Nordic consumers on traveling (Wang et al., 2016; Melliger et al., 2018; Chakraborty et al., 2022). Secondly, the technology thresholds significantly affect the product subsidy policy. They affect the demands and R&D decisions of NEV firms, which further affect the effects of the subsidy policy to encourage R&D (Eggers and Eggers, 2011; Hackbarth and Madlener, 2013). Therefore, we need to study the incentive effect and efficiency of the retreating product subsidy policy based on consumer technology thresholds.
The main contributions of this paper are as follows: On the one hand, current literature ignored the impacts of consumer technology thresholds on the NEV product subsidy policy. We built a three-stage sequential game model under subsidies based on NEV consumer technology thresholds and solved optimal retreating product subsidy strategies. On the other hand, we analyzed the incentive effect, efficiency, and application scope of product subsidy policies and the impacts of the technology thresholds on them. We also gave policy suggestions for the government from the perspectives of subsidy effect, subsidy efficiency, and cherry-picking potential firms.
We organized the remainder as follows: We conducted the literature review in section 2. Section 3 described the game model between the government and NEV firms. The optimal strategies of the retreating product subsidy policy are solved in section 4. We analyzed the incentive effect and efficiency of the policy and the impact of technology thresholds in section 5. In section 6, we carried out the numerical simulation. We got the conclusions and policy suggestions in section 7.
2 Literature review
Looking back at the relevant research on product subsidy policy, we found that the controversy exists on whether product subsidies have incentive effects on firm R&D (Liu et al., 2018; Santos and Rembalski, 2021; Song et al., 2021). The debate may be that different studies have considered different subsidy scenarios, subsidy goals, and significantly different influencing factors. Nagy, Hagspiel, and Kort found that the government should reduce the risk of subsidy withdrawal as much as possible from the perspective of social welfare (Li et al., 2020; Hagspiel et al., 2021; Nagy et al., 2021; Yang et al., 2021). Harvey et al. found that the government should cut or stop electric vehicle subsidies for environmental benefits (Harvey, 2020). Deng and Tian found that avoiding excessive subsidies can prevent NEV manufacturers from defrauding the government to obtain grants (Deng and Tian, 2020). Santos and Rembalski and Ye et al. reached the opposite conclusions from the perspective of sustainable development: The former mainly considered the current high NEV production costs and emphasized the need for subsidies in the short term; the latter mainly considered market demands and technological development, and proposed that replacing product subsidies with alternative policies, such as the unlimited driving policy, can promote the endogenous development of the NEV industry (Santos and Rembalski, 2021; Ye et al., 2021). Undoubtedly, key influencing factors should not be ignored when studying the incentive effects of product subsidy policies.
Some literature studied product subsidy policies from the perspective of subsidy efficiency. Li et al. compared the subsidy efficiency of different subsidy methods (subsidy efficiency is the emission reduction effect achieved by unit subsidy expenditure) and found that R&D investment subsidies had higher subsidy efficiency than product subsidies when they improved social welfare (Li et al., 2020; Wang et al., 2021; Wu et al., 2022). Zhang, Wang, and Chai found that government subsidies provided to new energy taxis and special vehicles have high subsidy efficiency (Zhang et al., 2020; Nie et al., 2021). Yu, Lin, and Qi found that government subsidies are more efficient when micro-grid users do not hide their private information, and the adverse selection problem reduces the subsidy efficiency (Yu et al., 2021). Decarolis, Polyakova, and Ryan found that an efficient government subsidy mechanism should have three characteristics: maintaining the marginal elasticity of demand, limiting the influence of market forces, and ensuring the link between price and marginal cost (Decarolis et al., 2020).
Further reviewing the research on the influencing factors of government subsidies, we found that they focused on factors such as enterprise characteristics, industry characteristics, and subsidy methods. At the same time, they ignored the influence of consumer behavior characteristics, such as consumer technology thresholds. Some studies considered aspects of enterprises, such as R&D capabilities, financial constraints, productivity, and social responsibility (Guo et al., 2018; Li et al., 2021a; Liu et al., 2021; Zhang and Huang, 2021). Some studies considered industry characteristics, such as specialization, aggregation, and technology dependence of the industry (David et al., 2000; Gao et al., 2021). Others believe the influence of subsidy methods, such as Li et al. comparing product subsidies with R&D investment subsidies, Zhang, Xue, and Li comparing fixed grants and discount subsidies, and Li et al. comparing green loans with R&D subsidies (Li et al., 2018; Li et al., 2020; Zhang et al., 2021). In particular, Hong, Chiu, and Gandajaya considered the impacts of consumer preferences and green awareness (Hong et al., 2021). They found that subsidies to firms achieved higher levels of green product adoption than those to consumers.
Though NEV consumers have technology thresholds obviously, some studies verified the existence of the thresholds and their impacts on the demand for NEVs (Lee, 2011; Santos and Rembalski, 2021; Song et al., 2021). Eggers and Eggers found that when they adjusted the cruising range of electric vehicles from 250 km to 150 km in the model, the cumulative market share of electric cars dropped significantly from 8.2% to 1.3% after 10 years in the German market (Eggers and Eggers, 2011). Their results mean that most consumers can not accept electric vehicles with a range that does not meet demand. Hackbarth and Madlener found that German consumers are willing to pay extra money for an alternative fuel vehicle if a particular performance improvement meets their minimum requirements, such as reducing the charging time to less than 60 min (Hackbarth and Madlener, 2013). Neaimeh et al. found that consumers in the United States will refuse to buy an electric vehicle when the mileage cannot meet their needs for one-way travel (Neaimeh et al., 2017). Noel et al. also found that most consumers reject NEVs in Nordic if NEVs are not suitable for their traveling needs (Noel et al., 2020). However, these studies have paid no attention to the impacts of the technology thresholds of NEV consumers on the company’s R&D investment nor their impacts on the NEV product subsidy policy further.
3 Model development
3.1 Problem description
An NEV company with limited R&D funds plans to launch an NEV to the market. The technical level of an NEV is the level of technology or performance of an NEV developed by NEV enterprises. In order to make the contents and conclusions of this paper more general, we simplified the level of all technologies into an abstract technical level (Saha, 2014; Hong et al., 2021).
Consumers in the current market have typical characteristics of heterogeneous technology thresholds. If the NEV technology or performance does not meet the technology threshold of a consumer, they will not buy it because it has zero utility to them. In other words, only if the NEV technology or performance exceeds the consumer technology threshold may they buy it. For example, NEV consumers from the United States, the United Kingdom, and the 5 Nordic countries require that the NEV cruising range on a single charge is not less than their travel distance (Neaimeh et al., 2017; Noel et al., 2020).
Consumers in the current market also have heterogeneous technology references. Consumers’ technology preference θ is the degree how much different consumers favor the technology of an NEV, which can be understood as the worth or utilities per unit of NEV technology for heterogeneous consumers (Li J et al., 2019; Feng et al., 2020; Li et al., 2021b). For example, NEV consumers from the United States, the United Kingdom, and the 5 Nordic countries require that the NEV cruising range on a single charge is not less than their travel distance (Neaimeh et al., 2017; Noel et al., 2020).
To encourage NEV companies to increase their R&D investment and promote the NEV market development, the government decided to subsidize NEV companies. Every time a company sells an NEV, the government will give it a certain amount of product subsidies. The policy goal is to encourage companies to maximize their R&D investment, that is, to raise their NEV technology level to the current technical upper limit or invest all their R&D funds.
The decision-making sequence of the government and NEV companies is as follows: First, the government designs its product subsidy policy, including whether to subsidize and the unit subsidy. The government decisions need to consider consumer technology thresholds and technology preferences and the R&D capability and funds of NEV firms. Then, the enterprise decides its R&D investment strategies according to the factors the government considers above and the government subsidy and then determines the product price.
3.2 Model
Please refer to Table 1 for variable symbols and definitions.
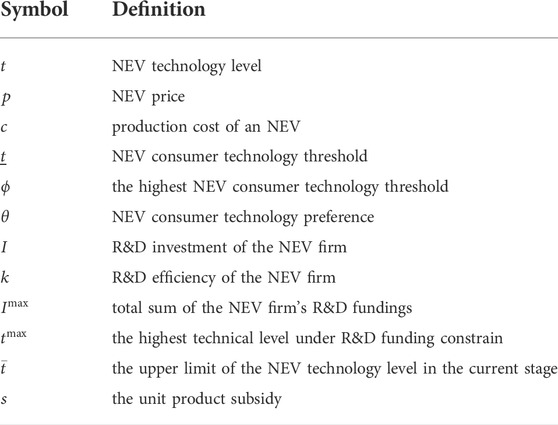
TABLE 1. Variable symbols and interpretation.
Consumer Decision. The current NEV consumers have heterogeneous technology thresholds
In other words, the consumer purchasing decision depends on whether they can obtain non-negative utility from purchasing an NEV. The consumer will buy an NEV if
NEV Demand. Without loss of generality, we let the market size be
From Eq. 1, only if an NEV can bring consumers non-negative utility, that is
Only both the technical threshold and the utility of consumers are satisfied, will consumers choose to buy an NEV. From Eq. 2, we can get the proportion of consumers whose technical threshold is reached
The Firm profits. We record the unit subsidy amount as
In order to show the characteristics that marginal utility of the R&D investment of enterprises decreases with their technical level on raising their technical level, authors select the commonly used R&D investment function as (Saha, 2014; Meng et al., 2020; Meng et al., 2022):
in Eq. 5, the NEV technical level
The enterprise revenues include product revenues
4 Model solution
In this section, it solves the optimal retreating product subsidy strategies of the government by the backward induction method.
Firstly, solve the optimal pricing strategies of NEV companies in the third stage of the game, and Proposition 1. is as follows:
Proposition 1. The optimal pricing strategy of NEV firms is
let Eq. 7 be 0, that is,
Q.E.DFrom Eq. 8 we know that the NEV firm’s optimal price depends on its technical level, the unit production cost and the unit subsidy. The optimal price increases with the NEV technical level. This is because the higher the NEV technical level, the higher their value to consumers, and the company can obtain higher profits by raising price.From Eq. 8, the optimal price also increases with the unit production cost of NEVs. This is because the higher the unit production cost, companies need to set higher prices for NEVs to gain profits.From Eq. 8, the optimal price decreases with the unit subsidy. This is because companies can achieve higher sales volume and obtain more product subsidies by lowering NEV price. Therefore, the higher the unit subsidy, firms are more motivated to lower NEV price.Moreover, since product subsidies from governments and the NEV unit production costs are both exogenous to the enterprise, the optimal pricing strategy of the NEV firm essentially depends on the company’s R&D investment in the second stage of the game. And the optimal price and the firm’s R&D investment determine the company’s maximum profit together. Therefore, by substituting the optimal pricing into the firm’s profit function, we can solve the optimal R&D investment strategies of NEV companies with different R&D funds and efficiency conditions. Secondly, solve the optimal technical level and R&D investment strategies of NEV companies in the game’s second stage.To keep Table 2 and the paper legible and concise, we replaced the boundary conditions of R&D efficiency and the specific value of R&D investment with
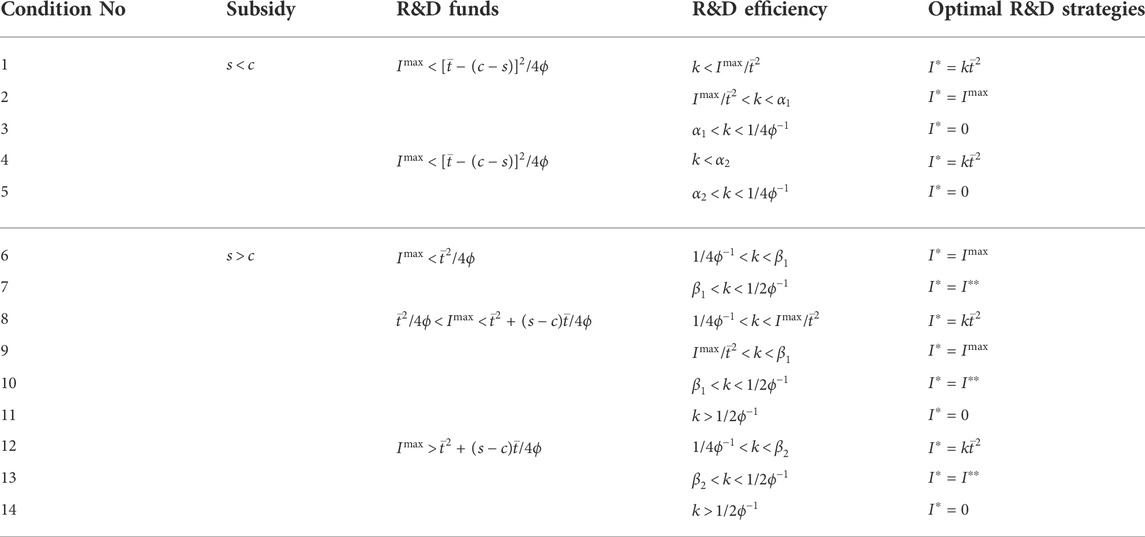
TABLE 2. The optimal R&D investment strategies under different conditions of product subsidies, R&D funds and R&D efficiency.
Proposition 2. The optimal R&D investment strategies of NEV firms with different conditions are as follows (please see Table 2.):
a) When
b) When
c) When
d) When

TABLE 3. The optimal retreating strategies of government for firms with different R&D funds and R&D efficiency conditions.
Proposition 3. The optimal retreating policies of the government for NEV firms with different conditions are as (please see Table 3.):
a) When
b) When
c) When
Proof of Proposition 3. Please see Supplementary Material for details.Q.E.DThe optimal amounts of the unit subsidy to NEV enterprises depend on their R&D funds and R&D efficiency conditions. Regardless of the different R&D funds of firms, if the R&D efficiency of the enterprise is high enough or very low, both optimal amounts of government subsidies are zero. For the former, even if the government does not provide support, they will still choose the highest technical level, which means that grants are unnecessary. For the latter, even if the government provides a high amount of subsidies, those firms will only dump low-tech and low price NEVs to earn grants and lack the will to pursue higher technical levels, which means that support is ineffective.For NEV firms with the medium R&D ability, the government can always increase the marginal benefits of technology of NEV firms by raising subsidy amounts, thereby incentivizing the firms to choose the highest technical level under financial or technical constraints. In other words, as long as the product subsidy amounts are high enough, the product subsidies achieve the most significant incentive effects. However, an increase in the product subsidy amounts will lead to a decrease in the subsidy efficiency. Therefore, the lowest subsidy amounts are the optimal retreating product subsidy amounts under the premise of ensuring the maximum incentive effects.
5 Incentive effect and efficiency and the impact of technology thresholds
This section discusses the incentive effect, efficiency, and application scope of the product subsidy policy and the impact of consumer technology thresholds on incentive effects and subsidy efficiency based on the optimal solution discussion in the previous section.
To make the paper legible and concise, from Table 3. denote the high R&D ability as
Proposition 4. The incentive effects and application scope of the product subsidy policy are as follows:
a) The application scope of the product subsidy policy applied to NEV firms with the medium R&D ability;
b) The optimal unit subsidy can encourage these firms to upgrade NEV technical level to the upper limit in the current stage or the highest under financial constraints.
The optimal unit subsidy depends on the firm’s R&D funds and R&D ability conditions. Companies with a high enough R&D ability always have a positive and increasing marginal profit of technologies and want to improve NEV technology. Improving technology increases the company’s product value and sales volume so that the product revenue increases sharply, exceeding the increase in R&D investment or costs. Still, financial or technical constraints prevent them from achieving their goals. In other words, product subsidies can not solve their problems and are unnecessary. In contrast, firms with low R&D ability rely on subsidies too much and are always reluctant to improve NEV technology. More directly, improving technology is not as economical as dumping NEVs at a low-tech and low price for firms. Companies always select to reduce their product price under subsidies, which makes the product subsidy policy inefficient in encouraging their R&D.For NEV firms with medium R&D efficiency, the government always has the optimal subsidy amounts, encouraging them to upgrade NEV technical level to the upper limit in the current stage or the highest under financial constraints. Because in both cases, product subsidies can increase the firm’s profit by increasing its technical marginal profit. One situation is that the technological marginal profit is rising, and the enterprise always chooses the highest technical level but cannot achieve profitability. A sufficiently high unit subsidy will enable the enterprise to achieve profitability at the highest technical level, and the subsidy policy achieves the maximum incentive effect. Another situation is that the technical marginal profit of the firm is negative and decreasing, and the firm is always reluctant to carry out R&D. At this time, the product subsidies increase the marginal profit at any technological level. They can further encourage the enterprise to choose the technical level where the technical marginal gain is reduced to zero. Therefore, as long as the government sets a high enough subsidy amount, NEV companies will choose the highest technical level as their R&D goals under financial and technical constraints.Let the subsidy efficiency as
Proposition 5. The optimal subsidy amounts decrease with the R&D ability of the firms, while the subsidy efficiency increases with them.Proof of Proposition 5. Take the derivative of
Substitute (8) into (4), take the derivative of
From the definition of
From Eq. 9–11, take the derivative of
Q.E.DIncreasing R&D abilities leads to higher marginal benefits of technologies of NEV firms. We still subdivide companies with medium R&D efficiency into ones with higher R&D efficiency and others with lower R&D efficiency. For the former, it has an increasing technical marginal profit. Still, it cannot make profits by carrying out R&D. The higher R&D ability makes the firm reach relatively high yields without product subsidies and allows it to achieve profitability with fewer product subsidies. Therefore, ones with higher R&D strength need lower optimal subsidy amounts.For the latter, the technical marginal profit of the firm is negative and decreasing, and the firm is always reluctant to carry out R&D. At this time, the higher R&D ability increases the marginal profit at any technological level without product subsidies. Because the optimal unit subsidy needs to be high enough so that the firm’s marginal profit at the highest technology level reaches zero, the higher the firm’s marginal profit at the highest technology level without subsidies, the lower the optimal unit subsidy.Furthermore, as the higher R&D abilities reduce the optimal subsidy amounts, and the lower subsidies still make firms select the highest technical level, the incentive effects are still the greatest, and the government gets a higher efficiency of product subsidies.
Proposition 6. The optimal subsidy amounts increase with the consumer technology thresholds, while the subsidy efficiency decreases.Proof of Proposition 6. Take the derivative of
Substitute (8) into (4), and take the derivative of
From (11), (13) and (14), take the derivative of
Q.E.DContrary to Proposition 5. increasing consumer technology thresholds leads to lower marginal benefits of technologies because higher thresholds reduce consumer demands for NEVs of the same technical levels. Therefore, we can easily explain why higher thresholds lead to higher optimal subsidy amounts and lower efficiency.
Corollary 1. The retreating product subsidy policy causes NEV companies with lower R&D ability to drop up R&D.Proof of Corollary 1. From Table 2. when
take derivation of
Q.E.D
When the government provides relatively low unit subsidies, companies with relatively high R&D capabilities will carry out R&D, and firms with relatively low R&D levels will give up R&D. The lower the unit subsidy, the higher the R&D strength of firms willing to carry out R&D. In other words, if unit subsidies continues to decrease, that is, the government implements the policy of retreating, companies with low R&D capabilities will give up R&D and withdraw from the market due to insufficient profits, and the product subsidy policy will play a role in picking winners.
6 Numerical simulation
In this section, we use an arbitrarily chosen numerical simulation to illuminate our model, including the optimal retreating subsidy amounts and the incentive effects for NEV companies with different R&D funds and efficiency, as well as the influence of consumer technology thresholds on the optimal subsidy amounts and efficiency.
① The optimal subsidy amounts and the incentive effects
Let the highest consumer technology threshold, the upper limit of technical level in the current stage, and the unit production cost be
Then, observe changes in the optimal amounts for firms with different conditions (please see Table 4.).
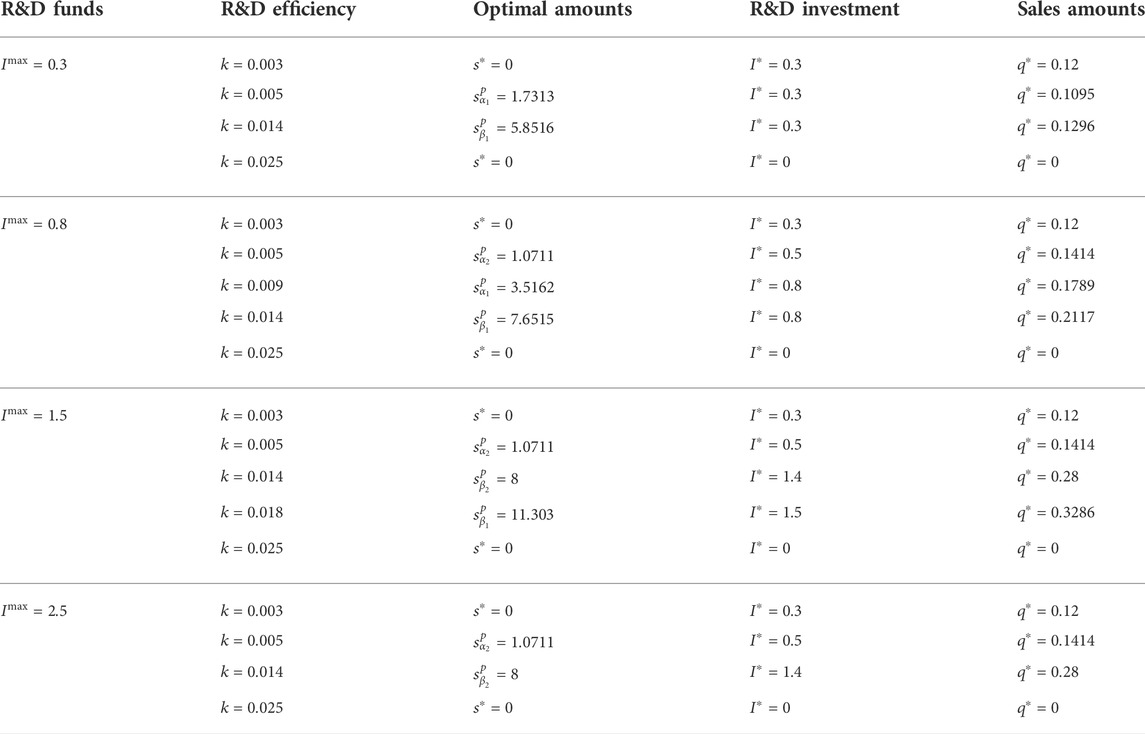
TABLE 4. The optimal unit subsidy and the incentive effects.
From Table 4. firstly, we found that as long as the R&D efficiency of the enterprise is high enough, such as
Then, for NEV firms with medium R&D efficiency, such as
Finally, when the firm’s R&D efficiency is high, such as
② The impacts of NEV consumer technology thresholds
We select the conditions of NEV firms as
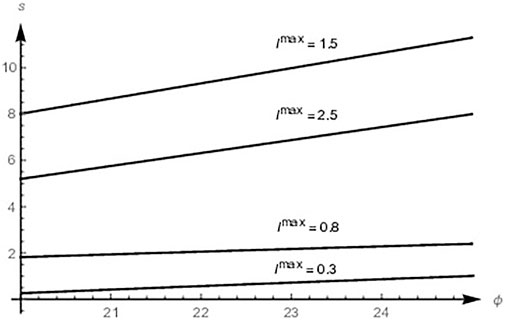
FIGURE 1. The influence of technology thresholds on the optimal subsidy strategies.
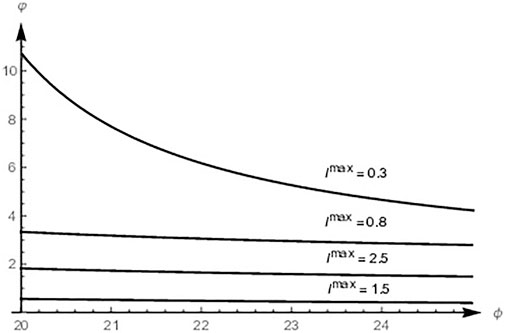
FIGURE 2. The influence of technology thresholds on the subsidy efficiency.
Figure 1 shows that the government has different optimal subsidy strategies for firms with various conditions, which continually increase with NEV consumer technology thresholds. Figure 2 shows that the subsidy efficiency for firms is also different, decreasing with the thresholds.
7 Conclusion
We built a three-stage sequential game model among the government, companies, and consumers based on consumer technology thresholds and preferences and obtained the government’s optimal retreating product subsidy policy through theoretical analysis and numerical simulation. We also discussed the incentive effect, efficiency, and application scope of product subsidy policies and the impacts of technology thresholds on them. Then, we responded to disputes over the retreating product subsidy policy and provided policy advice on the retreating policy.
We show: ① Product subsidies can only incentivize NEV firms with the medium R&D abilities and encourage them to upgrade NEV technical level to the upper limit in the current stage or the highest under financial constraints. Conversely, NEV firms with solid R&D capabilities do not need subsidies, and those with weak powers rely on subsidies too much, and the subsidies are ineffective for both. ② The optimal retreating policy should gradually reduce the unit subsidy with the improvement of the R&D ability of NEV firms. Enhancing R&D abilities makes NEV firms have higher marginal benefits of technologies leading to lower optimal unit subsidy and higher efficiency. ③ On the contrary, technology thresholds of NEV consumers increase the optimal unit subsidy and decrease the subsidy efficiency because they reduce the marginal benefits of technologies of NEV firms. ④ The retreating policy is a cherry-picking subsidy method. Since the retreating policy continues to reduce the marginal benefits of technologies, companies with lower R&D abilities are difficult to make profits and give up R&D and subsidies.
Policy advice: ① The government should provide the reasonable unit subsidy for NEV firms with medium R&D ability to encourage them to carry out R&D as much as possible and promote developments of NEV technology and market. ② The government should gradually reduce the unit subsidy until withdrawn with the improvement of the R&D ability of NEV firms. The retreating policy improves the incentive effects and subsidy efficiency from two aspects: cherry-picking potential NEV firms and reducing financial capital investment. ③ Considering technology thresholds of NEV consumers, the government should speed up the construction of NEV supporting facilities and cultivate consumer green awareness, thereby indirectly improving the current NEV technologies and lowering consumer technology thresholds.
Data availability statement
The original contributions presented in the study are included in the article/Supplementary Material, further inquiries can be directed to the corresponding author.
Author contributions
YW had the original idea for the study and developed the model. BH and YL made model analysis and numerical simulation. WM made suggestions on improving the model and the model analysis. YW and BH drafted the manuscript, which was revised by all authors.
Funding
This research is supported by the National Natural Science Foundation of China (No. 71573025), Chinese National Funding of Social Sciences (No. 17XGL008), the Fundamental Research Funds for the Central Universities (No. 2018CDXYJG0040), and the Natural Science Foundation of Chongqing (No. cstc2019jcyj-msxmX0616).
Acknowledgments
Thanks to Meng, Huang, and Li for their guidance and assistance in model analysis, model improvement, numerical simulation, and policy advice.
Conflict of interest
The authors declare that the research was conducted in the absence of any commercial or financial relationships that could be construed as a potential conflict of interest.
Publisher’s note
All claims expressed in this article are solely those of the authors and do not necessarily represent those of their affiliated organizations, or those of the publisher, the editors and the reviewers. Any product that may be evaluated in this article, or claim that may be made by its manufacturer, is not guaranteed or endorsed by the publisher.
Supplementary material
The Supplementary Material for this article can be found online at: https://www.frontiersin.org/articles/10.3389/fenrg.2022.959864/full#supplementary-material
References
Chakraborty, P., Parker, R., Hoque, T., Cruz, J., Du, L., Wang, S., et al. (2022). Addressing the range anxiety of battery electric vehicles with charging en route. Sci. Rep. 12, 5588–5615. doi:10.1038/s41598-022-08942-2
David, P., Hall, B., and Toole, A. (2000). Is public R&D a complement or substitute for private R&D? A review of the econometric evidence. Res. Policy 29, 497–529. doi:10.1016/s0048-7333(99)00087-6
Decarolis, F., Polyakova, M., and Ryan, S. P. (2020). Subsidy design in privately provided social insurance: Lessons from medicare Part D. J. POLITICAL Econ. 128, 1712–1752. doi:10.1086/705550
Deng, Z., and Tian, P. (2020). Are China's subsidies for electric vehicles effective? MDE. Manage. Decis. Econ. 41, 475–489. doi:10.1002/mde.3114
Eggers, F., and Eggers, F. (2011). Where have all the flowers gone? Forecasting green trends in the automobile industry with a choice-based conjoint adoption model. Technol. Forecast. Soc. Change 78, 51–62. doi:10.1016/j.techfore.2010.06.014
Feng, X., Huang, B., and Li, Y. Y. (2020). R&D investment in new energy vehicles with purchase subsidy based on technology adoption life cycle and customers choice behaviour. IET Intell. Transp. Syst. 14, 1371–1377. doi:10.1049/iet-its.2019.0649
Gao, Y., Hu, Y., Liu, X., and Zhang, H. (2021). Can public R&D subsidy facilitate firms’ exploratory innovation? The heterogeneous effects between central and local subsidy programs. Res. Policy 50, 104221–104316. doi:10.1016/j.respol.2021.104221
Guo, D., Guo, Y., and Jiang, K. (2018). Governance and effects of public R&D subsidies: Evidence from China. Technovation 74, 18–31. doi:10.1016/j.technovation.2018.04.001
Hackbarth, A., and Madlener, R. (2013). Willingness-to-Pay for alternative fuel vehicle characteristics: A stated choice study for Germany. Transp. Res. Part A Policy Pract. 85, 89–111. doi:10.1016/j.tra.2015.12.005
Hagspiel, V., Nunes, C., Oliveira, C., and Portela, M. (2021). Green investment under time-dependent subsidy retraction risk. J. Econ. Dyn. Control 126, 103936–104030. doi:10.1016/j.jedc.2020.103936
Harvey, L. D. D. (2020). Rethinking electric vehicle subsidies, rediscovering energy efficiency. Energy Policy 146, 111760–111813. doi:10.1016/j.enpol.2020.111760
Hong, I. H., Chiu, A. S. F., and Gandajaya, L. (2021). Impact of subsidy policies on green products with consideration of consumer behaviors: Subsidy for firms or consumers? Resour. Conservation Recycl. 173, 105669–105712. doi:10.1016/j.resconrec.2021.105669
Jung, S. H., and Feng, T. (2020). Government subsidies for green technology development under uncertainty. Eur. J. Operational Res. 286, 726–739. doi:10.1016/j.ejor.2020.03.047
Lee, C. Y. (2011). The differential effects of public R&D support on firm R&D: Theory and evidence from multi-country data. Technovation 31, 256–269. doi:10.1016/j.technovation.2011.01.006
Li C, C., Negnevitsky, M., Wang, X., Yue, W. L., and Zou, X. (2019). Multi-criteria analysis of policies for implementing clean energy vehicles in China. Energy Policy 129, 826–840. doi:10.1016/j.enpol.2019.03.002
Li J, J., Jiao, J., and Tang, Y. (2019). An evolutionary analysis on the effect of government policies on electric vehicle diffusion in complex network. Energy Policy 129, 1–12. doi:10.1016/j.enpol.2019.01.070
Li, Q., Wang, J., Cao, G., and Zhang, J. (2021a). Financial constraints, government subsidies, and corporate innovation. PLOS ONE 10, e0259642–24. doi:10.1371/journal.pone.0259642
Li, Y., Tong, Y., Ye, F., and Song, J. (2020). The choice of the government green subsidy scheme: Innovation subsidy vs. product subsidy. Int. J. Prod. Res. 58, 4932–4946. doi:10.1080/00207543.2020.1730466
Li, Y. Y., Huang, B., and Huang, H. (2021b). Product selection and pricing policy of assemble-to-order manufacturer based on heterogeneous demands. Comput. Integr. Manuf. Syst. 5, 1–19. doi:10.13196/j.cims.2022.07.030
Li, Z., Liao, G., Wang, Z., and Huang, Z. (2018). Green loan and subsidy for promoting clean production innovation. J. Clean. Prod. 187, 421–431. doi:10.1016/j.jclepro.2018.03.066
Liu, Y., Xu, H., and Wang, X. (2021). Government subsidy, asymmetric information and green innovation. Kybernetes 9, 1–23. ahead-of-print. doi:10.1108/k-05-2021-0422
Liu, Z., Hao, H., Cheng, X., and Zhao, F. (2018). Critical issues of energy efficient and new energy vehicles development in China. Energy Policy 115, 92–97. doi:10.1016/j.enpol.2018.01.006
Lou, J. W. (2016). Improve the fiscal policy, innovate the system and mechanism, and speed up the upgrading of the new energy automobile industry [Online]. Available: http://jjs.mof.gov.cn/gongzuodongtai/201601/t20160123_1656922.htm (Accessed June 2, 2022).
Ma, M. M., Meng, W. D., Li, Y. Y., and Huang, B. (2021). Supply chain coordination strategy for NEVs based on supplier alliance under dual-credit policy. PLOS ONE 16, e0257505. doi:10.1371/journal.pone.0257505
Melliger, M. A., van Vliet, O. P. R., and Liimatainen, H. (2018). Anxiety vs reality – sufficiency of battery electric vehicle range in Switzerland and Finland. Transp. Res. Part D Transp. Environ. 65, 101–115. doi:10.1016/j.trd.2018.08.011
Meng, W. D., Ma, M. M., Li, Y. Y., and Huang, B. (2022). New energy vehicle R&D strategy with supplier capital constraints under China's dual credit policy. Energy Policy 168, 113099–113108. doi:10.1016/j.enpol.2022.113099
Meng, W. D., Wang, Y., Li, Y. Y., and Huang, B. (2020). Impact of product subsidies on R&D investment for new energy vehicle firms: Considering quality preference of the early adopter group. PLOS ONE 15, e0236626–11. doi:10.1371/journal.pone.0236626
Nagy, R. L. G., Hagspiel, V., and Kort, P. M. (2021). Green capacity investment under subsidy withdrawal risk. Energy Econ. 98, 105259–105321. doi:10.1016/j.eneco.2021.105259
Neaimeh, M., Salisbury, S. D., Hill, G. A., Blythe, P. T., Scoffield, D. R., and Francfort, J. E. (2017). Analysing the usage and evidencing the importance of fast chargers for the adoption of battery electric vehicles. Energy Policy 108, 474–486. doi:10.1016/j.enpol.2017.06.033
Nie, H., Zhou, T., Lu, H., and Huang, S. (2021). Evaluation of the efficiency of Chinese energy-saving household appliance subsidy policy: An economic benefit perspective. Energy Policy 149, 112059–9. doi:10.1016/j.enpol.2020.112059
Noel, L., Rubens, G. Z. D., Kester, J., and Sovacool, B. K. (2020). Understanding the socio-technical nexus of nordic electric vehicle (ev) barriers: A qualitative discussion of range, price, charging and knowledge. Energy Policy 138, 111292–111315. doi:10.1016/j.enpol.2020.111292
Saha, S. (2014). Firm's objective function and product and process R&D. Econ. Model. 36, 484–494. doi:10.1016/j.econmod.2013.08.041
Santos, G., and Rembalski, S. (2021). Do electric vehicles need subsidies in the UK? Energy Policy 149, 111890–111927. doi:10.1016/j.enpol.2020.111890
Song, J., Zhang, H., and Su, Z. (2021). Environmental subsidies and companies’ environmental investments. Econ. Political Stud. 9, 477–496. doi:10.1080/20954816.2020.1760764
Wang, T. G., Xie, C., Xie, J., and Waller, T. (2016). Path-constrained traffic assignment: A trip chain analysis under range anxiety. Transp. Res. Part C Emerg. Technol. 68, 447–461. doi:10.1016/j.trc.2016.05.003
Wang, Y., Ding, W., Dai, L., Hu, H., and Jing, D. (2021). How would government subsidize the port on shore side electricity usage improvement? J. Clean. Prod. 278, 123893–123912. doi:10.1016/j.jclepro.2020.123893
Wu, P., Ma, J., and Guo, X. (2022). Efficiency evaluation and influencing factors analysis of fiscal and taxation policies: A method combining DEA-AHP and cd function. Ann. Oper. Res. 309, 325–345. doi:10.1007/s10479-021-04194-x
Xu, X. J., and Xu, X. L. (2021). The effect of subsidy reduction policy on listed firm's investment: Evidence from new-energy vehicles. Nankai Bus. Rev. 24, 213–226. doi:10.3969/j.issn.1008-3448.2021.03.021
Yang, R., Tang, W., and Zhang, J. (2021). Technology improvement strategy for green products under competition: The role of government subsidy. Eur. J. Operational Res. 289, 553–568. doi:10.1016/j.ejor.2020.07.030
Ye, R. K., Gao, Z. F., Fang, K., Liu, K. L., and Chen, J. W. (2021). Moving from subsidy stimulation to endogenous development: A system dynamics analysis of China's NEVs in the post-subsidy era. Technol. Forecast. Soc. Change 168, 120757–120810. doi:10.1016/j.techfore.2021.120757
Yu, G., Lin, Q., and Qi, X. (2021). Government incentive contracts for microgrid users. Energies 14, 994–1016. doi:10.3390/en14040994
Yuichi, T., Arefin, M. R., Masaki, T., and Tanimoto, J. (2021). Free ticket, discount ticket or intermediate of the best of two worlds – which subsidy policy is socially optimal to suppress the disease spreading? J. Theor. Biol. 520, 110682–110710. doi:10.1016/j.jtbi.2021.110682
Zhang, J., and Huang, J. (2021). Vehicle product-line strategy under government subsidy programs for electric/hybrid vehicles. Transp. Res. Part E Logist. Transp. Rev. 146, 102221–102226. doi:10.1016/j.tre.2020.102221
Zhang, L., Wang, L., and Chai, J. (2020). Influence of new energy vehicle subsidy policy on emission reduction of atmospheric pollutants: A case study of beijing, China. J. Clean. Prod. 275, 124069–124113. doi:10.1016/j.jclepro.2020.124069
Zhang, L., Xue, B., and Li, K. W. (2021). Assessing subsidy policies for green products: Operational and environmental perspectives. Int. Trans. Oper. Res. 29, 3081–3106. doi:10.1111/itor.13077
Zhang, X., Wang, K., Hao, Y., Fan, J. L., and Wei, Y. M. (2013). The impact of government policy on preference for NEVs: The evidence from China. Energy Policy 61, 382–393. doi:10.1016/j.enpol.2013.06.114
Keywords: new energy vehicle, retreating product subsidy policy, consumer technology thresholds, incentive effects, subsidy efficiency
Citation: Wang Y, Meng W, Huang B and Li Y (2022) Study of the retreating product subsidy policy based on technology thresholds of new energy vehicle consumers. Front. Energy Res. 10:959864. doi: 10.3389/fenrg.2022.959864
Received: 02 June 2022; Accepted: 25 July 2022;
Published: 30 August 2022.
Edited by:
Muhammad Imran Khan, CECOS University of Information Technology and Emerging Sciences, PakistanReviewed by:
Borliang Chen, National United University, TaiwanJun Tanimoto, Kyushu University, Japan
Copyright © 2022 Wang, Meng, Huang and Li. This is an open-access article distributed under the terms of the Creative Commons Attribution License (CC BY). The use, distribution or reproduction in other forums is permitted, provided the original author(s) and the copyright owner(s) are credited and that the original publication in this journal is cited, in accordance with accepted academic practice. No use, distribution or reproduction is permitted which does not comply with these terms.
*Correspondence: Bo Huang, aHVhbmdib0BjcXUuZWR1LmNu