 Chao Yang
 Binghao He
 Huanxin Liao
 Jiaqi Ruan
 Junhua Zhao
94% of researchers rate our articles as excellent or good
Learn more about the work of our research integrity team to safeguard the quality of each article we publish.
Find out more
ORIGINAL RESEARCH article
Front. Energy Res. , 26 August 2022
Sec. Smart Grids
Volume 10 - 2022 | https://doi.org/10.3389/fenrg.2022.959786
This article is part of the Research Topic Planning and Operation of Integrated Energy Systems with Deep Integration of Pervasive Industrial Internet-of-Things View all 11 articles
The rapid development of the Industrial Internet-of-Things extends demand response (DR) research to the aspect of low-carbon emission in smart grids. This study proposed the concept of low-carbon DR (LCDR) in the electricity market as well as the price-based LCDR mechanism and its model. First, carbon cost conduction from the generation side to the demand side was analyzed, and then conduction function was quantifiably deduced. Second, the mechanism and model of price-based LCDR were proposed by considering three DR signals, namely, the electricity price, carbon price, and carbon emission intensity of the demand side, based on the traditional price-based DR (PBDR) mechanism. Third, the proposed LCDR mechanism was applied to the environmental–economic dispatch optimization problem. At last, case studies on the modified IEEE 39-bus system verified that the LCDR mechanism can reduce carbon emissions while maintaining the function of the traditional PBDR. Meanwhile, the applicability of LCDR was illustrated based on carbon emission sensitivity to LCDR model parameters. The proposed mechanism can guide participants in the electricity market in reducing electricity carbon emissions.
The application of Industrial Internet-of-Things (IIoTs) (Sisinni et al., 2018) brings advanced measurement and communication technologies to the power grid, such as cyber networks (Sridhar et al., 2012) and smart meters (Depuru et al., 2011), making the power grid smarter than ever. The extensive use of smart equipment significantly enhances the observability and controllability of the demand side in the smart grid and provides strong hardware and data support for the development of demand response (DR) (Chen et al., 2020). DR refers to “changes in electric usage by customers from their normal consumption patterns in response to changes in the price of electricity over time, or to incentive payments designed to induce lower electricity use at times of high wholesale electricity market prices or when system reliability is jeopardized” (Siano, 2014).
At present, carbon emission reduction has achieved a global consensus (United Nation, 2021). As consumption terminals, the power consumers in the demand side should undertake their carbon reduction responsibility. Based on DR, consumers can change their load in time and space with their power suppliers from high- to low-carbon emission generators, resulting in carbon emission reduction. In this context, DR can play a vital role in carbon neutrality based on the IIoTs.
By widely using smart meters, the energy consumption of the demand side can be effectively monitored. Using high-frequency meter data, more accurate characteristics of loads and carbon emissions can be obtained. Based on the advanced cyber networks, the consumers can receive more accurate and timely DR signals (Albadi and El-Saadany, 2007) from independent system operators or dispatching departments. These signals include electricity price, electricity carbon emission intensity (CEI), incentives, and control instructions. As a result, consumers can achieve carbon emission reduction (Stoll et al., 2014), which is beneficial for themselves and the power grid, by reducing their carbon consumption.
DR programs generally include the price-based demand response (PBDR) (Conejo et al., 2010) and the incentive-based DR (IBDR) (Lu and Hong, 2019). In PBDR programs, consumers respond to real-time prices based on the demand elasticity model (Kirschen et al., 2000) and modify their demands by shaving/shifting flexible load from peak times into valley times to flatten load curves. PBDR programs are usually applied to the day-ahead and real-time market clearing (Wu, 2013; (Li et al., 2022), economic dispatching (Dehnavi and Abdi, 2016), and power grid planning (Wang et al., 2020). A successful PBDR can help the power market set efficient electricity prices, improve economic efficiency, and reduce environmental costs and carbon emissions.
At present, carbon emission costs (Gillenwater and Breidenich, 2009) have been internalized into the electricity market. It is generally considered that carbon emission costs are directly included in the generation side (Newcomer et al., 2008). Through market clearing, carbon emission costs can be conducted from the generation side to demand side, accompanied by the increase in electricity prices (Wook et al. (2010); Panagiotis et al. (2021)). The energy consumption price that consumers pay becomes the integrated electricity–carbon price. Thus, the PBDR needs to take carbon emission costs into account; moreover, research on PBDR should be extended to the field of low-carbon emission.
Recent research on low-carbon–oriented PBDR mostly focuses on the impact of traditional PBDR programs on carbon emissions. He et al., (2020) proposed an environmental–economic dispatch (EED) model with a price-based integrated DR program considering the carbon trading scheme. In the study by Zeng et al. (2014), PBDR is used for planning distribution systems in a transition toward low-carbon sustainability. A new piecewise linear approximation method for calculating carbon emission factors was proposed by Fleschutz et al. (2021) to quantify the effect of PBDRs on operational carbon emissions in European countries. Song et al. (2014) and Dahl and Petersen (2016) developed new simulation models to investigate the joint influence of price and CO2 signals in DR programs. However, existing research still have major problems. First, there is no clear analysis of the conduction process of carbon emission costs from the generation side to the demand side, making it difficult to quantify carbon emission costs for the demand side. Second, there is a lack of low-carbon–oriented DR mechanism to achieve better carbon emission reductions.
Therefore, this study proposed the concept of LCDR as well as the price-based LCDR mechanism considering the conduction of carbon emission costs in the smart grid. The main contributions of this study are as follows:
1) Quantified carbon emission cost conduction from the generation side to the demand side in the wholesale electricity market and deduced electricity carbon emission cost function and carbon emission cost conductivity (CECC) in the demand side.
2) Proposed the price-based LCDR mechanism and its model, which integrates three DR signals, namely, electricity price, carbon price, and CEI of the demand side.
3) Established an EED model considering the price-based LCDR model to verify the proposed mechanism and analyzed the applicability of the mechanism based on the sensitivity of carbon emission to the three main parameters of the LCDR model.
The remainder of the paper is organized as follows. Section 2 quantifies carbon emission cost conduction in the wholesale electricity market. Section 3 proposes the price-based LCDR mechanism and its corresponding model. Section 4 establishes an EED optimization model considering the LCDR mechanism. Section 5 presents case studies to show the function of carbon emission reduction in the LCDR mechanism and its application scenarios.
In general, carbon emission cost is internalized into electricity cost and directly included in the generation side. It is directly passed to the demand side in the wholesale electricity market, resulting in the increase in electricity prices. According to the operation characteristic of the power grid and the market clearing method, the additional carbon emission cost per unit of electricity consumption is different. That is, each node in the power grid has a different CECC.
Therefore, this study proposed a quantified analysis method for carbon emission cost conduction including three parts: 1) the carbon emission cost of electricity consumption, 2) the clearing mechanism of the electricity market, 3) the electricity CEI of the demand side.
Carbon price in the carbon trading market offers a generally accepted reference price for market participants, which can be used to calculate carbon emission cost. In general, carbon emission cost (Zhang et al., 2016) is the product of carbon price and carbon emissions:
In the power grid, the carbon emission cost generated by power production and consumption can be accurately calculated using real-time carbon price, electricity CEI, and electricity power, benefiting from advanced smart meters:
where et and Pt are determined by the physical characteristic and the market clearing mechanism of the power grid.
When demand-side loads are determined, the market clearing mechanism determines the operation state and output of the generator.
The security-constrained economic dispatch (Jabr et al., 2000) is a general spot market clearing model. The purpose of this model is to maximize the social welfare of power grids over a period of time. It needs to meet a series of physical operational constraints of the power grid. In general, the time period is divided into multiple time steps in the economic dispatch model. Then, the scheduling result of each time step is calculated using the optimal power flow (OPF) model (Dommel and Tinney, 1968). The OPF model aims to minimize the short-term generation costs, calculate the output of each generator, and determine the electricity price for consumers using the well-known locational marginal price method (Kirschen and Strbac, 2004). Using the obtained market clearing results, the electricity carbon emissions of generators and consumers can be calculated as follows:
where eG is a performance parameter for generators, which is supplied by generator producers.
It can be seen that with a certain load and carbon price, the carbon emission cost of a consumer is only determined by eD,t. Thus, eD,t can quantify carbon costs conducted from the generation side to the demand side. Therefore, the solution of eD,t is the key problem. The solution contains two parts, namely, the operation condition problem and the market clearing mechanism of the power grid. Based on the market clearing results, the carbon emission flow (CEF) method (Zhou et al., 2015) is introduced to calculate ed,t at time t in this study, which is presented in detail in the following section.
The introduced CEF model can track the footprint of carbon emissions accompanying power flow in the power grid. Then, the consumers’ real-time electricity CEI can be calculated, and from which generator carbon emissions are coming at a certain time can be determined. According to Zhou et al. (2015), the electricity CEI of nodes can be calculated as follows:
where eD,t and RC,t are N-dimensional column vectors, PD,t and
We further derived the carbon emission cost conduction function for electricity consumptions and the equivalent conducted carbon price for demand-side consumers according to Eqs. 2 and 5:
Based on this, the concept of CECC was proposed in this study. The nodal CECC of the ith node is expressed as follows:
Based on the economic theory, the elasticity coefficient is generally used to describe the change rate between consumers’ demand and price (Conejo et al., 2010) in PBDR programs, which is expressed as follows:
When t equals τ, εt,t is defined as a negative self-elasticity. On the contrary, εt,τ is defined as a positive cross-elasticity. By introducing the multiperiod linear elastic load model, the response load amount is expressed as follows:
This study proposed a price-based LCDR model considering two factors that impact the demand of consumers, such as the integrated electricity–carbon price and the nodal CEI of the demand side.
First, consumers make demand changes in response to the integrated price that includes electricity and carbon costs conducted from the generation side. According to Eq. 11, the first part of the DR amount on the ith node is as follows:
Then, consumers continue to carry out the low-carbon response to their nodal CEIs. By translating the impact of CEIs into carbon costs, the second part of the DR amount is expressed as follows:
The detailed derivation of Eq. 13 is presented in the Appendix. Based on Eqs. 12 and 13, the total DR amount of the LCDR is derived as follows:
Furthermore, when using the single-period elastic load model (Zeng et al., 2014) for simplicity, the relevant parts of εi,t,τ in Eq. 14 can be omitted. At last, the designed LCDR model is expressed as follows:
The EED model determines the operation state of power grids and the three DR signals. Thus, the proposed price-based LCDR is studied based on the EED model.
The EED optimization model aims to minimize short-term generation costs within 1 day in this study. Generation costs are the sum of fuel and carbon emission costs, which is expressed as follows
where the fuel and carbon emission cost functions of thermal and gas generators are calculated as follows:
The short-term generation costs of renewable power plants, such as wind and solar powers, are assumed to be zero. The uncertainty and randomness of their outputs are also ignored in this study. Moreover, DR costs are not taken into account in the objective function. It supposes that there are no free carbon emission quotas for participants, such as electricity suppliers and consumers, in the electricity market in this study. That is, all electricity carbon emission costs must be paid based on the carbon price.
The proposed EED model should meet the following equality and inequality constraints.
The power grid–related constraints are expressed as follows:
The price-based LCDR-related constraints are as follows:
Constraints (19–25) impose the power grid–related constraints. Equation 19 ensures the power balance, and Eq. 20 calculates the direct current power flow in branch l, where θ and PInj are N-dimensional column vectors, and B is an N × N-level matrix. Constraint (21) denotes the capacity limits of the power flow in branches, constraints (22) and (23) denote up and down output limits and generation ramping limits for generators, and constraints (24) and (25) are output limits for wind and solar power plants, respectively.
Equation 15 and constraints (26–28) explain the LCDR-related constraints. Equation 15 calculates the response load ΔPD,i,t of consumers, which is mainly influenced by three DR signals. ΔPD,i,t is the controllable variable of the demand side. Constraint (26) indicates the total load of consumers after the LCDR, constraint (27) sets limits on the amount of load shifting, and constraint (28) considers the total demand energy that remains unchanged within 1 day.
In addition,
In parallel,
Furthermore,
The proposed EED model was simulated on a modified IEEE 39-bus system. Three cases were used to verify the superiority of the proposed price-based LCDR mechanism in the carbon emission reduction:
Case 1:. EED model without DR as the benchmark.
Case 2:. EED model with PBDR based on the integrated electricity–carbon price.
Case 3:. EED model with the proposed price-based LCDR based on the integrated electricity–carbon price and nodal CEI.The proposed EED optimization model can be established as an MINLP problem and solved using a modified MATLAB-MOST solver (Zimmerman et al., 2011).
The modified IEEE 39-bus system is shown in Figure 1, which includes four thermal generators, four gas generators, two hydropower generators, one wind power plant, and one solar power plant.
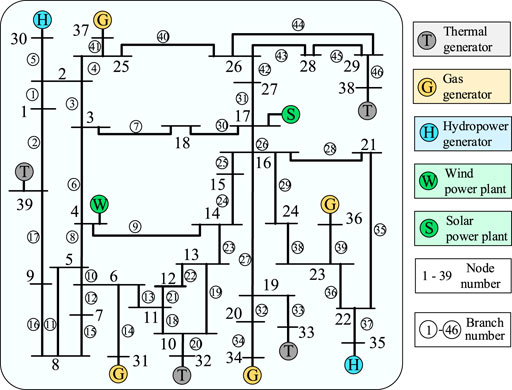
FIGURE 1. The modified IEEE 39-bus system.
Table 1 shows the detailed parameters of these generators and power plants, such as the type, rated active power, ramping rate, generation CEI, and short-term generation cost coefficients (U.S. Energy Information Administration, 2020). The wind and solar plants are placed on nodes 4 and 17, respectively, and their predicted output profiles are taken from Lee et al. (2021), as shown in Figure 2.

TABLE 1. Parameters of generators and power plants in the modified IEEE 39-bus system.
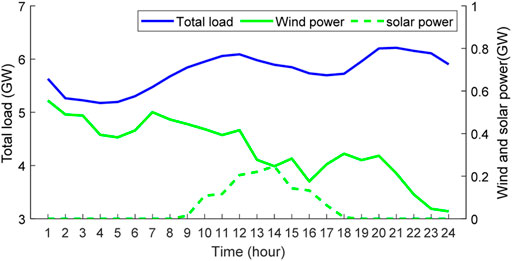
FIGURE 2. Typical profiles of load, wind power, and solar power.
The hourly load data within a day were selected from an open-source synthetic representation of the Electric Reliability Council of Texas power grid (Wu et al., 2021). It was assumed that the load profiles are of the same typical waveform for each node in this study. The load amount of each node was set to 0.9 times the original data in the IEEE 39-bus benchmark system to better show the effect of the proposed LCDR mechanism. The total demand-side energy remained at 138.31 GW h throughout the studied day.
The values of self-elasticity coefficients of the demand side at different hours were set to −0.2 (Jin et al., 2013). The maximum DR amount of consumers participating in DR programs was both 20%, that is, the value of
The hourly results of the EED with the proposed LCDR model are illustrated in Figure 3, which include the hourly generation power composition, electricity consumption costs, and carbon emissions of the power grid. The results shows that terminal and gas generators output more power in the time periods of larger load, and there were higher average costs and ACEIs for the power grid.
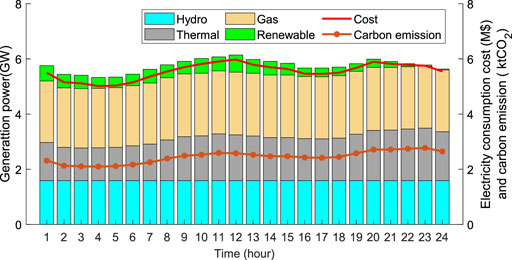
FIGURE 3. Hourly results of the environmental–economic dispatch (EED) with the proposed low-carbon demand response (LCDR) model.
The results of these three cases are shown in Table 1. Both the proposed LCDR and the PBDR reduced the electricity consumption costs of the demand side and the carbon emissions of the power grid. The reductions caused by the LCDR were more significant than those caused by the PBDR. In particular, carbon emissions based on the LCDR were reduced by 0.63% (376 tCO2) in a day, which can accumulate into a large reduction amount in a long term. In addition, the electricity consumption costs were reduced by 0.53% with the LCDR, which was also better than the PBDR.
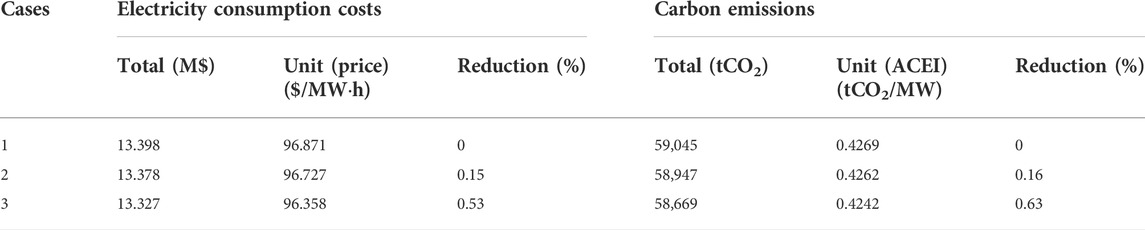
TABLE 2. Comparison of electricity consumption costs and carbon emissions of the demand side for cases 1, 2, and 3.
Figure 4 presents the hourly total load, hourly average integrated price of the demand side, and hourly ACEI curves of the power grid for cases 1, 2, and 3. The curve trends of the load, price, and ACEI are basically the same. The price and the ACEI both increase with the increase in load. However, they decrease when the wind and solar powers are high.
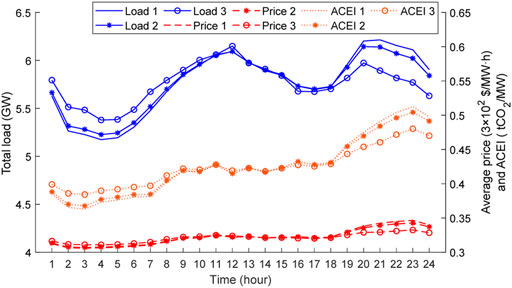
FIGURE 4. Hourly total load, integrated price, and average carbon emission intensity (ACEI) curves for cases 1, 2, and 3
It can be observed from the three load curves that consumers mainly respond in the valley periods between 1:00 and 7:00 and the peak periods between 19:00 and 24:00 in case 1. Compared with the PBDR, the LCDR can cause a large range and quantity of load shifting by responding to the integrated price and nodal CEI. The reference values of price and CEI are low from 1:00 to 7:00 and high from 19:00 to 24:00. These lead to large demand changes as consumers pursue lower carbon emissions and electricity consumption costs based on Eq. 15 when implementing the LCDR. For example, the peak time of the load without DR occurs at 21:00, whereas it shifts to 12:00 with LCDR in case 3. Similar LCDR characteristics and demand changes can also be illustrated by the load, integrated price, and nodal CEI curves of node 7, as shown in Figure 5.
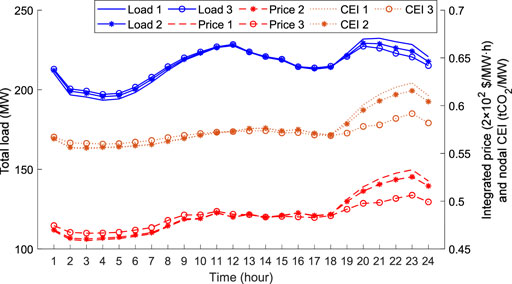
FIGURE 5. Hourly load, integrated price, and nodal carbon emission intensity (CEI) curves of node 7 for cases 1, 2, and 3
This study also analyzed the applicability of the proposed LCDR mechanism. Three variables that mainly affect the carbon emission reduction ability of the LCDR model were selected for carbon emission sensitivity analysis. The variables included carbon price, DR participation ratio of consumers, and the proportion of renewable power to total power. The carbon price was from $5 to $70 at intervals of $5, the DR participation ratio was from 5 to 50% at intervals of 5%, and the proportion of renewable power was from 10 to 80% at intervals of 10%, respectively.
Carbon emission reductions with the change in the aforementioned three variables of case 3 compared with case 1 are shown in Figure 6, Figure 7, and Figure 8, respectively. Figure 6 demonstrates that carbon emission reduction initially increases with the increase in carbon price, then begins to decrease when carbon price exceeds $50, and finally becomes 0. It is evident that only appropriate carbon prices can incent consumers to reduce carbon emissions positively when implementing LCDR programs. At low carbon prices, consumers do not pay enough attention to nodal CEI. Load shifting causes power to transfer from low- to high-CEI generators, leading to an increase in carbon emissions. At high carbon prices, carbon costs become the main part of electricity consumption costs, and low-CEI generators have priority to output more power. The power transfer caused by the LCDR is mainly between high-CEI thermal generators; thus, the emission reduction is very negligible.
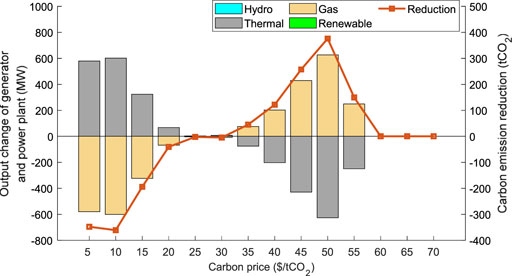
FIGURE 6. Carbon emission reductions and output changes of generators and power plants with different carbon prices.
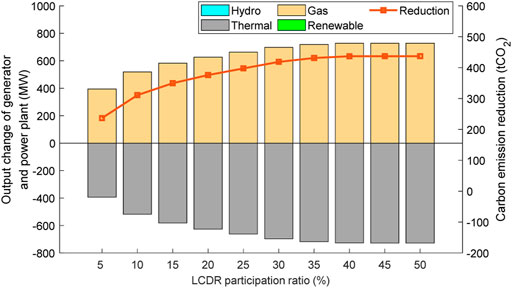
FIGURE 7. Carbon emission reductions and output changes of generators and power plants with different LCDR participation ratios.
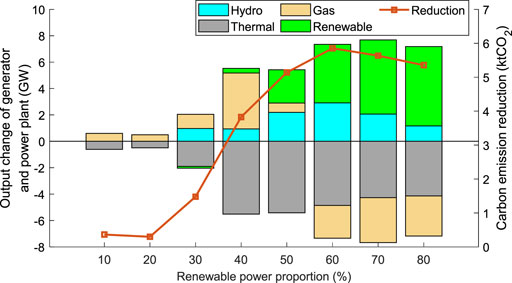
FIGURE 8. Carbon emission reductions and output changes of generators and power plants with different renewable power proportions.
The relationship between carbon emission reduction and LCDR participation ratio is shown in Figure 7. With the increase in the participation ratio, carbon reduction gradually increases, but the marginal reduction decreases and finally becomes 0. The maximum reduction is 436.83 tCO2 when the ratio reaches 45%. It shows that only appropriate LCDR participation ratios can effectively reduce carbon emissions. Extensive flexible load participating in the LCDR induces limited reductions. This is because when the reference price and CEI remain unchanged, the maximum DR abilities of consumers are fixed. With the increase in LCDR participation ratios, the abilities of consumers are gradually released until their maximum values are reached and they stop growing.
We added several renewable power plants to analyze the sensitivity of carbon emissions to renewable power proportions. There are three more wind power plants located at nodes 1, 12, and 23 and two more solar power plants located at nodes 8 and 26. The different renewable power proportions were obtained by changing the outputs of all wind and solar plants. Figure 8 demonstrates that carbon emission reductions initially increase and then decrease with the increase in power proportions. This is because when proportions increase at an early period, the power transferred from high- to low-CEI generators or power plants continues to grow, resulting in increased reductions. Then, when proportions become very large, the outputs of renewable plants become very high. On the contrary, the outputs of carbon emission–produced generators continue to decrease, resulting in decreased carbon reductions.
Benefiting from the development of IIoTs in the smart grid, this study proposed a price-based LCDR mechanism based on the integrated electricity–carbon price and CEI signals. Then, the LCDR mechanism was verified using the EED optimization model. Four main conclusions were drawn based on the case study simulation: 1) Compared with traditional PBDRs, appropriate LCDR programs can incent the demand side to positively reduce electricity carbon emissions. 2) The carbon price needs to be suitable for the current stage of the low-carbon transformation of power grids. Just with appropriate carbon prices can consumers effectively reduce carbon emissions by DR. 3) As the LCDR participation ratio increases, the marginal benefit for carbon emission reduction decreases. 4) With the increase in the renewable power proportion, carbon emission reductions caused by the LCDR initially increase and then decrease.
The proposed quantification method for carbon emission cost conduction in the power grid can be extended to IBDR and other fields in the electricity market. This study ignored the impact of consumers’ utility function and also did not consider the DR costs, uncertainty of renewable power output, and change in daily carbon price. Therefore, further research on the LCDR considering the aforementioned issues needs to be conducted.
The original contributions presented in the study are included in the article/supplementary material; further inquiries can be directed to the corresponding author.
CY conceived the overall structure and framework of the article, proposed the research methods, and wrote the manuscript. BH wrote the code for experiments. HL and JR helped write the manuscript with constructive discussions. JZ provided guidance, supervision, and funding support for the manuscript.
This work is partially supported by the National Natural Science Foundation of China under Grant 72171206, the Guangdong Regional Joint Fund-Youth Fund under Grant 2021A1515110084, and the Shenzhen Institute of Artificial Intelligence and Robotics for Society.
The authors declare that the research was conducted in the absence of any commercial or financial relationships that could be construed as a potential conflict of interest.
All claims expressed in this article are solely those of the authors and do not necessarily represent those of their affiliated organizations, or those of the publisher, the editors, and the reviewers. Any product that may be evaluated in this article, or claim that may be made by its manufacturer, is not guaranteed or endorsed by the publisher.
Albadi, M. H., and El-Saadany, E. F. (2007). Demand response in electricity markets: An overview. Tampa, FL, USA, Jul: IEEE Power Engineering Society General Meeting, 1–5.
Chen, Y., Feng, X., Li, Z., Xu, Y., and Miragha, A. (2020). Multi-stage coordinated operation of a multi-energy microgrid with residential demand response under diverse uncertainties. Energy Convers. Econ. 1 (1), 20–33. doi:10.1049/enc2.12002
Conejo, A. J., Morales, J. M., and Baringo, L. (2010). Real-time demand response model. IEEE Trans. Smart Grid 1 (3), 236–242. doi:10.1109/tsg.2010.2078843
Dahl, K. M., and Petersen, S. (2016). Demand response potential of model predictive control of space heating based on price and carbon dioxide intensity signals. Energy Build. 125, 196–204. doi:10.1016/j.enbuild.2016.04.053
Dehnavi, E., and Abdi, H. (2016). Optimal pricing in time of use demand response by integrating with dynamic economic dispatch problem. Energy 109, 1086–1094, Aug. doi:10.1016/j.energy.2016.05.024
Depuru, S. S. S. R., Wang, L., Devabhaktuni, V., and Gudi, N. (2011). Smart meters for power grid — challenges, issues, advantages and status,” 2011. Phoenix, AZ, USA: IEEE/PES Power Systems Conference and Exposition, 1–7.
Dommel, H. W., and Tinney, W. F. (1968). Optimal power flow solutions. IEEE Trans. Power Apparatus Syst. (10), 1866–1876. doi:10.1109/tpas.1968.292150
Fleschutz, M., Bohlayer, M., Braun, M., Henze, G., and Murphy, M. D. (2021). The effect of price-based demand response on carbon emissions in European electricity markets: the importance of adequate carbon prices. Appl. Energy 295, 117040. doi:10.1016/j.apenergy.2021.117040
Gillenwater, M., and Breidenich, C. (2009). Internalizing carbon costs in electricity markets: using certificates in a load-based emissions trading scheme. Energy Policy 37 (1), 290–299. doi:10.1016/j.enpol.2008.08.023
He, L., Lu, Z., Geng, L., Zhang, J., Li, X., Guo, X., et al. (2020). Environmental economic dispatch of integrated regional energy system considering integrated demand response. Int. J. Electr. Power & Energy Syst. 116, 105525. doi:10.1016/j.ijepes.2019.105525
Jabr, R. A., Coonick, A. H., and Cory, B. J. (2000). A homogeneous linear programming algorithm for the security constrained economic dispatch problem. IEEE Trans. Power Syst. 15 (3), 930–936. doi:10.1109/59.871715
Jin, S., Botterud, A., and Ryan, S. M. (2013). Impact of demand response on thermal generation investment with high wind penetration. IEEE Trans. Smart Grid 4 (4), 2374–2383. doi:10.1109/tsg.2013.2278882
Kirschen, D. S., Strbac, G., Cumperayot, P., and de Paiva Mendes, D. (2000). Factoring the elasticity of demand in electricity prices. IEEE Trans. Power Syst. 15 (2), 612–617. doi:10.1109/59.867149
Lee, K., Geng, X., Sivaranjani, S., Xia, B., Ming, H., Shakkottai, S., et al. (2021). Targeted demand response for mitigating price volatility and enhancing grid reliability in synthetic texas electricity markets. IScience 25 (2), 103723. doi:10.1016/j.isci.2021.103723
Li, J., Xu, D., Wang, J., Zhou, B., Wang, M., and Zhu, L. (2022). P2P multi-grade energy trading for heterogeneous distributed energy resources and flexible demand. IEEE Transactions on Smart Grid. (Early Access). [Online]. Available at: https://ieeexplore.ieee.org/abstract/document/9792462.
Lu, R., and Hong, S. H. (2019). Incentive-based demand response for smart grid with reinforcement learning and deep neural network. Appl. energy 236, 937–949. doi:10.1016/j.apenergy.2018.12.061
Newcomer, A., Blumsack, S. A., Apt, J., Lave, L. B., and Morgan, M. G. (2008). Short run effects of a price on carbon dioxide emissions from U.S. electric generators. Environ. Sci. Technol. 42 (9), 3139–3144. doi:10.1021/es071749d
Panagiotis, A., Biskas, P., and Liberopoulos, G. (2021). Evaluating the cost of emissions in a pool-based electricity market. Appl. Energy 298, 117253. doi:10.1016/j.apenergy.2021.117253
Siano, P. (2014). Demand response and smart grids—a survey. Renew. Sustain. energy Rev. 30, 461–478. doi:10.1016/j.rser.2013.10.022
Sisinni, E., Saifullah, A., Han, S., Jennehag, U., and Gidlund, M. (2018). Industrial internet of things: Challenges, opportunities, and directions. IEEE Trans. Ind. Inf. 14 (11), 4724–4734, Nov. doi:10.1109/tii.2018.2852491
Song, M., Alvehag, K., Widén, J., and Parisio, A. (2014). Estimating the impacts of demand response by simulating household behaviours under price and CO2 signals. Electr. power Syst. Res. 111, 103–114. doi:10.1016/j.epsr.2014.02.016
Sridhar, S., Hahn, A., and Govindarasu, M. (2012). Cyber–physical system security for the electric power grid. Proc. IEEE 100 (1), 210–224. doi:10.1109/jproc.2011.2165269
Stoll, P., Brandt, N., and Nordström, L. (2014). Including dynamic CO2 intensity with demand response. Energy Policy 65, 490–500. doi:10.1016/j.enpol.2013.10.044
United Nation (2021). Report of the conference of the parties on its twenty- sixth session, held in glasgow from 31 october to 13 november 2021. Part one: Proceedings,” UNFCCC. Conference of the parties. Glasgow, UK: Session and meeting reports.COP 26, Nov
U.S. Energy Information Administration, (2020). Capital cost and performance characteristic estimates for utility scale electric power generating technologies. Washington, DC: U.S. Department of Energy. [Online]. Available at: https://www.eia.gov/analysis/studies/powerplants/capitalcost/pdf/capital_cost_AEO2020.pdf.
Wang, Y., Qiu, J., Tao, Y., and Zhao, J. (2020). Carbon-oriented operational planning in coupled electricity and emission trading markets. IEEE Trans. Power Syst. 35 (4), 3145–3157, Jul. doi:10.1109/tpwrs.2020.2966663
Wook, K., Chattopadhyay, D., and Park, J. (2010). Impact of carbon cost on wholesale electricity price: a note on price pass-through issues. Energy 35 (8), 3441–3448, Aug. doi:10.1016/j.energy.2010.04.037
Wu, D., Zheng, X., Xu, Y., Olsen, D., Xia, B., Singh, C., et al. (2021). An open-source extendable model and corrective measure assessment of the 2021 texas power outage. Adv. Appl. Energy 4, 100056. doi:10.1016/j.adapen.2021.100056
Wu, L. (2013). Impact of price-based demand response on market clearing and locational marginal prices. IET Gener. Transm. Distrib. 7 (10), 1087–1095. doi:10.1049/iet-gtd.2012.0504
Zeng, B., Zhang, J., Yang, X., Wang, J., Dong, J., Zhang, Y., et al. (2014). Integrated planning for transition to low-carbon distribution system with renewable energy generation and demand response. IEEE Trans. Power Syst. 29 (3), 1153–1165. doi:10.1109/tpwrs.2013.2291553
Zhang, N., Hu, Z., Dai, D., Dang, S., Yao, M., Zhou, Y., et al. (2016). Unit commitment model in smart grid environment considering carbon emissions trading. IEEE Trans. Smart Grid 7 (1), 420–427. doi:10.1109/tsg.2015.2401337
Zhou, T., Chen, Q., Wang, J., Sun, Y., Xia, Q., and Yan, H. (2015). Carbon emission flow from generation to demand: a network-based model. IEEE Trans. Smart Grid 6 (5), 2386–2394. doi:10.1109/tsg.2015.2388695
Zimmerman, R. D., Murillo-Sanchez, C. E., and Thomas, R. J. (2011). Matpower: steady-state operations, planning and analysis tools for power systems research and education. IEEE Trans. Power Syst. 26 (1), 12–19. doi:10.1109/tpwrs.2010.2051168
a, b Index of two end nodes on branches
g, G Index and total number of generators and power plants
h,
i, N Index and total number of power grid nodes
k Bidding factor
l, L Index and total number of branches
t, τ, T Index and total number of time periods
Parameters
According to the proposed LCDR mechanism, consumers carry out their low-carbon response based on the nodal CEI. This study quantified the impact of nodal CEI on the demand by translating it into carbon emission cost. Based on Eqs. 8 and 10, the second part of the DR is expressed as follows:
By using the multiperiod linear elastic load model, Appendix Eq. A1 is derived as follows:
Furthermore, omitting the relevant parts of εi,t,τ, the secondary demand deviation responding to nodal CEI can be finally denoted as follows:
Keywords: price-based low-carbon demand response, carbon emissions, carbon emission cost conduction, carbon emission intensity, environmental–economic dispatch
Citation: Yang C, He B, Liao H, Ruan J and Zhao J (2022) Price-based low-carbon demand response considering the conduction of carbon emission costs in smart grids. Front. Energy Res. 10:959786. doi: 10.3389/fenrg.2022.959786
Received: 02 June 2022; Accepted: 28 June 2022;
Published: 26 August 2022.
Edited by:
Gaoqi Liang, Nanyang Technological University, SingaporeReviewed by:
Peishuai Li, Nanjing University of Science and Technology, ChinaCopyright © 2022 Yang, He, Liao, Ruan and Zhao. This is an open-access article distributed under the terms of the Creative Commons Attribution License (CC BY). The use, distribution or reproduction in other forums is permitted, provided the original author(s) and the copyright owner(s) are credited and that the original publication in this journal is cited, in accordance with accepted academic practice. No use, distribution or reproduction is permitted which does not comply with these terms.
*Correspondence: Junhua Zhao, emhhb2p1bmh1YUBjdWhrLmVkdS5jbg==
†ORCID: Chao Yang, orcid.org/0000-0002-3952-5299; Binghao He, orcid.org/0000-0002-6627-2442; Huanxin Liao, orcid.org/0000-0001-7888-5222; Jiaqi Ruan, orcid.org/0000-0003-2584-0738; Junhua Zhao, orcid.org/0000-0001-5446-2655
Disclaimer: All claims expressed in this article are solely those of the authors and do not necessarily represent those of their affiliated organizations, or those of the publisher, the editors and the reviewers. Any product that may be evaluated in this article or claim that may be made by its manufacturer is not guaranteed or endorsed by the publisher.
Research integrity at Frontiers
Learn more about the work of our research integrity team to safeguard the quality of each article we publish.