 Guolong Liu
 Shuwen Zhang1
 Huan Zhao
 Gaoqi Liang
 Junhua Zhao
- 1School of Science and Engineering, The Chinese University of Hong Kong, Shenzhen, Guangdong, China
- 2Shenzhen Institute of Artificial Intelligence and Robotics for Society, Shenzhen, Guangdong, China
- 3University of Science and Technology of China, Hefei, Anhui, China
- 4Shenzhen Research Institute of Big Data, Shenzhen, China
As an important part of renewable energy, wind power is crucial to the realization of carbon neutrality. It is worth studying on how to accurately predict the wind output so that it can be integrated into the power grid as much as possible to enhance its utilization rate. In this article, a data enhancement method and a framework are proposed to assist wind power forecasting. The proposed method uses the super-resolution perception technology to first detect the completeness and correctness of historical meteorological and wind power data collected by industrial devices. Then, the detected errors are corrected and the missing data are recovered to make the data complete. The frequency of the data is then increased using the proposed method so that the data become complete high-frequency data. Based on the enhanced complete high-frequency data with more detailed characteristics, more accurate forecasts of wind power can be achieved, thereby improving the utilization rate of wind power. Experiments based on public datasets are used to demonstrate the effectiveness of the proposed method and framework. With the proposed method and framework, higher frequency data with more detailed information can be achieved, thereby providing support for accurate wind power prediction that was not possible before.
1 Introduction
The emission of greenhouse gases (GHG) leads to the continuous increase in global temperature, and the resulting climate change with frequent extreme weather is attracting attention worldwide (Liu et al., 2022). To cope with global climate change, many countries have set targets to limit carbon dioxide emissions; for example, the European Union, China, and the United States announced plans to achieve carbon neutrality before 2050, 2060, and 2050, respectively. To reduce carbon dioxide emissions, it is necessary to reduce the use of fossil fuels. As an alternative to fossil energy, renewable energy will account for a substantial increase in the proportion of electricity in the future. Wind power is a vital source of renewable energy and will be vigorously developed. According to the GWEC 2021 of the Global Wind Energy Council, the new global installed capacity in 2020 is 93 GW, with a 53% year-on-year increase rate, and the global installed wind power capacity exceeded 742 GW by 2020 (GWEC, 2021).
Due to the randomness of wind speed, the generation of wind power is intermittent, and its large-scale integration into power grids will bring great challenges to the security and stability of power grids (Wang et al., 2021). To deal with the instability of power generation, a certain proportion of reserve services needs to be configured, and most of the units providing these services are thermal power units (Welikala et al., 2017). Most of the time, these units operate under inefficient conditions, which is not only a huge waste of investment but also brings additional impacts such as more carbon dioxide emissions to the environment. Therefore, how to use historical data to accurately predict wind power forecasting is a very valuable task. Short-term wind power forecasting is to predict the short-term power generation of wind farms, thereby reducing the uncertainty of wind power generation (Khazaei et al., 2022). Therefore, the accurate prediction of short-term wind power is of great significance for increasing the proportion of wind power integration into power grids, ensuring the safety and stability of power grids, and mitigating climate change.
However, accurate short-term wind power forecasting is a difficult problem. Many meteorological factors, such as wind speed, wind direction, and temperature, may affect the generation of wind power. Therefore, the generation of wind power often presents nonlinear uncertainty. There are many time series and classic machine learning methods used for short-term wind power forecasting, including the autoregressive moving average (ARMA) (Gomes and Castro, 2012), autoregressive integrated moving average (ARIMA) (Azimi et al., 2016), seasonal autoregressive integrated moving average (SARIMA) (Liu et al., 2021), and the generalized autoregressive conditional heterosked (GARCH) model (Chen et al., 2018). With the application of machine learning in various fields, some classic machine learning algorithms including support vector regression (SVR) (Ranganayaki and Deepa, 2017), classification and regression tree (CART) (González et al., 2015), and Gaussian process regression (GPR) (Fang and Chiang, 2016) are also used for short-term wind power forecasting. Due to the limitation of their learning ability, these methods cannot meet the requirements of achieving high-frequency accurate wind power forecasting. With their strong nonlinear learning ability, deep neural networks have achieved remarkable results in image processing, speech recognition, natural language processing, etc. There are also some studies on short-term wind power forecasting, such as deep belief network (DBN) (Wang et al., 2018), recurrent neural network (RNN) (Kumar et al., 2021), long short-term memory (LSTM) (Shahid et al., 2020), convolutional neural network (CNN) (Yu et al., 2020), semi-supervised generative adversarial network (SSGAN) (Zhou et al., 2021), and spatiotemporal attention networks (SAN) (Fu et al., 2019). Among them, the SSGAN has better generalization ability than other deep neural networks, and it is a semi-supervised learning method, which requires less data and is more practical.
Existing studies are based on data collected at the inherent sampling frequency of terminal devices such as Internet-of-things (IoT) devices and do not consider the utilization of higher-frequency complete data with more detailed information. Higher-frequency complete data can not only provide more detailed information for accurate wind power forecasting but also help achieve a shorter forecast period, thereby facilitating wind power to be efficiently integrated into power grids. Collecting high-frequency data is a challenging task with several problems. First, collecting high-frequency data requires the installation of high-frequency meters to replace the installed low-frequency meters, which will be an additional investment and a resource waste. Second, the transmission of high-frequency data requires a large amount of bandwidth, which requires upgrading the existing communication network to improve the data transmission capacity. Third, even if high-frequency data are collected and transmitted to where it is needed (such as a data center), massive storage space is required to store the data. Therefore, it is a more practical solution to recover high-frequency data from existing low-frequency data. There are some studies on improving the frequency of data, such as linear interpolation, binary interpolation, ARIMA, and backpropagation-artificial neural network (BP-ANN), but they have problems such as large errors, poor quality, or low computational efficiency (Liu et al., 2020; Liang et al., 2020). SRP is a technology that uses advanced artificial intelligence technologies to recover low-frequency incomplete data to obtain high-frequency complete data; its effectiveness has been verified in many areas. For example, in the study by Liang et al. (2020), super-resolution perception net for state estimation (SRPNSE) is proposed for improving data completeness in smart grid state estimation. A super-resolution perception convolutional neural network (SRPCNN) is proposed in the study by Liu et al. (2020) to generate high-frequency load data from low-frequency data collected by smart meters. A monthly-super-resolution perception convolutional neural network (M-SRPCNN) is proposed in the study by de-Paz-Centeno et al. (2021) to up-sample monthly energy consumption measured at hourly resolution. Compared with other data quality improvement methods, the SRP method has the advantages of higher efficiency, better quality, and richer information. Therefore, the application of SRP technologies to enhance wind power forecasting is a very valuable research topic.
Against this background, super-resolution perception wind power net (SRPWPN) is proposed based on SRP in this article to enhance the completeness and frequency of data used in wind power forecasting. The proposed method combines the attention mechanism and residual network, which can provide accurate data support for wind power forecasting. The main contributions of this article are described as follows:
1) This article is the first to formalize the SRP problem for short-term wind power forecasting and propose a corresponding framework to solve the proposed problem.
2) This article is the first to propose the SRPWPN to improve the quality of historical data to obtain complete high-frequency data, thereby providing more detailed information for more accurate and higher-frequency wind power forecasting. The SRPWPN provides more detailed information and higher quality data for the current short-term wind power forecasting task.
3) Based on public datasets, the effectiveness of the proposed method and framework is verified using experiments, demonstrating their data enhancement capability for short-term wind power forecasting. In addition, experiments also demonstrate that the proposed method can provide complete data with higher frequency, more detailed information, and higher quality.
The rest of this article is organized as follows: Section 2 formulates the problems of SRP for short-term wind power forecasting and short-term wind power forecasting. The methodology is introduced in Section 3. Experiments and numerical simulation results are reported and discussed in Section 4. Finally, Section 5 concludes this article.
2 Problem formulation
2.1 Problem formulation of SRP for short-term wind power forecasting
The purpose of SRP for wind power forecasting is to recover high-frequency complete data from the incomplete low-frequency data collected by terminal devices, thereby supporting more accurate wind power forecasting. The historical incomplete low-frequency data
where
where
where
2.2 Problem formulation of short-term wind power forecasting
Short-term wind power forecasting is based on historical data to predict wind power generation for some time in the future, where the historical data
The wind power forecasting task for
where
3 Methodology
3.1 The framework of short-term wind power forecasting with SRP
The goal of SRP is to enhance the frequency and quality of historical data to achieve more accurate short-term wind power forecasting, so a framework for short-term wind power forecasting based on SRP is proposed to achieve the above goal. The framework is shown in Figure 1. First, the historical data containing six features such as wind speed and wind power are used as the input of the data preprocessing part as incomplete low-frequency data. Those missing values, duplicate values, outliers, etc., are all processed, and the data are also normalized to obtain low-frequency data. Then the low-frequency data are used as the input of the SRP part, and the complete high-frequency data are obtained by enhancing the historical data through the SRP part. Then based on the complete high-frequency data obtained by SRP, the wind power forecasting method can predict the target wind power generation.
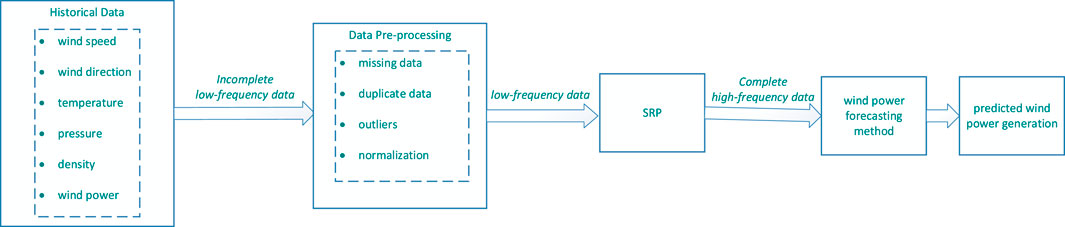
FIGURE 1. Framework of short-term wind power forecasting with SRP.
3.2 Super-resolution perception wind power net
SRPWPN is proposed to enhance the historical data, and its structure is shown in Figure 2. Data
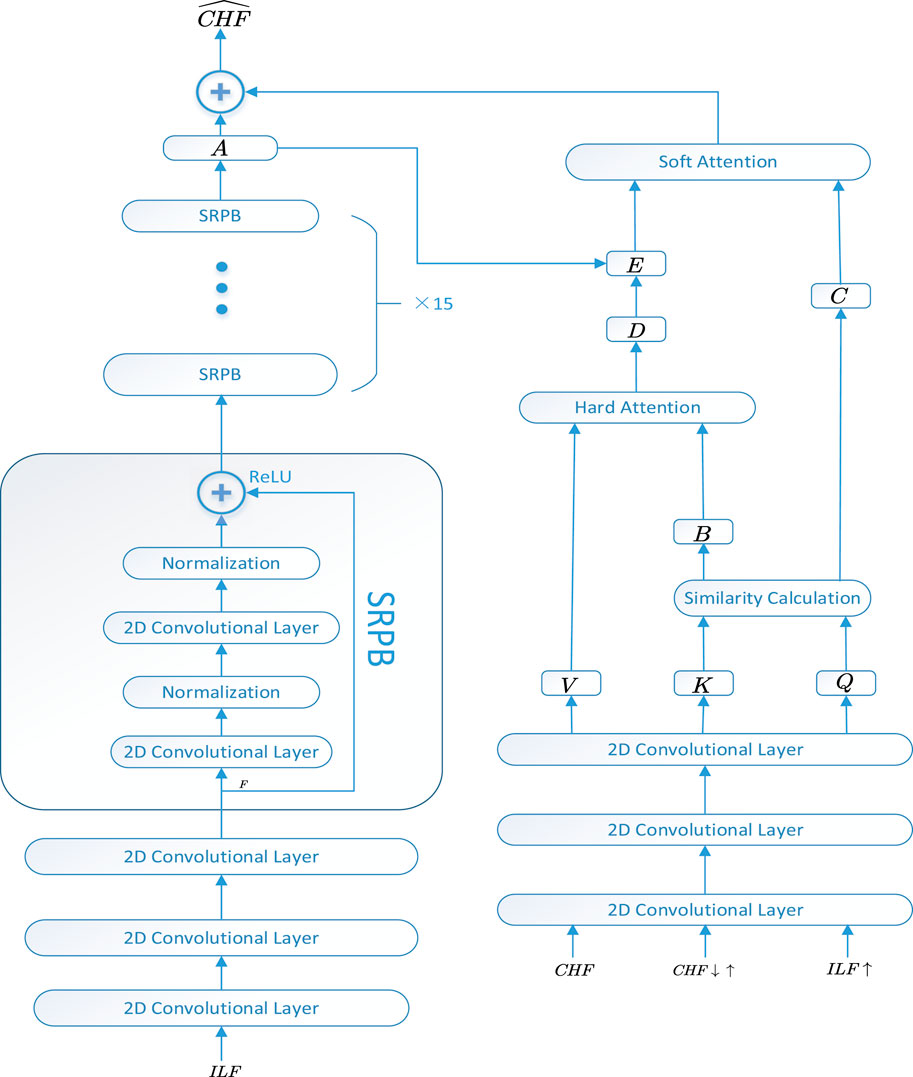
FIGURE 2. Super-resolution perception wind power net.
4 Experiments
The experiments are divided into two parts: one part is to use SRPWPN to enhance historical data, and the other part is to perform short-term wind power forecasting on the recovered data and original data. For the first part, the following three experiments were performed:
1) The sampling interval of incomplete low-frequency data is 15 min, and the SRP factor
2) The sampling interval of incomplete low-frequency data is 10 min, and the SRP factor
3) The sampling interval of incomplete low-frequency data is 1 h, and the SRP factor
Experiments Eqs 1, 2 are conducted on the dataset National Renewable Energy Laboratory (NREL), and experiment (3) is conducted on the dataset The La Haute Borne (TLHB). For the second part, three short-term wind power forecasting methods, CNN, LSTM, and SSGAN, perform short-term wind power forecasting on the complete high-frequency data recovered by SRP and the original high-frequency data, respectively.
4.1 Dataset description
Two datasets were used in the experiments. The first dataset is from the National Renewable Energy Laboratory (NREL). There are six wind farms used for the experiments in NREL, their site IDs are 123229, 123815, 123978, 124043, 124044, and 124045, respectively. NREL contains meteorological information such as wind direction, wind speed, temperature, pressure, and density, as well as wind power for each wind farm. The time range of the data is from 2012-01-01 00:00:00 to 2013-12-31 23:55:00, where the time interval between two consecutive points is 5 min. The abstract information of the used six wind farms is shown in Table 1, where capacity factor represents the average power output divided by the wind turbine’s maximum power capability. The second dataset is the La Haute Borne (TLHB) wind farm, which is located in the Grand Est of northeastern France. There are four wind turbines in TLHB, their site IDs are R80711, R80721, R80736, and R80790, respectively. Other variables, such as wind speed, wind direction, and temperature, are also included in this dataset. The time range of the data is from 2017-01-01 00:00:00 to 2018-01-13 00:00:00, where the time interval between two consecutive points is 10 min.
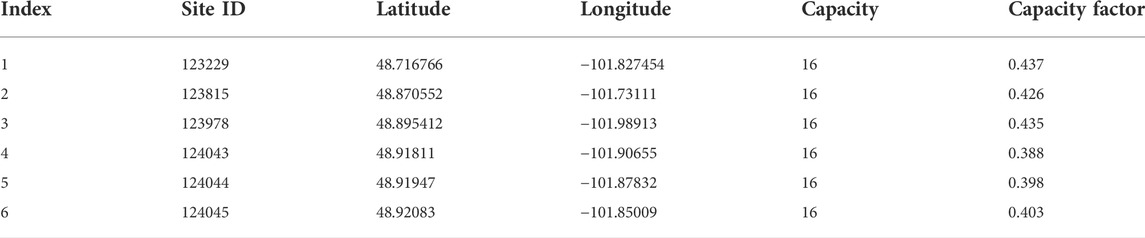
TABLE 1. Information of six wind farms.
4.2 Exploratory data analysis
For NREL, three wind farms with site IDs of 123815, 124043, and 124045 are selected for exploratory data analysis, where temperature, wind speed, and wind power are selected as represented features for visualization. Figure 3 shows the historical data graphs of the represented features for the three wind farms. It can be seen that the temperature has obvious periodicity due to seasonal changes, while the wind speed does not have a similar periodicity as the temperature. The wind power related to the strong wind speed has almost the same pattern in every season. In addition, the maximum value of wind power is 16 MW, even if the wind speed does not reach the maximum value at the corresponding time. The reason is that when the wind speed exceeds the rated wind speed of the wind turbine and is less than the cut-out wind speed, and the wind turbine will generate constant power at the rated power. The wind power is zero at certain time points because the wind speed at those time points is lower than the cut-in wind speed of the wind turbine. For TLHB, two wind farms with site IDs R80711 and R80721 are selected, where absolute wind direction, wind speed, wind power, and outdoor temperature are selected represented features. The historical data of the represented features are shown in Figure 4. The wind power of the two wind farms is between 0 and 2,000 kW, and is not significantly affected by the season. Therefore, periodicity is not considered in the experiments, but these features are used directly.
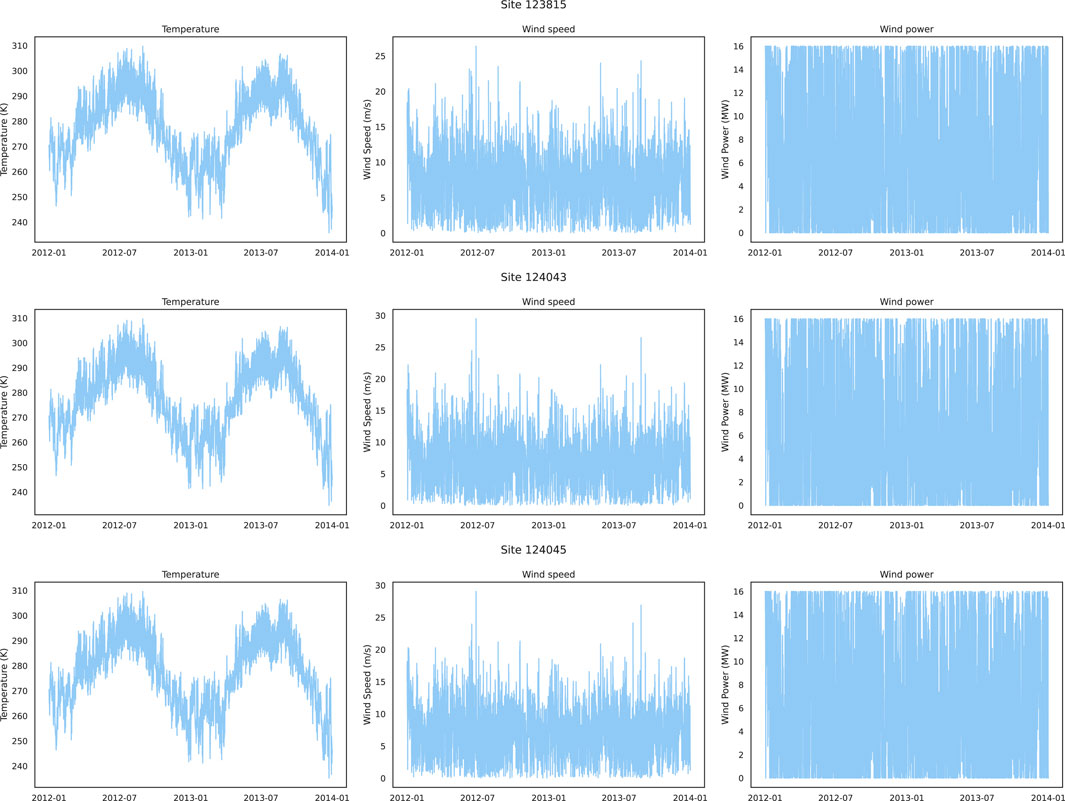
FIGURE 3. Graphs of historical data for three different wind farms in NREL.
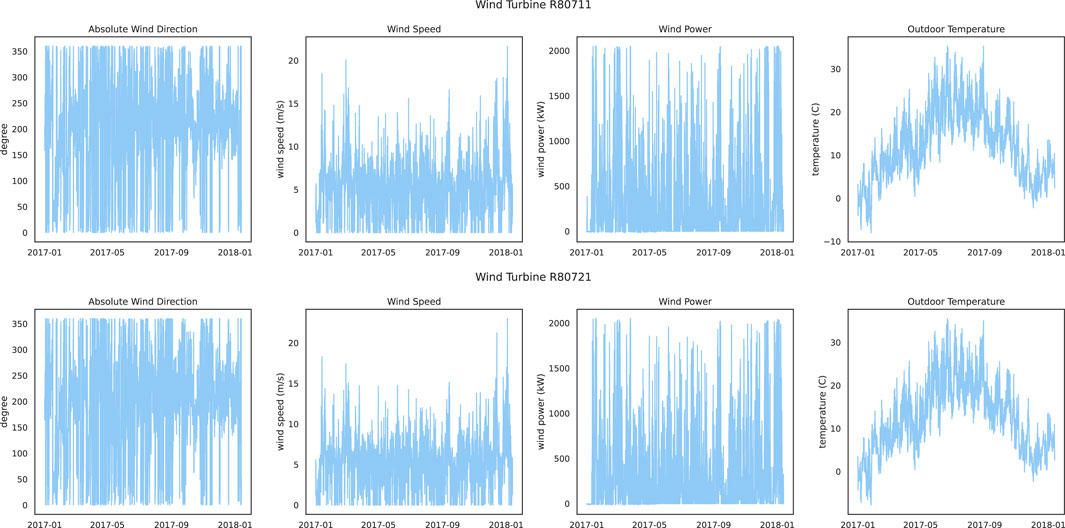
FIGURE 4. Graphs of historical data for two different wind farms in TLHB.
4.3 Data preprocessing
The historical data in NERL are down-sampled by Eq. 14 to obtain data with sampling intervals of 15 and 10 min, respectively.
4.4 Experimental results of SRP for enhancing historical data
SRPWPN performs SRP on historical data from NREL with sampling intervals of 15 and 10 min, resulting in complete high-frequency data with a sampling interval of 5 min after enhancement. Similarly, SRP recovers data with a sampling frequency of 1 hour in TLHB to obtain data with a frequency of 10 min; 75% of the historical data is used for model training, 5% is used for model validation, and 20% is used to evaluate model performance. The loss function used by SRPWPN is defined as follows:
where
where
The experimental results of SRPWPN on NREL are shown in Table 2. It can be seen that SRPWPN has a good performance on the historical data of the six wind farms in NREL, and the minimum MAPE is 1.93%, which means that the minimum error does not exceed 2%. In addition, the maximum MAPE is only 3.35%, which means that SRPWPN has very stable and excellent performance in enhancing historical data. The performance of SRPWPN on data with a sampling interval of 10 min is better than that with a sampling interval of 15 min, which means that a larger SRP factor needs to recover more detailed information and is more challenging. Figure 5 shows the actual effect of SRPWPN on the historical data of NREL with site IDs 123229 and 123815. The subfigures in the first row show the SRP effect of wind speed and wind power with site ID 123229, and the second row shows the SRP effect of wind speed and wind power with site ID 123815. It can be seen that most of the detailed information is recovered in SRPWPN, and the experiments with a smaller SRP factor have better results. Table 3 shows the experimental results of SRPWPN on TLHB. The minimum MAPE is 7.37%, which means that the minimum error does not exceed 7.5% and is slightly worse than the result on NREL. Since the maximum MAPE does not exceed 8.5%, this proves that SRPWPN has a similarly excellent performance. The actual effect of SRPWPN on TLHB with site IDs R80711 and R80721 is shown in Figure 6. The subfigures in the first row show the SRP effect of absolute wind direction, wind speed, wind power, and outdoor temperature with site ID R80711, and the second row shows the SRP effect of wind speed and wind power with site ID R80721. When the actual value fluctuates greatly, SRPWPN can also learn its internal relationship well and reconstruct the corresponding information accurately. Taking the wind power of R80711 as an example, although its value decreased from near 1,900 KW to around 300 KW at around 10 pm, SRPWPN still recovered it accurately. It can be seen that most of the detailed information is recovered in SRPWPN.
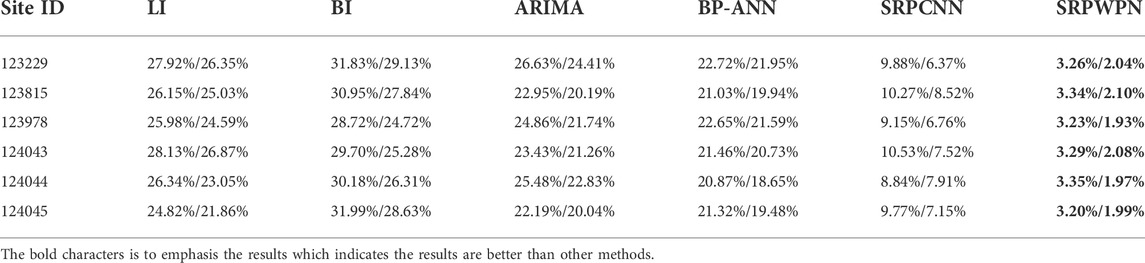
TABLE 2. Experimental results of different methods on NREL (MAPE on 15 min/10 min).
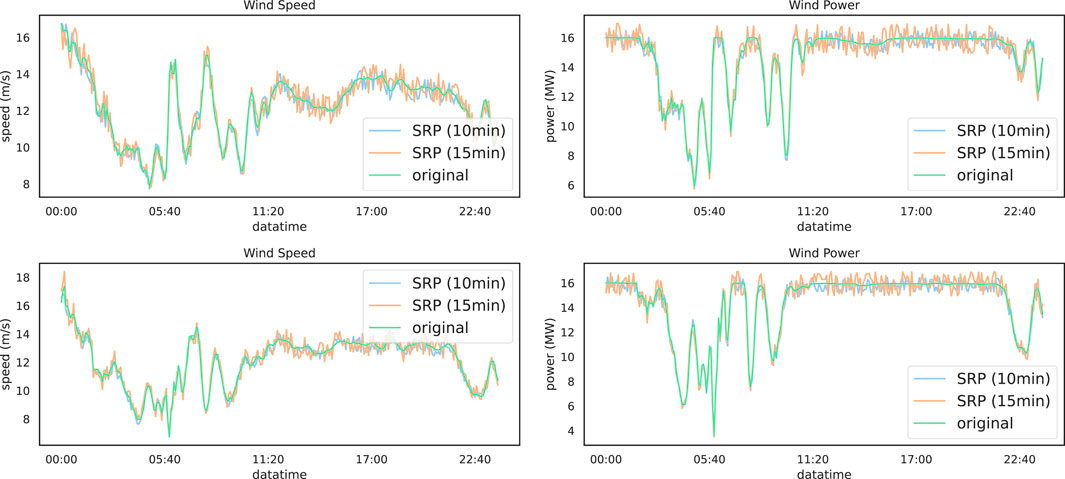
FIGURE 5. SRPWPN on historical data with site IDs 123229 and 123815 in NREL.
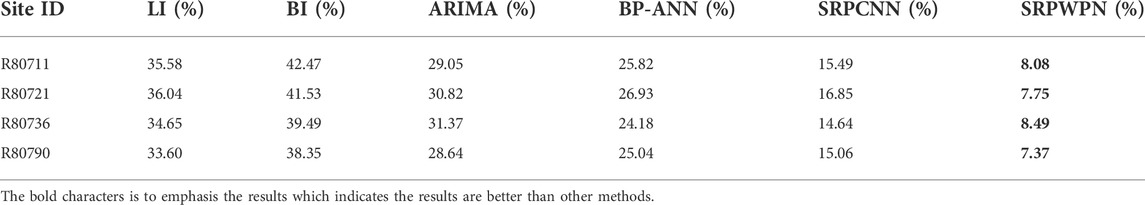
TABLE 3. Experimental results of different methods on TLHB.
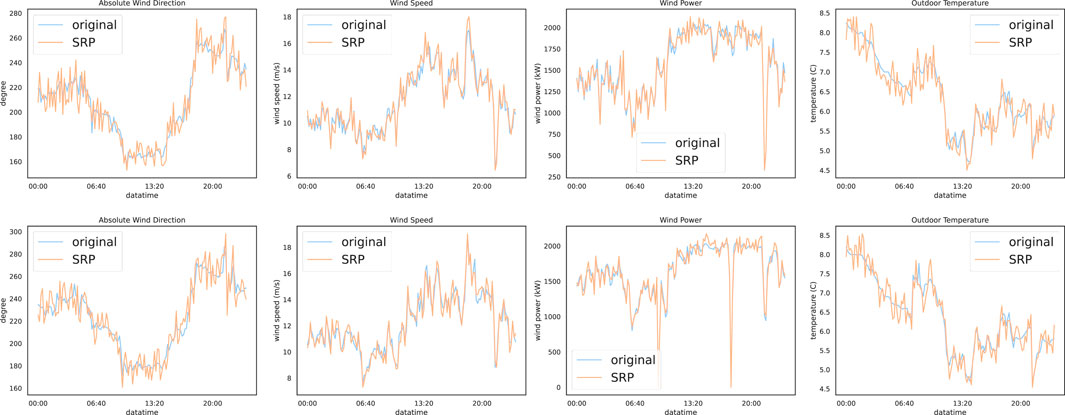
FIGURE 6. SRPWPN on historical data with site IDs R80711 and R80721 in TLHB.
4.5 Experimental results of short-term wind power forecasting with super-resolution perception wind power net
The experimental results of different short-term wind power forecasting methods on real high-frequency data and high-frequency data recovered by SRPWPN are compared to demonstrate that SRPWPN can provide almost the same information as high-frequency data. To verify the effectiveness of the complete high-frequency data recovered by SRPWPN, three short-term wind power forecasting methods including CNN, LSTM, and SSGAN are used in the experiments. For NREL, the three methods perform short-term wind forecasts on complete high-frequency data with a real sampling interval of 5 minutes and data with a sampling interval of 5 minutes recovered by using SRPWPN from incomplete low-frequency data with a sampling interval of 10 min. For TLHB, the three methods perform short-term wind forecasts on complete high-frequency data with a real sampling interval of 10 min and on data with a sampling interval of 10 min recovered by using SRPWPN from incomplete low-frequency data with a sampling interval of 1 h. In the experiments, the historical data of the past 7 days are used to predict the wind power generation of the next day. MAPE is used as the evaluation metric, and the experimental results are shown in Tables 4, 5. The column with the suffix SRP in the table represents the error of the short-term wind power forecasting results of the prediction method on the data recovered from the SRPWPN. Although the results of the three methods on the data recovered by SRPWPN are slightly inferior to the actual data, the biggest difference is not more than 2%. The worst of the three methods on the data recovered by SRPWPN is CNN, whose MAPE does not exceed 11% in TLHB, and the best is SSGAN, whose MAPE does not exceed 7% in the two datasets. It can be considered that the data recovered by SRPWPN are very close to the effect of real data in practical applications. As the best short-term wind power forecasting method, SSGAN is selected as the visualization method. CNN and LSTM are chosen as the comparative methods. Figure 7 shows SSGAN on the raw historical data and data recovered by SRPWPN with site IDs 123229 and 123815 in NREL. The subfigures in the first row show the performance of SSGAN on site ID 123229, and the second row shows the performance of SSGAN on site ID 123815. Original represents the real wind power of the two sites, SRP data represent the predicted results of SSGAN on complete high-frequency data recovered by SRPWPN, and raw data represent the results of SSGAN on the real data with a sampling interval of 5 minutes. Figure 8 shows SSGAN on the raw historical data and data recovered by SRPWPN with site IDs R80711 and R80721 in TLHB. The subfigures in the first row show the performance of SSGAN on site ID R80711, and the second row shows the performance of SSGAN on site ID R80721. Original represents the real wind power of the two sites, SRP data represent the predicted results of SSGAN on complete high-frequency data recovered by SRPWPN and raw data represent the results of SSGAN on the real data with a sampling interval of 10 min. The results predicted by SSGAN are almost the same as the actual results, which proves that the data recovered by SRPWPN can be well utilized by short-term wind power forecasting methods, thereby achieving higher frequency accurate wind power forecasting, and the recovered information is sufficient for short-term wind power forecasting to use.
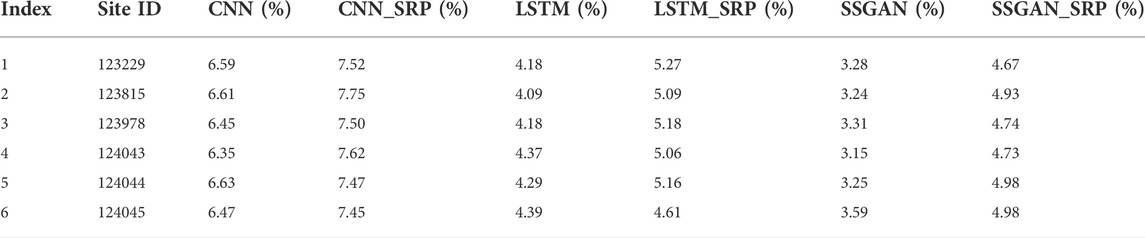
TABLE 4. MAPE results of short-term wind power forecasting on TLHB.
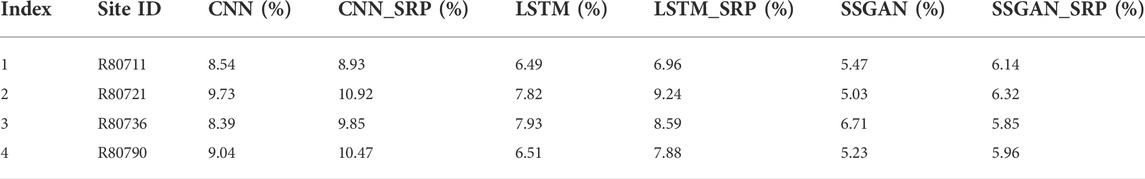
TABLE 5. MAPE results of short-term wind power forecasting on NREL.
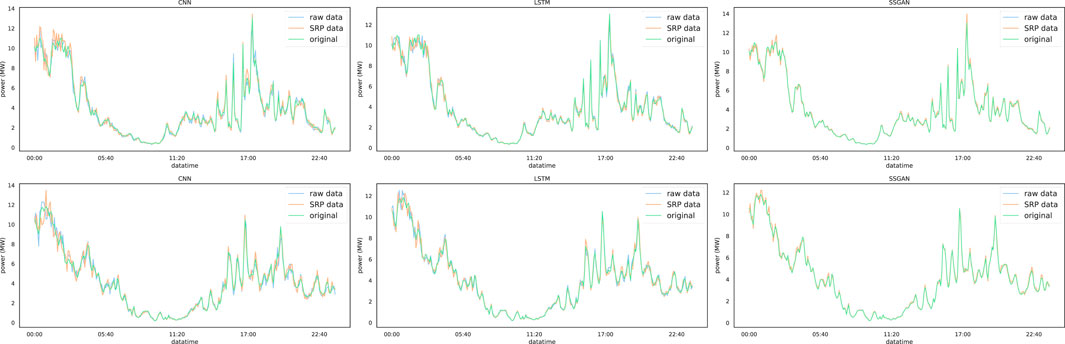
FIGURE 7. SSGAN on site IDs 123229 and 123815 in NREL.
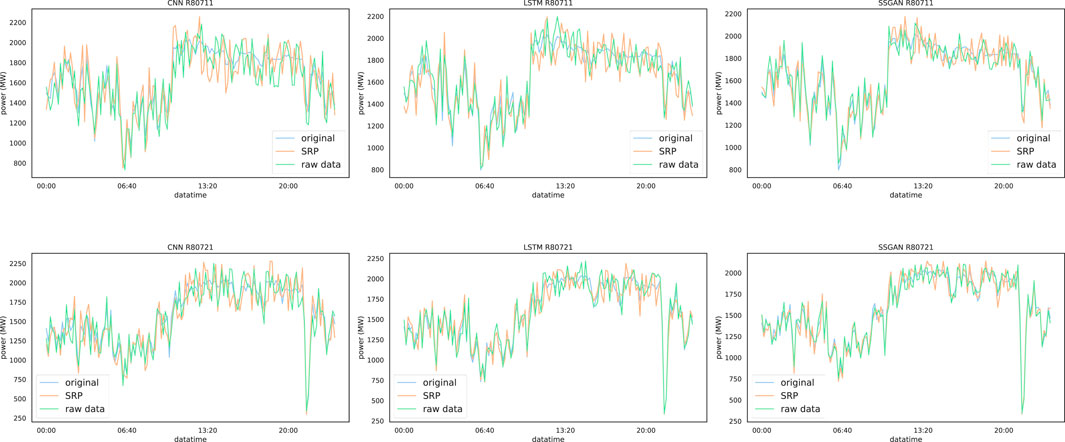
FIGURE 8. SSGAN on site IDs R80711 and R80721 in TLHB.
5 Conclusion
A deep SRP network named SRPWPN is proposed for short-term wind power forecasting, and an SRP-based short-term wind power forecasting framework is proposed to achieve accurate short-term wind power forecasting at higher frequencies. In the proposed framework, SRPWPN is used to recover complete high-frequency data from incomplete low-frequency data, thereby enhancing historical data and then using short-term wind power forecasting methods on the enhanced data to achieve higher-frequency accurate short-term wind power forecasting. In the SRPWPN, incomplete low-frequency historical data are used as the input, and then detailed information is reconstructed through structures such as attention mechanism and SRPB, thereby obtaining complete high-frequency data for higher-frequency short-term wind power forecasting. The experimental results show that the SRPWPN can recover the most lost detailed information, and its maximum MAPE does not exceed 8.5%. The maximum MAPE of short-term wind power forecasting experiments on the complete high-frequency data recovered based on SRPWPN is less than 11%. The MAPE of the best short-term wind power forecasting method SSGAN is less than 6.5%, which proves the effectiveness of the proposed SRP-based wind power forecasting framework. Regardless of whether the sampling frequency is 10 min, 15 min, or 1 h of historical data, the proposed method enhances the data well. With the proposed data enhancement method, SRPWPN and SRP-based short-term wind power forecasting framework, accurate short-term wind power forecasting at higher frequencies can be achieved.
Data availability statement
Publicly available datasets were analyzed in this study. These data can be found here: https://www.nrel.gov/grid/eastern-western-wind-data.html.
Author contributions
GL: experiments, research methods, and writing the original draft; SZ: data processing, experiments, and graphic drawing; HZ: research methods and literature review. JL: resources and guide experiments. GL: supervision and project administration. JZ: project administration and fund acquisition. GS: project administration.
Funding
This work was supported in part by the National Natural Science Foundation of China (Key Program 71931003, 72061147004, 72171206, 72192805, and 42105145) and in part by the Shenzhen Institute of Artificial Intelligence and Robotics for Society.
Conflict of interest
The authors declare that the research was conducted in the absence of any commercial or financial relationships that could be construed as a potential conflict of interest.
Publisher’s note
All claims expressed in this article are solely those of the authors and do not necessarily represent those of their affiliated organizations, or those of the publisher, the editors, and the reviewers. Any product that may be evaluated in this article, or claim that may be made by its manufacturer, is not guaranteed or endorsed by the publisher.
References
Agarap, A. F. (2018). Deep learning using rectified linear units (relu). arXiv preprint arXiv:1803.08375. Available at:
Azimi, R., Ghofrani, M., and Ghayekhloo, M. (2016). A hybrid wind power forecasting model based on data mining and wavelets analysis. Energy Convers. Manag. 127, 208–225. doi:10.1016/j.enconman.2016.09.002
Chen, H., Li, F., and Wang, Y. (2018). Wind power forecasting based on outlier smooth transition autoregressive GARCH model. J. Mod. Power Syst. Clean. Energy 6, 532–539. doi:10.1007/s40565-016-0226-3
de-Paz-Centeno, I., Garcia-Ordás, M. T., Garcia-Olalla, O., Arenas, J., and Alaiz-Moretón, H. (2021). M-SRPCNN: A fully convolutional neural network approach for handling super resolution reconstruction on monthly energy consumption environments. Energies 14, 4765. doi:10.3390/en14164765
Fang, S., and Chiang, H.-D. (2016). A high-accuracy wind power forecasting model. IEEE Trans. Power Syst. 32, 1–1590. doi:10.1109/tpwrs.2016.2574700
Fu, X., Gao, F., Wu, J., Wei, X., and Duan, F. (2019). “Spatiotemporal attention networks for wind power forecasting,” in 2019 International Conference on Data Mining Workshops (ICDMW), Beijing, China, November 8–11, 2019, 149–154.
Gomes, P., and Castro, R. (2012). Wind speed and wind power forecasting using statistical models: Autoregressive moving average (ARMA) and artificial neural networks (ANN). Int. J. Sustain. Energy Dev. 1, 41–50. doi:10.20533/ijsed.2046.3707.2012.0007
González, C., Mira-McWilliams, J., and Juárez, I. (2015). Important variable assessment and electricity price forecasting based on regression tree models: Classification and regression trees, Bagging and Random Forests. IET Gener. Transm. &. Distrib. 9, 1120–1128. doi:10.1049/iet-gtd.2014.0655
Khazaei, S., Ehsan, M., Soleymani, S., and Mohammadnezhad-Shourkaei, H. (2022). A high-accuracy hybrid method for short-term wind power forecasting. Energy 238, 122020. doi:10.1016/j.energy.2021.122020
Kingma, D. P., and Ba, J. (2014). Adam: A method for stochastic optimization. Available at: http://doi.acm.org.ezproxy.lib.ucf.edu/10.1145/1830483.1830503.1–15. doi:10.1145/1830483.1830503
Kumar, D., Mathur, H. D., Bhanot, S., and Bansal, R. C. (2021). Forecasting of solar and wind power using LSTM RNN for load frequency control in isolated microgrid. Int. J. Model. Simul. 41, 311–323. doi:10.1080/02286203.2020.1767840
Liang, G., Liu, G., Zhao, J., Liu, Y., Gu, J., Sun, G., et al. (2020). Super resolution perception for improving data completeness in smart grid state estimation. Engineering 6, 789–800. doi:10.1016/j.eng.2020.06.006
Liu, G., Gu, J., Zhao, J., Wen, F., and Liang, G. (2020). Super resolution perception for smart meter data. Inf. Sci. 526, 263–273. doi:10.1016/j.ins.2020.03.088
Liu, G., Liu, J., Zhao, J., Qiu, J., Wu, Z., Mao, Y., et al. (2022). Real-time corporate carbon footprint estimation methodology based on appliance identification. IEEE Trans. Ind. Inf., 1. doi:10.1109/tii.2022.3154467
Liu, X., Lin, Z., and Feng, Z. (2021). Short-term offshore wind speed forecast by seasonal ARIMA-A comparison against GRU and LSTM. Energy 227, 120492. doi:10.1016/j.energy.2021.120492
Ranganayaki, V., and Deepa, S. N. (2017). Svm based neuro fuzzy model for short term wind power forecasting. Natl. Acad. Sci. Lett. 40, 131–134. doi:10.1007/s40009-016-0521-6
Shahid, F., Zameer, A., Mehmood, A., and Raja, M. A. Z. (2020). A novel wavenets long short term memory paradigm for wind power prediction. Appl. Energy 269, 115098. doi:10.1016/j.apenergy.2020.115098
Wang, K., Qi, X., Liu, H., and Song, J. (2018). Deep belief network based k-means cluster approach for short-term wind power forecasting. Energy 165, 840–852. doi:10.1016/j.energy.2018.09.118
Wang, Y., Zou, R., Liu, F., Zhang, L., and Liu, Q. (2021). A review of wind speed and wind power forecasting with deep neural networks. Appl. Energy 304, 117766. doi:10.1016/j.apenergy.2021.117766
Welikala, S., Dinesh, C., Ekanayake, M. P. B., Godaliyadda, R. I., and Ekanayake, J. (2017). Incorporating appliance usage patterns for non-intrusive load monitoring and load forecasting. IEEE Trans. Smart Grid 10, 448–461. doi:10.1109/tsg.2017.2743760
Yu, Y., Han, X., Yang, M., and Yang, J. (2020). Probabilistic prediction of regional wind power based on spatiotemporal quantile regression. IEEE Trans. Ind. Appl. 56, 6117–6127. doi:10.1109/tia.2020.2992945
Keywords: super-resolution perception, SRPWPN, deep learning, short-term wind power forecasting, artificial intelligence
Citation: Liu G, Zhang S, Zhao H, Liu J, Liang G, Zhao J and Sun G (2022) Super-resolution perception for wind power forecasting by enhancing historical data. Front. Energy Res. 10:959333. doi: 10.3389/fenrg.2022.959333
Received: 01 June 2022; Accepted: 16 August 2022;
Published: 15 September 2022.
Edited by:
Alberto Benato, University of Padua, ItalyReviewed by:
Jianzhou Wang, Dongbei University of Finance and Economics, ChinaJieming Ma, Xi’an Jiaotong-Liverpool University, China
Copyright © 2022 Liu, Zhang, Zhao, Liu, Liang, Zhao and Sun. This is an open-access article distributed under the terms of the Creative Commons Attribution License (CC BY). The use, distribution or reproduction in other forums is permitted, provided the original author(s) and the copyright owner(s) are credited and that the original publication in this journal is cited, in accordance with accepted academic practice. No use, distribution or reproduction is permitted which does not comply with these terms.
*Correspondence: Gaoqi Liang, bGlhbmdnYW9xaUBjdWhrLmVkdS5jbg==; Junhua Zhao, emhhb2p1bmh1YUBjdWhrLmVkdS5jbg==