 Zhan Xiong
 Shuhan Luo2
 Lingling Wang
- 1The Key Laboratory of Control of Power Transmission and Conversion, Ministry of Education, The School of Electronic Information and Electrical Engineering, Shanghai Jiao Tong University, Shanghai, China
- 2State Grid Economic and Technological Research Institute Co, Ltd, Beijing, China
In response to increasing environmental deterioration, the vigorous development of the integrated energy system is an important measure to achieve the goal of carbon neutrality. In order to ensure that the system takes into account the economic operation under the premise of low carbon and environmental protection, this paper proposes a bi-level optimal low-carbon economic operation model for the regional integrated energy system (RIES). At the upper level, the objective of the RIES is economic optimization, which contains the carbon emission cost so that the system would change its preference for high-carbon energy to limit the carbon emission of the system. At the lower level, an electricity and natural gas pricing model is established, and a carbon emission flow (CEF) model is used to calculate the price of carbon emissions. This proposed bi-level optimization model is converted to a single-level mathematical problem with KKT (Karush–Kuhn–Tucker) conditions for efficient calculation. The proposed optimal model is tested on the five-bus power system and seven-node natural gas system, and numerical results indicate the optimal operating model with this proposed carbon pricing method can effectively reduce carbon emissions and minimize the total operating cost of RIES.
1 Introduction
In recent years, due to the increasingly serious global warming and environmental pollution problems caused by carbon emissions, the development of low-carbon technologies has become a common goal of the whole world. China has proposed a strategic objective of achieving peak carbon dioxide emissions in 2030 and carbon neutrality in 2060 (Central Committee of the Communist Party of China, State Council, 2012). The energy industry is one of the main sources of carbon emissions, and the carbon emission of the energy industry is mainly from fossil fuel burning (Iqbal and Siddiqui, 2017). The proportion of the energy sector’s carbon emission over the total emission decreases from 73.2% in 2016 to 41.7% in 2019 (Ritchie and Roser, 2020). The energy structure in China is complex and unreasonable, and high-energy-consuming industries with large amounts of carbon emission restrict the promotion process of carbon emission reduction (Wei et al., 2008). Therefore, we need to develop the new energy technology to improve the efficiency of energy utilization and the utilization of minimizing the carbon emission cost to control carbon emissions. Through the coordination of these two aspects, the concept of the regional integrated energy system (RIES) is proposed. The RIES is commonly recognized as one of the efficient methods to promote the integration and consumption of renewable energy and reduce carbon emissions, which takes electricity as the main part coupling with other various energy forms such as natural gas and thermal energy (Liu et al., 2021).
At present, the research on the RIES mainly focuses on economic scheduling planning, and safe operation. The literature (Jin et al., 2021) establishes a two-layer optimal integration scheme for building heating loads in the integrated community energy system (ICES), which can reach a scheduling balance between the energy cost of consumers and the profits of the ICES operator. A bi-level optimal scheduling model for the community integrated energy system (CIES) with an electric vehicle charging station (EVCS) in a multi-party scenario is presented to balance the profits between the CIES and the EVCS through coordinating the demand response and uncertainties of renewable energy (Li et al., 2021). The literature (Yang et al., 2021) proposes an integrated expansion planning model based on the local biogas delivery network that helps the centralized biogas plant (CBP) to supply energy for district heating and electric loads. In the literature (Yan et al., 2021), a coordinated regional-district operation of the integrated energy system (IES) is proposed to enhance resilience in extreme conditions. However, the carbon emission reduction of the RIES is not adequately considered. Therefore, the introduction of the carbon emission cost to the optimal operating problem is an effective approach to control carbon emissions of the RIES. As an important part of calculating the carbon emission cost, the carbon pricing method is a worthy research problem.
In order to calculate the carbon emission cost, there generally are two policies related to the carbon emission pricing mechanism. The first one is the carbon tax which is imposed on power producers. The literature (Cheng et al., 2020) proposes a type of energy–carbon integrated price based on carbon tax and locational marginal pricing principles, and this carbon pricing method has a significant effect on reducing carbon emissions. The literature (Tian et al., 2020) studies the low-carbon economic dispatch problem of the IES, in which the carbon-related costs contain the tax cost of carbon emission and the maintenance cost of carbon storage equipment. Another approach is that the cap-and-trade policy that participates in carbon trading are assigned an emission cap and trade carbon emission permits. A cap-and-trade mechanism is used to model the carbon-emission market, and the price of CO2 is found by solving the conjectural-variations equilibrium model in electricity, natural gas, and carbon-emission markets (Chen et al., 2021). The literature (Cui et al., 2021) adopts the cap-and-trade policy, which optimizes the low-carbon economic dispatch of the electricity–gas–heat integrated energy system. The carbon tax is generally applied to the energy generation side which is difficult to affect the energy-using behaviors of consumers, and the pricing mechanism based on the carbon tax should be differentiated from different energy systems. Moreover, for the cap-and-trade policy, the carbon quota is uniformly allocated by the government according to a certain standard which is different from general commodities (Careri et al., 2011), and in the literature (Zhang et al., 2016), carbon quotas are determined based on historical emission levels. Actually, these quota allocation methods are not rigorous and fair, which ignore different characteristics of different carbon emission entities and lack a basis for pricing. However, all the above research does not consider the relationship between demand–supply and the carbon price.
In order to clarify the connection between energy and carbon emission, the literature (Kang et al., 2015) proposes an analytical carbon emission flow (CEF) model to qualify the carbon emission associated with power generation. Thus, carbon emissions from various generators can be seen as a virtual appendage to electricity flow, accumulating on the consumption-based side. In addition to electricity, other energy sources also have embedded carbon emissions. The literature (Cheng et al., 2019) proposes a CEF model in multiple energy systems (MESs), including the power network, gas network, and heating network, and the expansive CEF model for the energy hub. A data-driven CEF model directed with the Bayesian interfere regression is proposed to improve the calculation quality of carbon tracing tools (Wang et al., 2022). The CEF model helps to illustrate the allocation of carbon emission reduction responsibilities among different energies and different consumers. It can promote the carbon emission pricing and trading of the future energy system. Therefore, in this paper, the carbon price is calculated by applying carbon tax and nodal carbon emission intensities in electricity and natural gas systems.
A power generator in the electricity market can adjust its output according to the demand in the network and its actual marginal cost, which will influence the locational marginal electricity price (LMEP) (Jiang et al., 2022). Generally, its objective function is to maximize its profits through market trading (Hortacsu and Puller, 2008) or maximize the social welfare of the electricity market (Jiang et al., 2022). Furthermore, there is more research on the connection between electricity and natural gas markets. The literature (Wang et al., 2018) focuses on the equilibrium of the electricity and natural gas coupling market and proposes a bilateral pricing mechanism to calculate the locational marginal gas price (LMGP) and LMEP. A framework of joint gas and electricity markets is proposed to deal with the uncertainty and congestion caused by the high proportion of renewable energy (Chen et al., 2018). An electricity and natural gas coupling market is developed to find the equilibria in electricity and natural gas markets through various characteristics such as the maximum social welfare and profits of producers or consumers (Chen et al., 2020). Additionally, a bi-level bidding model in independent electricity and natural gas markets is proposed to maximize the profit of the gas-fired unit in the literature (Jiang et al., 2022). The literature (Ruiz and Conejo, 2009) also proposes a bi-level bidding model for the electricity producer’s profits considering the uncertainty of rival market participants. The carbon emission limit of RIES makes it tend to purchase low-carbon energy, and thus, its bidding behaviors such as energy demands will change. Bidding behaviors of RIES changes in bidding behaviors of RIES can affect the results of market-clearing, and clearing energy prices and outputs of each unit. It is of great significance to study the connection between energy prices and carbon prices, which will provide users with positive incentives and guidance for low-carbon energy utilization in different markets. In literature studies (Jiang et al., 2022; Zhang et al., 2010; Fang et al., 2015), all the bi-level bidding strategic bidding models are transferred into a single-level mixed-integer linear programming (MILP) problem through KKT (Karush–Kuhn–Tucker) conditions. Similarly, the literature (Yang et al., 2021) also uses KKT conditions to transform the bi-level trading model with a large-scale biogas plant (LBP) model and demand response aggregator (DRA) into a single-level mathematical program with equilibrium constraints (MPEC).
In order to address the aforementioned challenges, this paper establishes a bi-level optimal low-carbon economic operating model of RIES based on the CEF model and the electricity and natural gas market-clearing models. The carbon emission cost of RIES is considered in this paper, and an effective carbon pricing approach in terms of the consumer perspective is established. The upper-level model is an optimal low-carbon economic operating model, the objective of which is to minimize the total cost of RIES. The lower-level models simulate the market-clearing of electricity and natural gas, the objectives of which are the maximum social welfare of electricity and natural gas markets.
The contributions of this paper are as follows.
1) An optimization model is established for the low-carbon economic operation of RIES in the electricity and natural gas markets. This model is used to optimize the energy prices and output of each unit in electricity and natural gas markets. Moreover, as a strategic energy consumer in both electricity and natural gas markets, the RIES in this model can adjust its demands on these two energies and allocate its energy purchase plans between the two energy markets to achieve optimal economic performance.
2) A carbon pricing approach based on the CEF model and the carbon tax policy is adopted for the RIES to trade in the carbon market. The carbon prices of electricity and natural gas are different; thus, the RIES can allocate purchasing plans for electricity and natural gas according to energy prices to realize the low-carbon operation of RIES.
3) A bi-level optimization is proposed to study the low-carbon economic operation of RIES using the above-mentioned carbon pricing method. The market-clearing models of the electricity and natural gas networks are taken as the lower-level models to optimize energy demands and trading prices of RIES. These two lower-level models are replaced with their KKT conditions as the constraints of the upper-level model, and this bi-level model is transferred into a single-level programming model which is solvable for commercial solvers.
The remainder of this paper is organized as follows: Section 2 presents the model structure, assumptions, and formulations of the bi-level optimal low-carbon economic operation model of RIES; Section 3 transfers this bi-level model to a single-level model through substituting original lower-level models with their KKT conditions and handles bilinear terms with strong duality theory; Section 4 shows case studies to approve the effectivity of this proposed model; and Section 5 is the conclusion.
2 Bi-level optimization model of regional integrated energy system
A bi-level low-carbon optimization model of RIES is established in this section. The upper-level model aims at minimizing the system operation cost of RIES, and the lower-level model is the electricity and natural gas market-clearing model whose objective is to maximize social welfare.
2.1 Model structure
The framework of this model is shown in Figure 1. The lower-level model simulates the electricity and natural gas market-clearing directed by the ISO and GMO under the wholesale market mechanism. There are two optimization models at this level. The first one is the electricity market-clearing model whose objective is the social welfare maximization based on the economic schedule problem of the power grid. Another model is the natural gas market-clearing problem which is also to maximize social welfare through the information provided by market players. Energy prices such as the locational marginal prices of electricity (LMEP) and gas (LMGP) are adopted as the market-clearing result. The upper level of this proposed framework is an optimal operating problem of an RIES to minimize the total operating cost. In the RIES, the regional integrated energy operator purchases energy from the upstreaming energy market and sells it to end-users in the park.
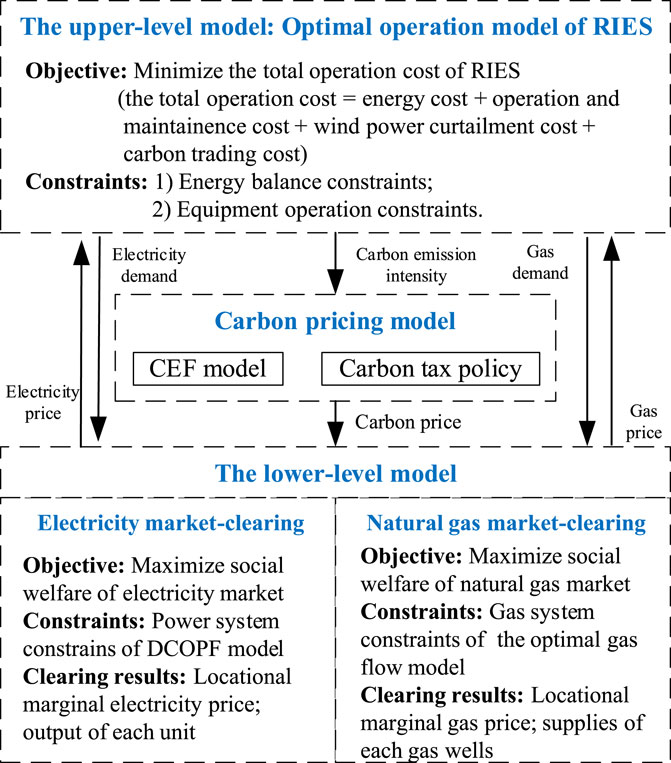
FIGURE 1. Framework of the optimal low-carbon operation model of RIES.
The operation of RIES considers the carbon emission cost, and the carbon price is determined by the carbon tax policy. A CEF model is proposed to follow the variation of carbon emission intensities in the network, which can be used to calculate carbon prices at different locations. The RIES operator minimizes the carbon emission cost based on this carbon price and optimizes its energy demand related to the carbon emission of RIES.
As a market participant in both electricity and natural gas markets, the RIES is an independent entity. Therefore, under such a mechanism, different market players can operate independently and make their own operating strategies. During the production period, each energy supplier can submit their supply and price information to bid in the energy market. Furthermore, during the consumption period, the RIES will provide its demands as its operating strategies. The ISO and GMO clear markets to determine energy prices at different positions.
2.2 Assumptions and simplifications
The main assumptions made in the proposed low-carbon optimal operation model of RIES are summarized as follows.
1) General assumption: (a) The electricity and natural gas consumption is paid as locational marginal prices such as LMEP and LMGP, which are obtained through market-clearing determined by the ISO and GMO. (b) All the loads are inelastic except the electricity and gas demand of RIES.
2) RIES: Efficiencies of energy conversion devices in the RIES are fixed; thus, the relationship between their input and output is linear. Furthermore, the RIES participates in electricity and natural gas market trading as a strategic user.
3) Electricity market: The RIES is a strategic market participant, and all the generators are non-strategic. The information about the electricity market is assumed to be known.
4) Natural gas network: (a) An abbreviated steady-state natural gas flow model without considering pipeline filling in the market-clearing model. (b) The direction of natural gas in the pipeline is immobile on account of characteristics of natural gas flow (Jiang et al., 2022). (c) Gas wells are non-strategic market participants. (d) The compressor model in the gas network simply considers a linear relationship between the starting-node and the end-node of the pipeline, and the energy consumption of the compressor is inappreciable to be ignored.
2.3 Lower-level model
2.3.1 Electricity market-clearing model
The direct current optimal power flow (DCOPF) model is usually adopted for electricity market-clearing, which is a linear programming problem. The objective function is to minimize the total generation cost of the electricity system, which is equal to the sum of the generation cost of fossil-fired units, presented as
where
The power system constraints are as follows.
In the electricity network, the voltage angle of the slack bus is zero, as follows:
The power supply–demand balance equation at each bus of the electricity network can be expressed as
where
The constraint to limit the capacity of transmission lines is shown as
where
The generation limit of fossil-fired units is shown as
where
The ramping up and ramping down limit of fossil-fired units is
where
2.3.2 Natural gas market-clearing model
The natural gas system is represented by the optimal gas flow model, and this model only considers the steady-state characteristics of the natural gas system. The objective function is to minimize the total operation cost, which is also to minimize the production cost of the natural gas system as follows:
where
The natural gas system constraints are as follows.
The nodal gas flow balance equation is
where
The transmission loss of the natural gas network is ignored in this paper, and then the Weymouth equation is used to estimate the pipeline gas flow as follows (Jiang et al., 2022):
where
The constraint about the capacity limit of pipelines is represented as
where
In order to reduce the transmission loss and maintain a certain pressure in the pipeline, compressors are used in the natural gas network. The pressure relationship between nodes along a pipeline with a compressor is shown as
where
The constraint of pressure bounds for gas network nodes is
where
The gas supply bounds of gas wells are shown as
where
2.3.3 Carbon pricing model
The carbon emission is almost produced by energy generation, while its correlative costs are afforded by users and allocated on the demand side. In order to track carbon emissions from the energy generation side to the demand side, a carbon emission flow (CEF) model is adopted (Cheng et al., 2020). The carbon emission flow is simply understood as a virtual flow that totally depends on the energy flow. There is an important parameter as carbon intensity in this model, and deuterogenic parameters are the nodal carbon intensity (NCI) and the branch carbon intensity in the power system. Carbon intensity means the relative carbon flow for every unit of power flow. Based on the proportional sharing principle, the nodal carbon intensity is calculated by weighting the average of carbon intensities from all the injected energy flow, which indicates the relationship between the average carbon emissions and the injected energy flow. The NCI of the electricity network is shown as
where
The branch carbon intensity (BCI) indicates the carbon emission that is related to energy flow through this branch (Cheng et al., 2019). According to the definition of the nodal carbon emission intensity and the proportional sharing principle, the value of the branch carbon intensity is the same as that of the outflowing bus’ nodal carbon intensity, which is shown as
The carbon emission of natural gas loads is also considered in this paper, which is similar to the carbon emission flow model of the electricity system. Thus, the carbon emission flow (CEF) model of the natural gas network can be represented as
where
Similarly, in the natural gas system, the branch carbon intensity of a pipeline is equal to the nodal carbon intensity of its inflow node as shown in the following:
This paper proposes a novel carbon price mechanism depending on the carbon intensity which is related to the clearing results of electricity and natural gas markets. Accompanied by nodal carbon intensities and branch carbon intensities of electricity and natural gas systems, the nodal carbon price is defined as the product of the carbon tax factor and that nodal carbon intensity. The nodal carbon price of electricity and natural gas systems is
where
2.4 Upper-level model
2.4.1 Regional integrated energy system model
The RIES can convert and transmit various types of energy such as electricity, natural gas, and thermal energy. In this paper, the RIES considers the carbon emission cost and purchases electric power from electricity at LMEP and natural gas from the natural gas market, which is shown in Figure 2. The behavior of RIES will influence the market-clearing results such as the energy prices and carbon prices. Energy sources contain a gas turbine (GT), wind turbine (WT), and photovoltaic (PV) which offer electricity to the system, and gas-fired boiler (GB) to offer thermal energy. As a popular energy conversion device, combined heat and power (CHP) can provide both of them.
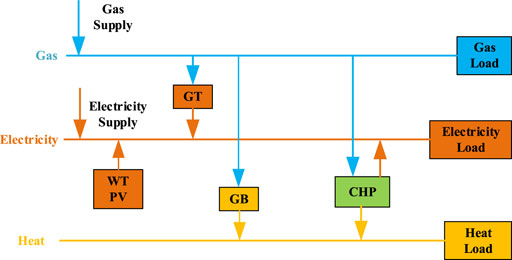
FIGURE 2. Typical energy structure of the RIES.
2.4.2 Objective function
The upper-level model establishes a low-carbon economic operating model of RIES, which is to minimize the sum of the system operation cost and environmental cost. The system operation cost contains the cost of purchasing electricity and natural gas from the upstreaming energy system, the operation and maintenance expenses of devices, and the cost of abandoning wind power. The environmental cost is the cost of carbon emissions. And the objective function is as follows:
where
where
where
where
where
According to the theory of carbon conservation, the total carbon emission of RIES is only related to the energy purchased from the upstreaming energy market, which is also the amount involved in the calculation of the carbon emission cost. The carbon loss caused by energy loss is not considered in this paper. Based on the nodal carbon intensity of the input node of RIES, the actual carbon emission of RIES can be calculated by
2.4.3 Constraints of RIES
1) Energy balance constraints
The power balance constraint is shown as
where
The thermal balance constraint is shown as
where
The natural gas balance constraint is shown as
where the first two parts are the natural gas consumption of CHP units; the following two parts are the natural gas consumption of the GT and GB; and
2) Equipment operation constraints
The operation constraints of the WT and PV are shown as
where
The power output limit and ramping constraint of the GT are shown as
where
The heating output constraint is shown as
where
Constraints of CHP units are shown as (Xue et al., 2020)
where
where constraints (37) and (38) are electric output and thermal output constraints;
3 Solution method
This proposed model which considers the low-carbon economic operation of RIES at the upper level and the electricity and natural gas market-clearing at the lower level is a hierarchical bi-level model. Therefore, this model is transferred into a single-level model by replacing electricity and natural gas market-clearing models at the lower level with their KKT conditions. For the transformation process of KKT conditions, the readers can be referred to the literature (Yang et al., 2021).
3.1 Single-level model transformation
3.1.1 KKT conditions of electricity market-clearing model
As shown in the above research, this model is a linear programming problem; thus, its KKT conditions are as follows.
1) Stationarity
2) Other conditions
where the formation of these constraints
3.1.2 KKT conditions of natural gas market-clearing model
The proposed natural gas market-clearing model cannot be transferred into KKT conditions directly due to the sign function of Weymouth equation in the constraint (9). Therefore, this can be solved by the second-order-cone (SOC) relaxation. The process is as follows:
Then, it is transferred into an SOC constraint shown as
The Weymouth equation is presented as second-order-cone formation; thus, a penalty function is added to the objective function of the natural gas market-clearing model to relax the SOC constraint. Referring to a mixed-integer second-order-cone programming (MISOCP) model (Yan et al., 2021), based on the second-order-cone relaxation, a penalty term of the gas nodal pressure is added to the objective function to optimize the natural gas flow when minimizing the pressure difference between nodes. The new objective function of the natural gas market-clearing model is as follows:
where the second term is the penalty and
As second-order-cone programming, its KKT conditions are as follows.
1) Stationarity
2) Other conditions
3.2 MISOCP transformation
This single-level optimal operating model is non-convex and non-linear due to bilinear terms
3.2.1 Linearization of bilinear terms
Referring to the strong duality theory (Fortuny-Amat. and McCarl., 1981), it states that the value of the objective function in the primal problem is equal to that of its corresponding dual problem. Therefore, bilinear terms
Then, the bilinear terms
3.2.2 Linearization of complementary slackness
As known, the complementary slackness
Likewise, the SOC constraint in the natural gas market-clearing problem is also non-linear, which cannot be linearized by this big-M method. Therefore, this situation can be released by adding the penalty part to the objective function. For the SOC constraints in the proposed model, its complementary slackness is as follows:
In this model, the penalty part is used to tighten the SOC relaxation, which can stabilize the gap caused by SOC relaxation; thus, the gap of SOC relaxation is small enough to be ignored as shown in the following:
After the linearizing process, this proposed model is transferred from a mathematical problem with equilibrium constraints (MPEC) to a mixed-integer second-order-cone programming (MISOCP) problem, which can be solved by the commercial solver.
4 Case studies
In this section, a modified five-bus power system and seven-node natural gas system are employed to demonstrate the effectiveness of the proposed method. The hardware environment is a laptop with an Intel(R) Core(TM) i5/2.11 GHz CPU and 16 GB of RAM in Windows 11. All case studies are implemented on MATLAB R2021b and solved by GUROBI 9.5.1.
4.1 Five-bus power system and seven-node natural gas system
Figure 3 shows the topology of the five-bus and seven-node electricity and natural gas integrated systems. This electricity network contains four fossil-fired units, four electrical loads, and six transmission lines. The natural gas system includes two gas wells to supply gas, one compressor, five passive pipelines, and two gas loads. Table 1 shows the parameters of units and gas wells. The limits of electrical loads and natural gas loads are shown in Table 2. Carbon emission intensities of different types of units in the electricity network are shown in Table 3.
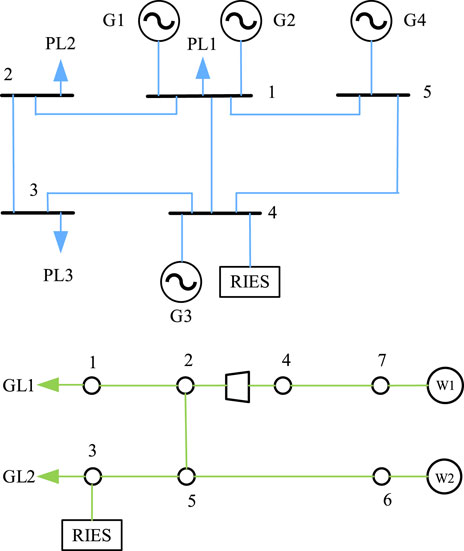
FIGURE 3. Topology of the five-bus power system and the seven-node gas system.
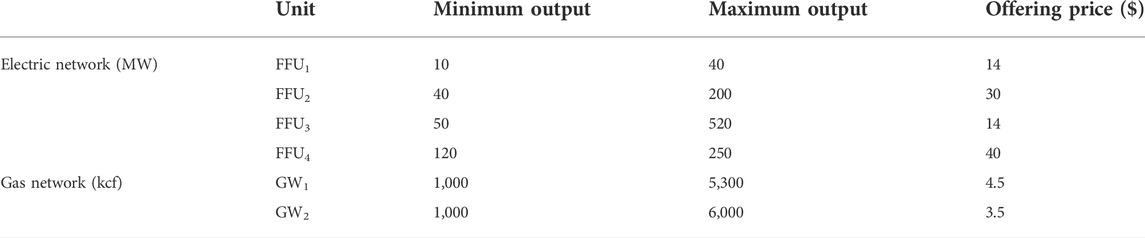
TABLE 1. Parameters of units and gas wells in the electric system and natural gas system.
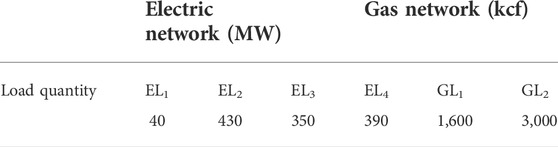
TABLE 2. Baseline electricity and gas loads.

TABLE 3. Carbon emission intensity of different types of units.
As shown in Figure 3, there is an RIES connected with bus 4 in the electrical network and node 3 in the natural gas network. In the RIES, there are one combined-heat-and-power unit (CHP), one gas turbine (GT), one gas boiler (GB), one wind turbine (WT), and one photovoltaic unit (PV) in the RIES. Efficiencies of the equipment are shown in Table 4 (Gu et al., 2020). The basic operating cost factors of the equipment are shown in Table 5. Table 6 presents some basic data and parameters of the nature gas network. According to the conservation of carbon, the carbon emission of natural gas part in the RIES can be calculated by hat the purchasing amount of gas multiplies by the carbon emission coefficient of natural gas, and the carbon emission coefficient of natural gas is 0.056 t/kcf.
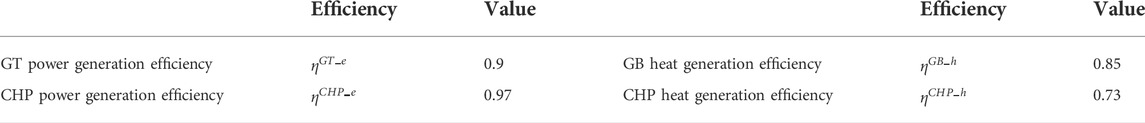
TABLE 4. Efficiencies of equipment in the RIES.
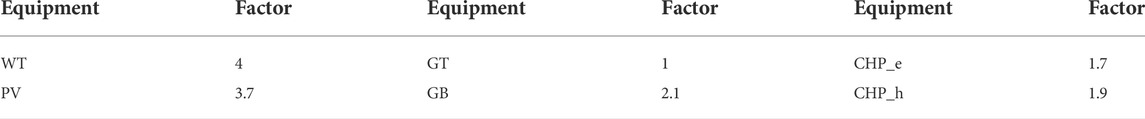
TABLE 5. Operating cost factor in the RIES.
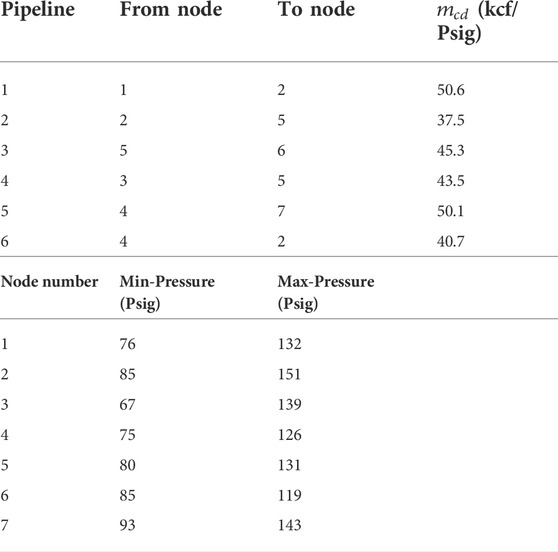
TABLE 6. Parameters of the gas network.
4.2 Operation of RIES with and without carbon prices
The optimal operation of RIES is considered under these two situations with and without considering carbon emission trading. Apparently, imposing carbon emission trading will influence energy prices of both electricity and natural gas. The carbon tax is set as 20$/ton (Cheng et al., 2020). The impacts of carbon prices on electricity or gas prices are examined such that market-clearing results of bus 4 and node 3 are presented, respectively, and they are connected with the RIES. While not considering the emission of the compressor, carbon emissions only depend on the gas consumption that nodal NCIs in the gas network are identical. Thus, the LMGP and the carbon price of natural gas will not change over time. The LMGP of node 3 is 4.5 $/kcf without considering the carbon emission cost and 3.5 $/kcf considering the carbon emission cost. The carbon price of the electrical system is related to different NCIs among buses in the electricity network. Figure 4 presents the LMEP of bus 4 while the RIES operates with and without considering the carbon emission cost. It is obvious that considering the carbon emission cost could make the LMEP increase.
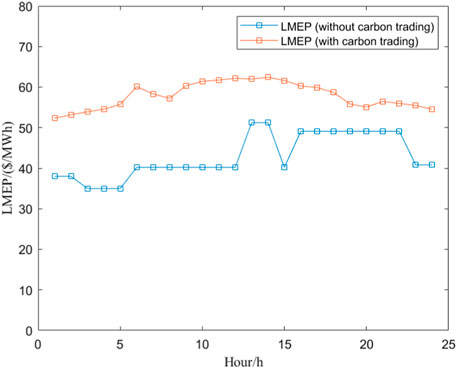
FIGURE 4. LMEP of bus 4 with and without considering the carbon emission cost.
Application of the carbon emission cost could facilitate the RIES to have a preference on gas as the energy source rather than electricity while the carbon emission of electricity is more intensive than that of natural gas. Obviously, the total operation cost of RIES will increase after considering the carbon emission cost. Nonetheless, the total carbon emissions of RIES decline from 39.63 to 35.27 kton when the carbon emission cost is considered. This result proves considering the carbon emission cost can effectively promote the de-carbonization of RIES as expected.
4.3 Operation of RIES with different carbon pricing methods
A comparison between different carbon pricing methods is presented. The first one is the carbon pricing method proposed in this paper, and another one is the fixed carbon pricing method which is supposed that the NCI over the network at each time is the same. Both of these two methods are based on the carbon tax of 20$/ton. Table 7 presents the total carbon emission and the total operation cost of these methods.
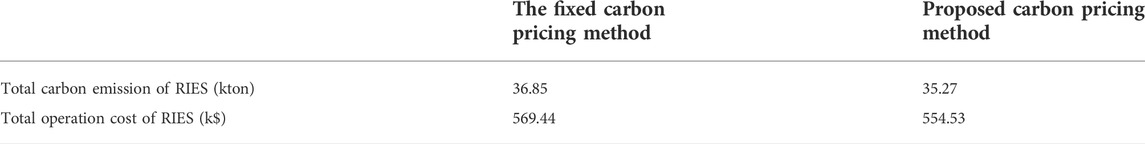
TABLE 7. Results for different carbon pricing methods.
In the fixed carbon pricing method, every consumer has the same carbon prices for every MWh of energy consumption. This approach does not indicate which users should take the responsibility for carbon emissions. It does not have the potential to regulate and reduce carbon emissions effectively. Therefore, its total carbon emission and total operation cost are higher than those of the proposed carbon pricing method. In the proposed carbon pricing method, these carbon prices are different from locations and time, which can recognize whether the NCI of the RIES’ location is high. When the carbon price of the electricity network is high, the operator in the RIES can reduce the requirement for electricity and is incentivized to purchase more low-carbon energy such as natural gas. As a consequence, this method can not only effectively stimulate consumers to utilize energy in a lower carbon approach but also provide a unified and correct carbon price for the RIES.
4.4 Impact of different carbon prices
Figure 5 illustrates that different values of carbon prices have a great influence on energy consumption and the total carbon emission of RIES as well. In this proposed carbon pricing model, the carbon price is relevant to the NCI and the carbon tax. Different levels of carbon taxes are employed to explore the impact of the value of the carbon price on electricity and gas consumption. The results change slowly when the carbon tax is low enough as 10 $/ton, which means the carbon price has a minor impact on energy prices. While the carbon tax is increasing to over 20 $/ton, the consumption of natural gas is also increasing, and the natural gas is more competitive. With the increasing carbon price, the electricity consumption and the total carbon emission of the RIES decline. Nevertheless, when the carbon tax increases at 40 $/ton, the increase in gas consumption and the decrease in electricity reach a gently changing stage, and the variation of the carbon price has a non-significant effect. From these results, it is demonstrated that consumers in the RIES are encouraged to use more low-carbon energy such as natural gas when the carbon emission cost is considered.
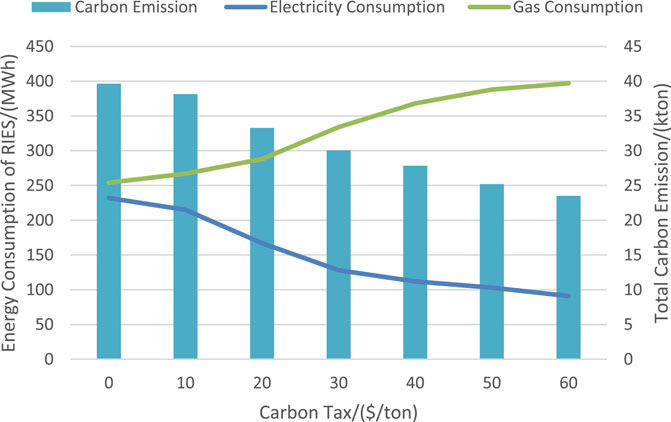
FIGURE 5. Results of different values of the carbon price.
5 Conclusion
This paper proposes a bi-level optimal low-carbon economic operation of RIES in interdependent electricity and natural gas markets, which incorporates the carbon emission cost to reduce the carbon emission of RIES. The carbon pricing method is based on the CEF model and the carbon tax policy which is more accurate than the fixed carbon price. The market-clearing models are transferred into KKT conditions, and a penalty function is imposed to tighten the gap of the SOC constraint in the natural gas market-clearing model. Case studies indicate that this proposed method can effectively accelerate the low-carbon economic operation of RIES. An appropriate increase in the carbon tax can further promote the utilization of low-carbon energy. Moreover, with the introduction of this carbon pricing approach and the carbon emission cost, the preference for low-carbon energy can realize the decarbonization of RIES.
Data availability statement
The original contributions presented in the study are included in the article/supplementary material, and further inquiries can be directed to the corresponding author.
Author contributions
ZX: conceptualization, methodology, software, and writing the original draft. LW, CJ: conceptualization, funding acquisition, supervision, and reviewing and editing. SZ, KG: methodology and reviewing and editing. LS, SZ, and KG: methodology and reviewing and editing.
Funding
This work is supported by the Project supported by the Shanghai Science and Technology Committee, China (No. 21DZ1208400).
Conflict of interest
The author LS was employed by State Grid Economic and Technological Research Institute Co, Ltd.
The remaining authors declare that the research was conducted in the absence of any commercial or financial relationships that could be construed as a potential conflict of interest.
Publisher’s note
All claims expressed in this article are solely those of the authors and do not necessarily represent those of their affiliated organizations, or those of the publisher, the editors, and the reviewers. Any product that may be evaluated in this article, or claim that may be made by its manufacturer, is not guaranteed or endorsed by the publisher.
References
Careri, F., Genesi, C., Marannino, P., Montagna, M., Rossi, S., Siviero, I., et al. (2011). Generation expansion planning in the age of green economy. IEEE Trans. Power Syst. 26 (4), 2214–2223. doi:10.1109/TPWRS.2011.2107753
Chen, R., Wang, J., and Sun, H. (2018). Clearing and pricing for coordinated gas and electricity day-ahead markets considering wind power uncertainty. IEEE Trans. Power Syst. 33 (3), 2496–2508. doi:10.1109/TPWRS.2017.2756984
Chen, S., Conejo, A., J., Sioshansi, R., and Wei, Z. (2020). Equilibria in electricity and natural gas markets with strategic offers and bids. IEEE Trans. Power Syst. 35 (3), 1956–1966. doi:10.1109/TPWRS.2019.2947646
Chen, S., Conejo, A., and Wei, Z. (2021). Conjectural-variations equilibria in electricity, natural-gas, and carbon-emission markets. IEEE Trans. Power Syst. 36 (5), 4161–4171. doi:10.1109/TPWRS.2021.3066459
Cheng, Y., Zhang, N., Wang, Y., Yang, J., Kang, C., Xia, Q., et al. (2019). Modeling carbon emission flow in multiple energy systems. IEEE Trans. Smart Grid 10 (4), 3562–3574. doi:10.1109/TSG.2018.2830775
Cheng, Y., Zhang, N., Zhang, B., Kang, C., Xi, W., Feng, M., et al. (2020). Low-carbon operation of multiple energy systems based on energy-carbon integrated prices. IEEE Trans. Smart Grid 11 (2), 1307–1318. doi:10.1109/TSG.2019.2935736
Cpc Central Committee and State Council, (2012). Opinions on fully, accurately and comprehensively implementing the new development concept to achieve peak carbon dioxide emissions and carbon neutrality.
Cui, Y., Zeng, P., Wang, Z., Wang, M., Zhang, J., and Zhao, Y. (2021). Low-carbon economic dispatch of electricity-gas-heat integrated energy system with carbon capture equipment considering price-based demand response[J]. Power Syst. Technol. 45 (02), 447–461. doi:10.13335/j.1000-3673.pst.2020.0100a
Fang, X., Hu, Q., Li, F., Wang, B., and Li, Y. (2015). Coupon-based demand response considering wind power uncertainty: A strategic bidding model for load serving entities. IEEE Trans. Power Syst. 31 (2), 1025–1037. doi:10.1109/tpwrs.2015.2431271
Fortuny-Amat, J., and McCarl, B. (1981). A representation and economic interpretation of a two-level programming problem[J]. J. Oper. Res. Soc. 32 (9), 783–792.
Gu, H., Yu, J., Li, Y., Zhang, H., and Zheng, Y. (2020). Bi-Level joint optimization economic dispatch of new-type town with multi-energy parks under environmental constraints[J]. Proc. CSEE 40 (8), 2441–2452. doi:10.13334/j.0258-8013.pcsee.190015
Hortacsu, A., and Puller, S., L. (2008). Understanding strategic bidding in multi-unit auctions: A case study of the Texas electricity spot market. RAND J. Econ. 39 (1), 86–114. doi:10.1111/j.0741-6261.2008.00005.x
Iqbal, F., and Siddiqui, A. S. (2017). Optimal configuration analysis for a campus microgrid—a case study. Prot. Control Mod. Power Syst. 2 (1), 23. doi:10.1186/s41601-017-0055-z
Jiang, T., Yuan, C., Bai, L., Chowdhury, B., Zhang, R., Li, X., et al. (2022). Bi-level strategic bidding model of gas-fired units in interdependent electricity and natural gas markets. IEEE Trans. Sustain. Energy 13 (1), 328–340. doi:10.1109/TSTE.2021.3110864
Jin, X., Wu, Q., Jia, H., and Hatziargyriou, N., D. (2021). Optimal integration of building heating loads in integrated heating/electricity community energy systems: A Bi-level mpc approach. IEEE Trans. Sustain. Energy 12 (3), 1741–1754. doi:10.1109/TSTE.2021.3064325
Kang, C., Zhou, T., Chen, Q., Wang, J., Sun, Y., Xia, Q., et al. (2015). Carbon emission flow from generation to demand: A network-based model. IEEE Trans. Smart Grid 6 (5), 2386–2394. doi:10.1109/TSG.2015.2388695
Li, Y., Han, M., Yang, Z., and Li, G. (2021). Coordinating flexible demand response and renewable uncertainties for scheduling of community integrated energy systems with an electric vehicle charging station: A Bi-level approach. IEEE Trans. Sustain. Energy 12 (4), 2321–2331. doi:10.1109/TSTE.2021.3090463
Liu, T., Zhang, Q., and He, C. (2021). Coordinated optimal operation of electricity and natural gas distribution system considering integrated electricity-gas demand response[J]. Proc. CSEE 41 (05), 1664–1677. doi:10.13334/j.0258-8013.pcsee.200385
Ritchie, H., and Roser, M. (2020). CO2 and greenhouse gas emissions. Our world data. [Online]. Available: https://ourworldindata.org/emissions-by-sector (Accessed Feb, 2022).
Ruiz, C., and Conejo, A., J. (2009). Pool strategy of a producer with endogenous formation of locational marginal prices. IEEE Trans. Power Syst. 24 (4), 1855–1866. doi:10.1109/tpwrs.2009.2030378
Tian, F., Jia, Y., Ren, H., Bai, Y., and Huang, T. (2020). Source-load" low-carbon economic dispatch of integrated energy system considering carbon capture system[J]. Power Syst. Technol. 44 (09), 3346–3355. doi:10.13335/j.1000-3673.pst.2020.0728
Wang, C., Wei, W., Wang, J., Wu, L., and Liang, Y. (2018). Equilibrium of interdependent gas and electricity markets with marginal price based bilateral energy trading. IEEE Trans. Power Syst. 33 (5), 4854–4867. doi:10.1109/tpwrs.2018.2796179
Wang, L., Hou, C., Ye, B., Wang, X., Yin, C., Cong, H., et al. (2012). Optimal operation analysis of integrated community energy system considering the uncertainty of demand response. IEEE Trans. Power Syst. 36 (4), 3681–3691. doi:10.1109/TPWRS.2021.3051720
Wang, Y., Qiu, J., and Tao, Y. (2022). Optimal power scheduling using data-driven carbon emission flow modelling for carbon intensity control. IEEE Trans. Power Syst. 37 (4), 2894–2905. doi:10.1109/TPWRS.2021.3126701
Wei, Y., Liu, L., Fan, Y., and Wu, G. (2008). China energy report: CO2 emissions research[M]. Beijing: Science Press, 11–36. (in Chinese).
Xue, Y., Li, Z., Lin, C., Guo, Q., and Sun, H. (2020). Coordinated dispatch of integrated electric and district heating systems using heterogeneous decomposition. IEEE Trans. Sustain. Energy 11 (3), 1495–1507. doi:10.1109/tste.2019.2929183
Yan, M., He, Y., Shahidehpour, M., Ai, X., Li, Z., Wen, J., et al. (2019). Coordinated regional-district operation of integrated energy systems for resilience enhancement in natural disasters. IEEE Trans. Smart Grid 10 (5), 4881–4892. doi:10.1109/TSG.2018.2870358
Yan, M., Shahidehpour, M., Paaso, A., Zhang, L., Alabdulwahab, A., Abusorrah, A., et al. (2021). Distribution network-constrained optimization of peer-to-peer transactive energy trading among multi-microgrids. IEEE Trans. Smart Grid 12 (2), 1033–1047. doi:10.1109/TSG.2020.3032889
Yang, H., Li, C., Huang, R., Wang, F., Hao, L., Wu, Q., et al. (2021). Bi-Level energy trading model incorporating large-scale biogas plant and demand response aggregator[J]. J. Mod. Power Syst. Clean Energy. doi:10.35833/MPCE.2021.000632
Yang, H., Li, C., Shahidehpour, M., Zhang, C., Zhou, B., Wu, Q., et al. (2021). Multistage expansion planning of integrated biogas and electric power delivery system considering the regional availability of biomass. IEEE Trans. Sustain. Energy 12 (2), 920–930. doi:10.1109/TSTE.2020.3025831
Zhang, G., Zhang, G., Gao, Y., and Lu, J. (2010). Competitive strategic bidding optimization in electricity markets using bilevel programming and swarm technique[J]. IEEE Trans. Ind. Electron. 58 (6), 2138–2146.
Keywords: the regional integrated energy system, carbon emission pricing, carbon emission flow, bi-level optimization, electricity market, natural gas market
Citation: Xiong Z, Luo S, Wang L, Jiang C, Zhou S and Gong K (2022) Bi-level optimal low-carbon economic operation of regional integrated energy system in electricity and natural gas markets. Front. Energy Res. 10:959201. doi: 10.3389/fenrg.2022.959201
Received: 01 June 2022; Accepted: 11 July 2022;
Published: 10 August 2022.
Edited by:
Mingyu Yan, Imperial College London, United KingdomReviewed by:
Yizhou Zhou, Hohai University, ChinaYixun Xue, Taiyuan University of Technology, China
Hanyu Yang, Nanjing Tech University, China
Copyright © 2022 Xiong, Luo, Wang, Jiang, Zhou and Gong. This is an open-access article distributed under the terms of the Creative Commons Attribution License (CC BY). The use, distribution or reproduction in other forums is permitted, provided the original author(s) and the copyright owner(s) are credited and that the original publication in this journal is cited, in accordance with accepted academic practice. No use, distribution or reproduction is permitted which does not comply with these terms.
*Correspondence: Lingling Wang, d2FuZ2xpbmdsaW5nMTk5M0BzanR1LmVkdS5jbg==