 Shuai Zhang1
- 1College of Water Resource & Hydropower, Sichuan University, Chengdu, China
- 2Dadu River Hydropower Development Co., Ltd., Chengdu, China
- 3Power China Hydropower Development Group Co., Ltd., Chengdu, China
The electricity market is evolving rapidly from pre-bid to spot markets, where the transactions between producers and consumers have become crucial and are vulnerable to safety risks. In addition, the new modes of transaction are also becoming popular and are said to have some risks. To reveal the impact of the new electricity transaction mode—spot market—on the safety risk and generation benefit, this article presents a simulation method connecting the transaction results and operation process. To verify the effectiveness of the proposed method, an actual cascade hydropower station (CHS) in the Dadu River basin, Southwestern China, which comprises eight hydropower stations, is selected. Hydraulic power matching among the CHSs is discriminated from four aspects with multiple indicators combined with the reality of a hydropower-dominated market in Sichuan, China. The dispatching decision-making process of hydropower generators is described with a multi-objective optimization model and then solved with a fast search strategy based on the classical output calculation method in hydrology. The security risks and economic damage hidden in the day-ahead market on a certain day are discovered and analyzed. The technology proposed provides support for bidding decisions in spot transactions and satisfies the reality during the transition period of electricity reform.
1 Introduction
Hydropower is and will be playing a critical role in global carbon neutrality and climate change; its global installed capacity is 1,360 GW (Wang et al., 2022). In China, the installed capacities reached 350 GW (Wang et al., 2022). The scale continues to expand globally and in China with the increasing demand and governmental commitment to carbon neutrality (Wang et al., 2022). Though measures have been taken, harvesting hydropower has not been uniform in all the regions for various reasons (Saini and Saini, 2019). When considering enrichment regions such as southwest Sichuan and Yunnan Province of China, harvesting hydropower remains challenging (Zhang et al., 2017). Sichuan is an important energy-producing area with 78 GW hydropower capacity to cover nearly 80% of the regional power supply (both reservoirs and runoff plants) (Luo et al., 2021). Under the constantly deepening electricity market reform, hydropower must be brought to market in Sichuan (Khorasany et al., 2020; Nunna et al., 2020). Unfortunately, a significant number of generators are unfamiliar with spot transactions; therefore, we attempt to build a bridge between the result of spot transactions and the operational process of cascade hydropower stations (CHSs), which shows the potential risks of the transactions more clearly and helps generators in bidding decision-making.
1.1 Research problem and literature review
The power supply is surplus in the wet season but is slightly close-fitting during the rest of the periods in Sichuan, China (Tian et al., 2021). In 2016, the total energy loss of water spillage was 28.75 billion, equivalent to 8 billion CNY (approximately 1.18 billion USD) (Ye et al., 2018). As a result, interprovincial transmission is hindered by channel capacity and economic policies (Li et al., 2018). At the same time, internal absorption lacks low vitality under the current market and dispatching model (Liu et al., 2018). Therefore, there is an urgent need for a market-oriented transaction model which will guide the investment direction accurately, improve the initiative of generators, and reduce the waste of low-carbon and renewable energy (Zhang et al., 2018; Zhang Z. et al., 2021). But the power system reform that came in 2015 introduced more intense competition in the electricity market (Lei et al., 2018); since then, generators can complete medium and long-term contract transactions skillfully (Yu et al., 2019). However, since August 2017, Sichuan and the other seven provinces have been encouraged to carry out pilot power spot transactions to provide the experience of full market development. By the end of 2022, each pilot would have been put into trial operation under the government’s guidance, but the development process has been slow. As the only hydropower-dominated electricity spot pilot in China (Cai et al., 2021), both market organizers (MO) and generators are not fully prepared for the new market. System operators have habituated themselves in to generating electricity according to dispatching schedules and enjoying preferential pricing from the government (Wang J. et al., 2018; Ye et al., 2020). Subsequently, it has become a mandate to reveal the relationship between the results of spot transactions and the operational process of the reservoirs to expose risks, but research in this cognate area remains sparse. As a result, the day-ahead market has shortened the trading interval to 15 min for power generators. The traditional long-term economic dispatching strategy that aims to maximize generation capacity (Akbari-Dibavar et al., 2021; Lu et al., 2021) is being solved by large-scale optimization algorithms (Niu et al., 2018), which cannot satisfy demand.
Researchers in the literature have achieved some progress in the short-term optimization of CHSs (Sioshansi, 2015; Rasmussen et al., 2016; Apostolopoulou and McCulloch, 2019; Shafiekhani and Badri, 2019; Wang et al., 2019; Lu et al., 2020; Su et al., 2020; Zhang S. et al., 2021). However, there is significant deviation between the linearized solution and actual operation of the power stations (Sioshansi, 2015; Apostolopoulou and McCulloch, 2019). In addition, researchers have paid much attention to the bidding strategy, which directly affects the returns of the generating companies (Shafiekhani and Badri, 2019; Wang et al., 2019; Su et al., 2020). The comparison between the bidding and clearing results has been of less concern (Zhang S. et al., 2021), resulting in ignoring key factors such as unit and reservoir operating safety (Lu et al., 2020). So, turning to MOs could be a possible option, but the transition still lacks a distinct clearing model for the hydropower-dominated spot market. In some other hydropower systems, such as in Brazil and other countries, hydropower is purchased at a subsidized price to ensure adequate power supply (de Queiroz et al., 2016) where the generator can conduct self-dispatching as a pricemaker (Loschenbrand and Korpas, 2019).
On the contrary, in pool-based hydropower systems, such as in Norway and Sweden, the generation schedule and settlement price are determined with unified clearing (Pereira et al., 2017; Seljom and Tomasgard, 2017), similar to that in Sichuan, China. Meanwhile, when considering power line lock, the locational marginal price (LMP) from PJM, US market, is involved (Exizidis et al., 2019; Ali et al., 2021), and then a unique weighed clearing price is obtained. Due to the slow progress of clearing, MOs have to complete this task with security-constrained economic dispatch (SCED) in the day-ahead market (Xu et al., 2017). At the same time, real-time load balance and inflow uncertainty would be solved by bidding in a real-time market (Zhou et al., 2020). Finally, signed contracts in medium- and long-term markets are decomposed and then involved in a settlement-based “contract for difference (CFD)” to minimize bidding risk (Douglas Foster et al., 2019). The root cause of this issue is attributed to the complex, nonlinear coupling relationship between the CHSs, which is shown in the following aspects. Firstly, inflow is the primary factor of market supply capacity, resulting in different bidding strategies (Helseth et al., 2017; Li et al., 2019). Then, the water from the upstream power station will be used as the inflow of the downstream power station, which directly affects the power generation process (Wang X. et al., 2018). When multiple owners manage a cascade system, this information is unknown. A study attempted to divide the alliance according to the hydraulic connection to overcome owners' restrictions. The rationality of alliance with the symbiosis theory was proposed by Zhu et al. (2021) which later verified alliance’s stability with the game theory (Liu et al., 2020). But here comes a new problem: when there are multiple nodes in the basin, as in the Dadu River, the alliance will collapse automatically and SCED must take the power station as the unit. Last but not the least, different from thermal power (Ye et al., 2017), it is impossible to forecast inflow accurately. However, in timely checking the transaction results according to the real-time parameters and rolling bidding in the real-time market can be a good choice. For this, simulation and verification in advance are essential measures to mine and avoid risks (Huang et al., 2019). The development of intelligent systems and software packages makes this simulation and verification more convenient. Ding Q et al. developed a spot transaction decision support system (Ding et al., 2018). Zakeri et al. (2016) simulated a multiregional electricity market, which made generators respond quickly to changes in market rules and environment. More recently, such simulations and decision-making in the electricity market have become more popular as the power generation systems became an integral part of the smart grid systems (Ringler et al., 2016). Whereas the previous research of Ivar Skjelbred and Kong (2018) made intraday replanning after simulating the actual operation process. The study by Aliabadi et al. (2017) concluded bidding decision-making by simulating the bidding behaviors of generators under different market modes, such as capacity and auxiliary market. Chen et al. (2017) applied the same method in another hydro-dominated environment for the power generation system in Yunnan Province of China.
1.2 Key contributions
Considering the research problem and gap stated in Section 1.1, we re-stored the results of spot transactions for CHSs to the operation process of reservoirs and stations by fully considering the hydroelectric coupling relationship between the CHSs. Some indicators are selected to describe the mismatch between the CHSs quantitatively. The Sichuan electricity spot market is considered as the case study. The meaning and discrimination methods of hydraulic power matching between the CHSs are described from four aspects with the help of multiple numerical indicators. We simulated the dispatching decision-making process of CHSs with a multi-objective optimization model followed by a fast search strategy for an equilibrium solution. The results provide the basis for load adjustment and bidding decision-making in the real-time market.
The key contributions of this study are as follows:
• In the transition period from the dispatching schedule to market transaction, this study puts forward a reliable risk identification and auxiliary decision-making approach that allows verification with the actual system.
• An efficient and accurate search strategy for multidimensional, nonlinear, and multi-objective problems is proposed, which expands the classical output calculation of hydrology from a single power station to the CHSs.
• The hydraulic power matching between the CHSs is quantified from multiple dimensions, providing a reference for subsequent transaction strategy decision-making and clearing improvement in the hydro-dominated market.
This study is organized into six sections. Section 2 presents the matching discrimination methods for the results of spot transactions. Section 3 demonstrates the model for simulating the dispatching decision-making of the CHSs in a market transaction and its calculation strategy. Section 4 presents the case study and test system used for an investigation, followed by results and discussion in Section 5. Lastly, the conclusions and drawbacks drawn from this study are presented in Section 6.
2 Matching discrimination methods
The spot electricity market is still immature in Sichuan, mainly reflected in the single type of transaction. Currently, only the day-ahead and real-time markets of electric energy have been open for the time being. In the former, the generators submit each period’s generation capacity and bidding price one day in advance (D-1). Turning to the latter, only the maximum generating capacity is submitted 1 hour in advance (T-1). The transaction results are distributed after the unified clearing of the MO. The complete process of spot transactions is illustrated in Figure 1.
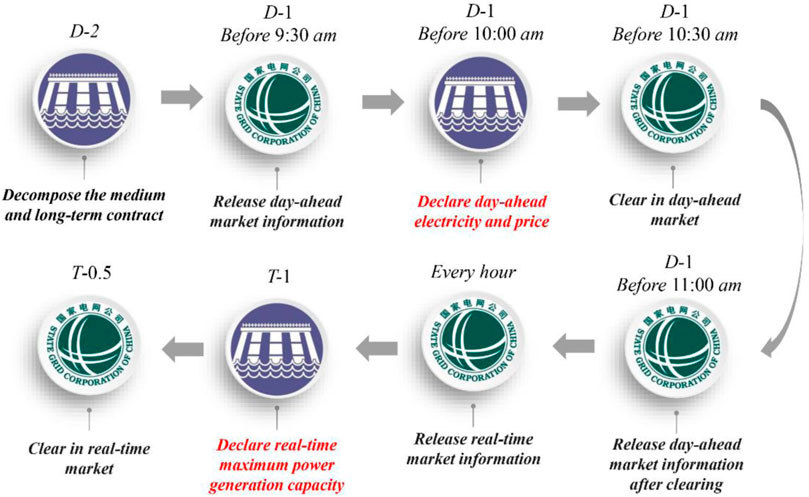
FIGURE 1. The time flow of spot trading in Sichuan.
Natural runoff significantly affects the supply and demand situation of the high-proportion hydroelectric power market. The supply exceeds demand during the wet season (June to October), resulting in a significant waste of hydropower resources. In the dry season, the supply is close-fitting due to the restrictions in coal supply. To promote hydropower absorption during the wet season, the waste of clean energy is reduced and sufficient power supply during the dry season is ensured, and hydropower plants only participate in spot market bidding during the wet season. The monthly hydropower generation, the power demand of Sichuan, and inflow runoff in the largest hydropower station are therein illustrated in Figure 2.
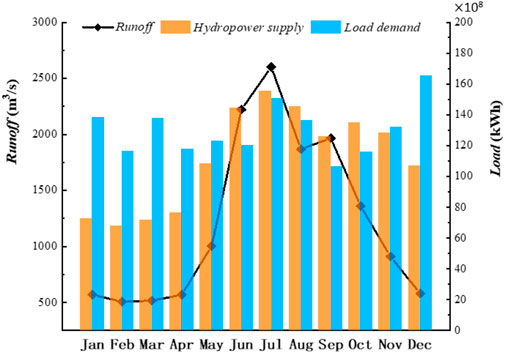
FIGURE 2. Annual runoff, generation, and load demand: Sichuan power grid.
To maximize the utilization of hydropower resources in the basin, the same owner’s CHSs adopt a unified method to optimize the volume and price combination process of each power station in the cascade according to the hydraulic connections therein, thereby forming a volume price and declaration plan for each power station in the cascade. However, the MO pursues minimization of expenditure during market clearing. Meanwhile, large-scale cascade hydropower clusters are often divided into multiple planning units during market clearing. Compared with the declared plan, both loads of a single power station at each time period or the load between the power stations in the same time period must have undergone significant changes. Therefore, it is necessary to simulate the load results according to the mode of organization and verify whether there is a mismatch between hydraulic and power in the cascade system.
The CHSs usually consist of one or two reservoirs connected with a series of runoff stations. The mismatch within the CHSs is described as follows: the upstream obtains less volume due to bidding failure, so they have to release less water. As for the downstream, the low running water head makes the power generation task impossible to complete when water is insufficient. This deviation may cause a loss of revenue. As the reservoir reaches the upper limit of storage capacity, all stations are forced to release water; a large amount of water spillage means clean energy wastage. Unfortunately, this mismatch occurs almost every day in the wet season.
The matching verification focuses on four aspects and has been quantified with many indicators. Firstly, output simulation ensures that the real-time output covers the transaction results and fully uses the water resources. Secondly, safety operations are checked to verify whether the hydraulic and electric constraints are damaged. Then, more attention is paid to the process of water spillage, the quantity of water, and generation of waste. Lastly, the benefit from the bidding is evaluated according to the settlement rules. When a mismatch occurs, it is advisable to strive for more capability in real-time bidding, which guarantees reservoir safety and benefits in market competition. The technology roadmap is displayed in Figure 3.
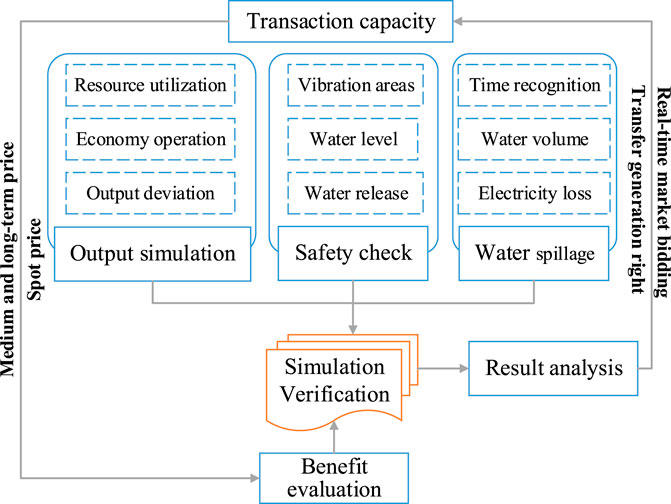
FIGURE 3. Technology roadmap.
2.1 Output simulation
This part analyses the simulation results from the generation output. In addition to the apparent output deviation, the calculation results of the following four indicators can also show the effect on economic operation.
2.1.1 Water resource utilization
It is a numerical indicator reflecting the runoff conversion efficiency of a hydropower plant, which is recorded as
2.1.2 Load rate
It is an economic indicator to measure the utilization degree of units. It is recorded as
2.1.3 Comprehensive water consumption rate
The water consumption per unit of power generation is recorded as
2.1.4 Generating equipment availability hours
The operating hours of power generation equipment under full load operation are recorded as
In the calculated results, if the load rate and availability hours are low for the stations with reservoirs, it results in low water resource utilization or high water consumption rate, or even the load transaction task cannot be completed for other stations. This result indicates that the transaction results exhibit the risk of mismatch between upstream and downstream operations.
2.2 Safety risk identification
The safety of reservoirs and generating units is the basis and premise for successfully implementing transaction results. Therefore, it is necessary to reveal and warn the risks in advance when hydraulic power mismatch threatens the safe operation.
The vibration areas of each plant should be avoided as much as possible during power generation and this is determined by a ternary, implicit function containing the vibration area, real-time net head, and available status of each generation unit:
The forebay elevations of reservoirs are usually limited to below the maximum in the wet season, which leaves surplus storage space for uncertain inflow. However, it is contradictory to the efficient production of electricity. It is insufficient to consider the upper and lower bounds of forebay elevations of reservoirs alone. The change speed of elevations during the dispatching period is also crucial to the safety of hydraulic structures. In particular, this constraint is indispensable for reservoirs.
Besides power generation, reservoirs usually play an important role in shipping, agricultural irrigation, and ecological landscapes. These functions put forward a series of constraints on the water release of the reservoirs.
2.3 Estimation of water spillage
When the forebay elevations of reservoirs gradually rise to the upper bound, the water spillage from the plants will naturally ensue, which implies a waste of renewable energy. The electricity loss with water spillage concerns generators, dispatching institutions, and government sectors.
This part pays attention to three aspects: firstly, time recognition to determine the time and distribution range of spillage water. Secondly, calculated natural water loss in the whole dispatching period. Finally, the conversion of water loss into generation wastage according to Eq. 6:
where
2.4 Benefit evaluation
In the current electricity market, spot transaction, including day-ahead and real-time markets, is only a supplement to medium- and long-term contracts. The load curves after day-ahead market clearing are formed by superimposing the following curves: interprovincial power-transmission curve, prior electricity generation curve, decomposition curve of medium- and long-term contracts, and the curve in the day-ahead market. Each part uses a different method for settlement, and the specific mode is shown in Figure 4. The first two parts represent fixed price, while the settlement mode based on CFD leads to bidding risk, which directly determines the benefits of the bidding.
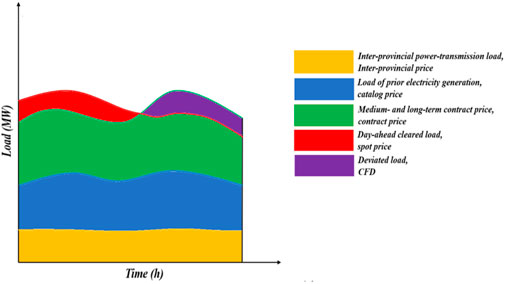
FIGURE 4. Load curves under day-ahead market clearing and corresponding settlement modes.
CFD is a reasonable path to reduce the loss of bidding failure in the immature market environment. Medium- and long-term contracts can avoid economic risks as far as possible. The profit is mainly from medium- and long-term contracts and day-ahead market, then reducing power deviation in real time. The benefits under the CFD settlement method are calculated as follows:
where
3 Model and algorithm
3.1 Model description
When receiving the transaction result, generators are willing to fully use reservoirs’ regulation capacity to complete tasks with low water consumption. However, the failure of hydraulic power matching causes output deviation and water spillage, especially for runoff stations. Therefore, we describe the dispatching decision-making process of CHSs with an optimization model, whose results will reflect the real power generation operation process.
Objective 1: the output of each station shall be close to the transaction result as much as possible, that is, minimizing the deviation:
Objective 2: improve the utilization efficiency of water resources and reduce water consumption, especially water spillage:
Constraint conditions:
(a) Water balance
(b) Forebay elevation of reservoirs
(c) Water discharge
(d) Water release
(e) Vibration areas of plants
(f) Relationship between forebay elevation and volume
(g) Relationship between tail-race elevation and water release
(h) Reservoir net head
(j) Hydroelectric power generation function
(k) Types of variables
3.2 Algorithm
The simulation model above is a complex optimization problem with multiple dimensions, stages, and objectives, whose Pareto front is almost impossible to be described thoroughly. Moreover, the time to search for the complete solution set is far more than 15 min, which is not conducive to rapid decision-making in the spot market. Decision makers determine whether there is a mismatch through a few equilibrium solutions in a short time and then formulate bidding strategies in a real-time market. Therefore, we redesigned the fast search algorithm for an equilibrium solution from the reality of decision-making.
The algorithm design considers the following principles: firstly, objective 1 is directly related to the benefits and deserves more attention. Then, minimizing the error during calculation restores the real operation process of the stations’ reservoir and runoff. Last but not the least, reasonable time consumption spares enough time for marketing decision-making.
In order to maintain the balance and stability of the grid, generators organize power generation in strict conformity with the transaction results such that the actual output is not greater than the expected output. Suppose the hydraulic power matching relationship is destroyed, the transaction result will be regarded as the infeasible solution of the above optimization. Considering this, we fully use the solution’s information and retain the original transaction result as much as possible to reduce the output deviation. The classical output calculation method in hydrology can quickly obtain the forebay elevation and water discharge process corresponding to each result. Especially after complete iteration using binary search, it will converge to the maximum generation capacity corresponding to the current water volume.
The input of inflow in each period is the key to accurate calculation, and it is also an essential feature of CHSs. However, the propagation time of flows τ between the CHSs cannot be ignored in short-term scheduling operations. Thus, the asynchronous propagation of water energy divides the complete calculation process into three parts, as shown in Figure 5.
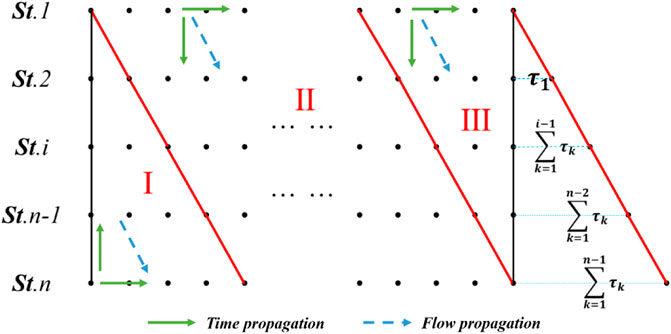
FIGURE 5. The effect of the propagation time of flows τ.
We discard the linearization of constraint (21) to maximize the accuracy of the calculation. Moreover, the binary search compresses the target space and ensures the stability of the solution. Finally, the solution set consists of some transaction results and the closest output. It is the dominant solution of objective 1, a Pareto equilibrium solution of the multi-objective problem. The specific steps are described as follows and shown in Figure 6.
Step 1: The initial forebay elevation
Step 2: The inflow information is unknown in both part 2 and 3; thus, the periods of each station in part 1 is first calculated with the output calculation method in hydrology and binary search. The result, including forebay elevation, water discharge, and release, is input to subsequent calculations according to time propagation as shown in Figure 5.
Step 3: The flow propagation in Figure 5 represents the propagation direction of inflow information: the inflow of each period is calculated one by one according to eq. 11, and the output calculation repeated until the operation results of all points are obtained successively.
Step 4: The safety risk and economic evaluation indicators are calculated with the results in Step 3 according to Section 2. Then, the matching among the CHSs is analyzed.
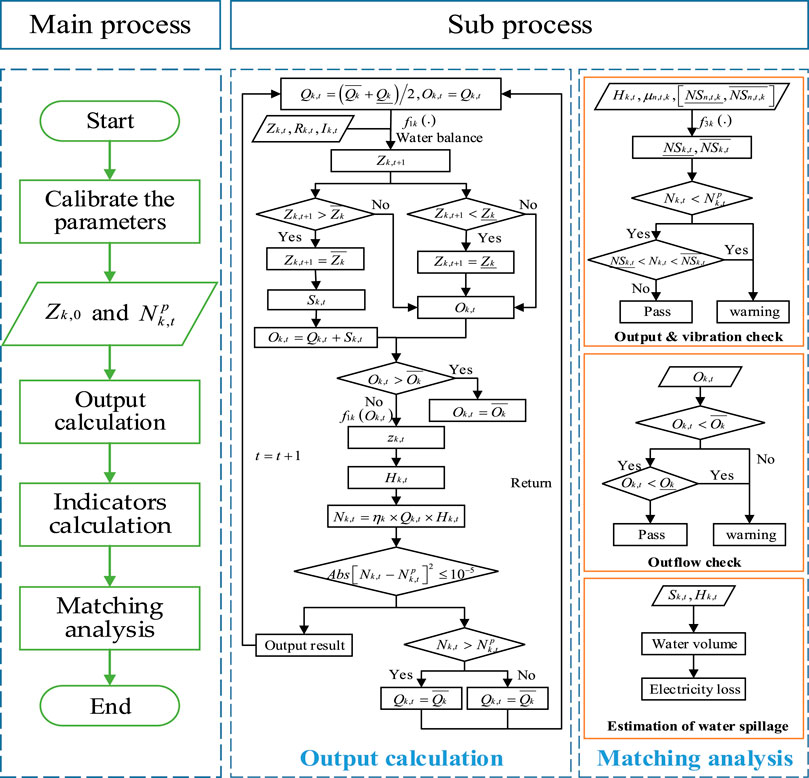
FIGURE 6. Algorithm for simulation and verification.
4 Case study: Cascade hydropower system in the Dadu River basin
This article uses an existing cascade system in the Dadu River basin, Southwestern China. The positions and configurations of the CHSs are illustrated in Figure 7, which comprise eight hydropower stations named HZY, DGS, PBG, SXG, ZTB, SP, GZ, and TJZ. Their total capacity reaches 11,095 MW, and the parameters of each station are listed in Table 1. The CHSs are all managed by Dadu River Hydropower Development Co., Ltd. and naturally adopt a consistent bidding strategy in the electricity market. In addition, the total capacity of the eight stations accounts for nearly 20% of the power supply in Sichuan, China. Any deviation caused by hydraulic power mismatch among the CHSs will threaten the stability of the power grid.
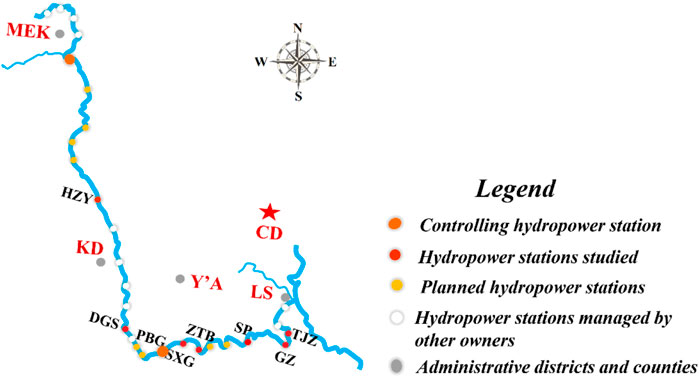
FIGURE 7. Distribution of the hydropower stations.
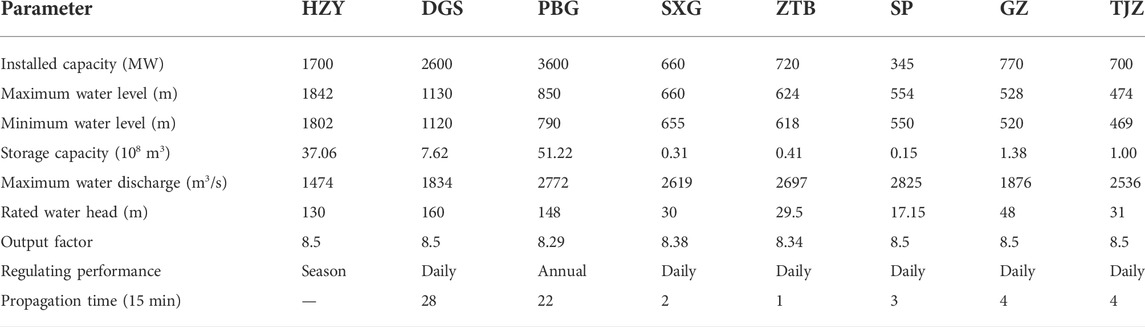
TABLE 1. Hydropower station parameters.
5 Results and discussion
The total load transaction result of the test system mentioned above is 625 GW. However, the load deviation reached 10.1 GW due to mismatch, which accounts for 1.62% and almost covered all the middle and later schedule periods. Among them, the most significant deviation appears in ZTB (8433 MW), accounting for 17.4% of that station’s total load transaction result. GZ and TJZ account for 1.2 and 1.8%, respectively. The load deviation time distribution is shown in Figure 8.
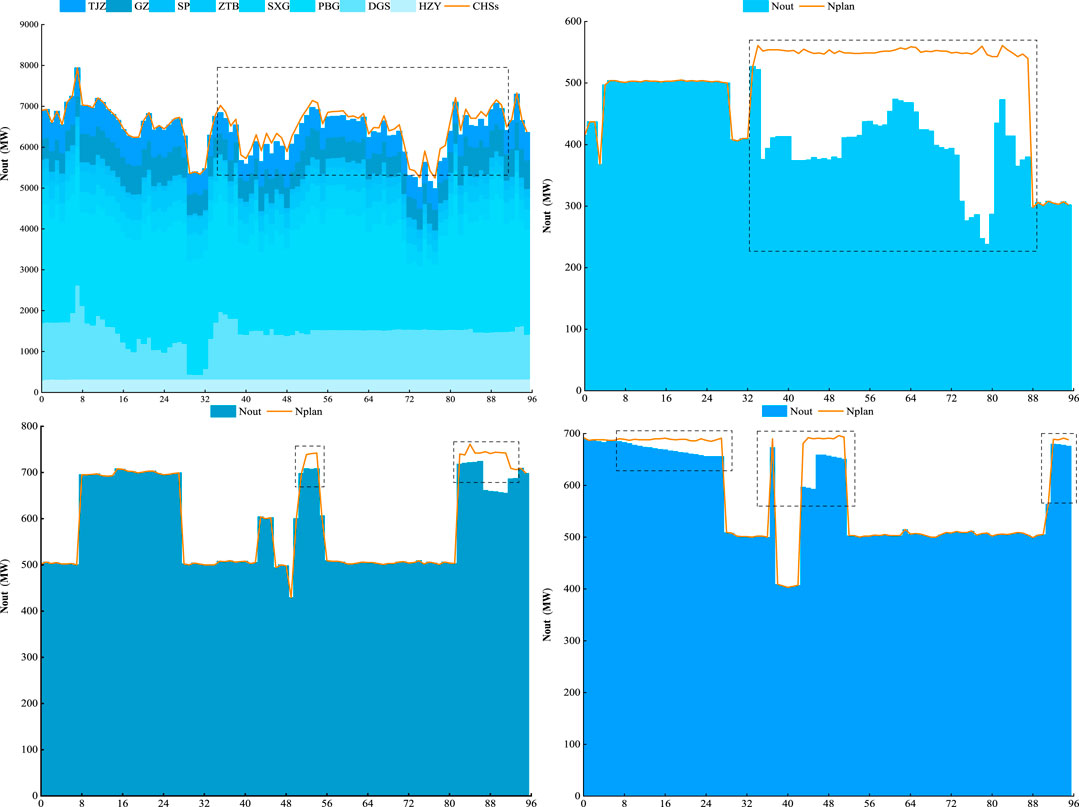
FIGURE 8. Completion results for the load transaction result, from left to right: ZTB, GZ, and TJZ.
Changes in the water heads at some hydropower stations during the operation are plotted in Figure 9 to ascertain the reasons for failure to satisfy the transaction generation. The operating head of the power station is below the design head in ZTB, GZ, and TJZ (TJZ is lower in some periods), which can cause output attenuation among the hydropower stations.
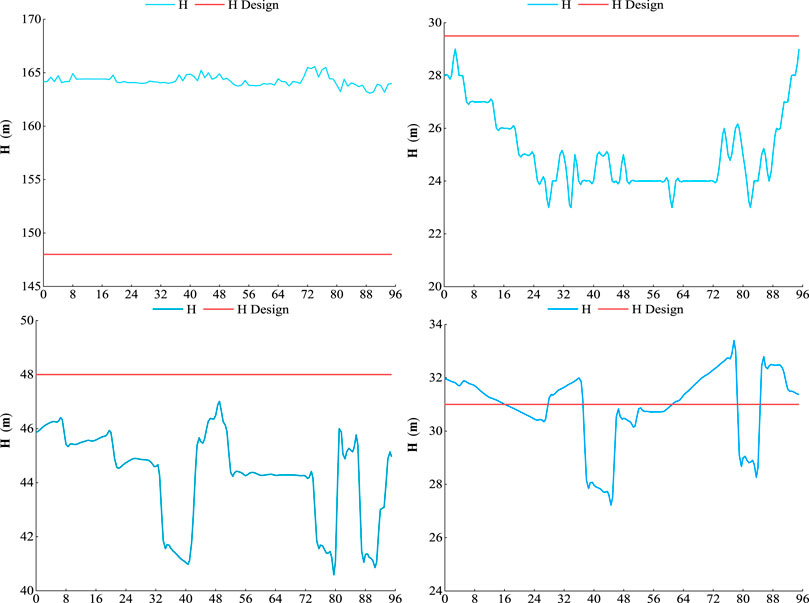
FIGURE 9. Changes in water head during operation, from left to right: PBG, ZTB, GZ, and TJZ.
The various economic indices of different CHSs mentioned in Section 4 are calculated and listed in Table 2. The water resource utilization and load rates of HZY, DGS, SP, and GZ are lower than those of the other four hydropower stations. The water consumption rate for ZTB and SP is higher than is for the others because there is a significant negative correlation between the rate of water consumption of hydropower stations and the head of water during the operation of such hydropower stations.
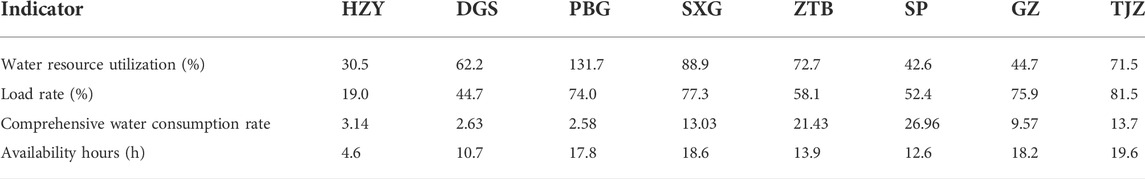
TABLE 2. Calculated economic operation indices.
In summary, the hydraulic power mismatching among CHSs is hidden in spot transaction results; the abundant hydropower resources in the basin are not fully utilized in the wet season. HZY, DGS, ZTB, and SP should fully excavate their generation capacity and fully compete in the real-time market.
Figure 10 shows the combination and distribution of vibration zones in HZY and PBG, the two plants with reservoirs and a huge installed capacity in the test system. All CHS units were available on; the check shows that the transaction results of the various hydropower stations in all intraday time periods do not fall within the fluctuation range.
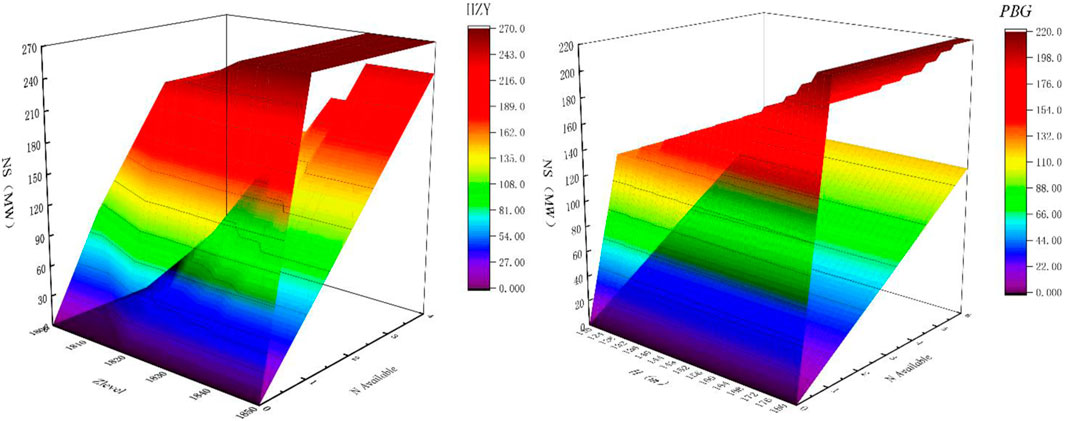
FIGURE 10. Range of fluctuation of hydropower stations HZY and PBG.
The initial forebay elevations of each station correspond to the forebay elevations at 00:15 on that day. Moreover, the daily rate of change in forebay elevations at hydropower station HZY is 0.5 m/d. In comparison, PBG presents a daily growth rate and reduced rates of 1.2 m/d and 1.5 m/d, respectively. The simulation results of the water level are shown in Figure 11.
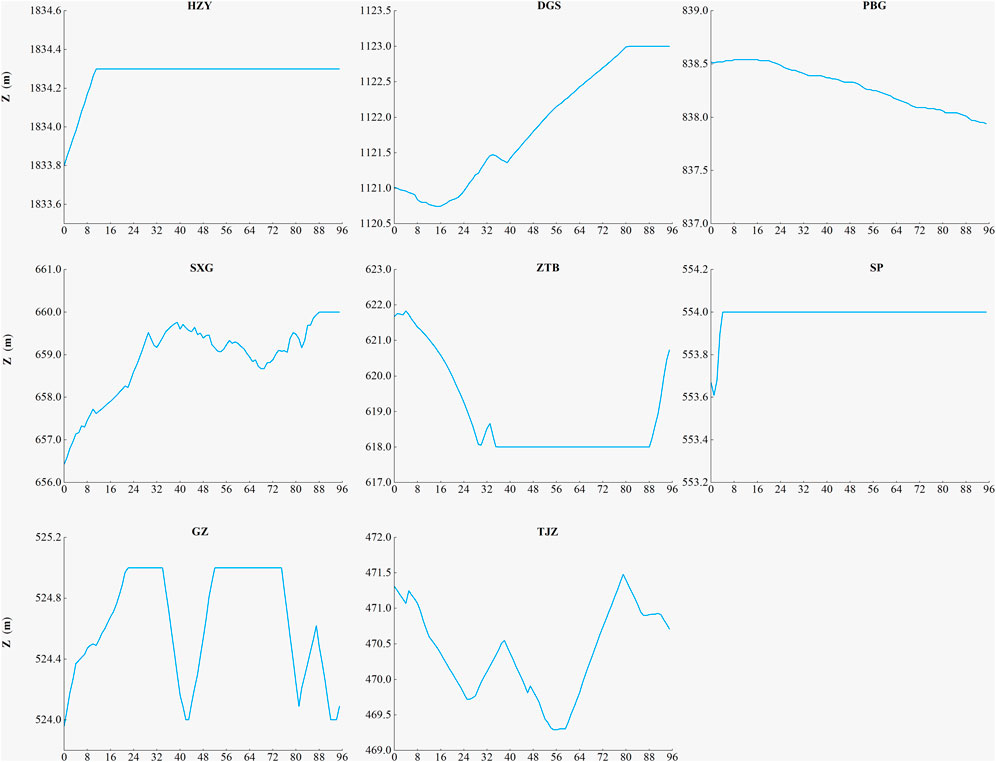
FIGURE 11. Changes in forebay elevations at CHSs.
The changes in water levels at various hydropower stations were obtained through simulation. Except for hydropower station SP, the highest water levels of the other hydropower stations do not reach the normal pool level. By contrast, the reservoir water levels satisfy the requirement of flood control safety in flood seasons. However, the hydropower station ZTB operates at a low water level for a long time and hydropower stations GZ and TJZ also operate at a low water level for some time periods. This causes the water head at these hydropower stations to be much lower than the design head of the generating units.
In summary, 3.38
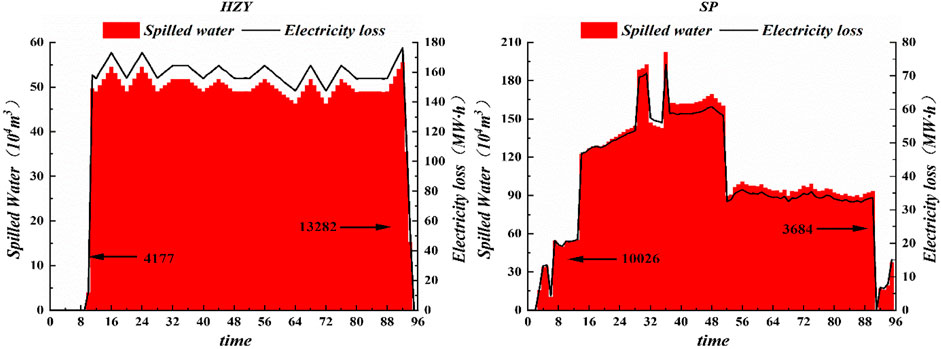
FIGURE 12. Calculated spilled water and generation wastage from HZY and SP.
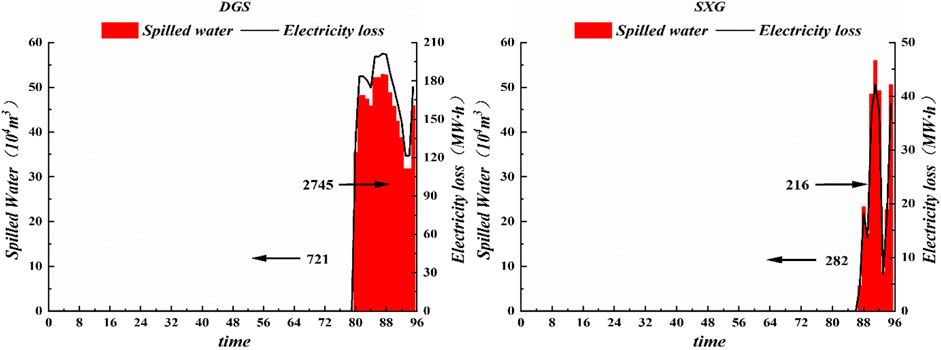
FIGURE 13. Calculated spilled water and generation wastage from DGS and SXG.
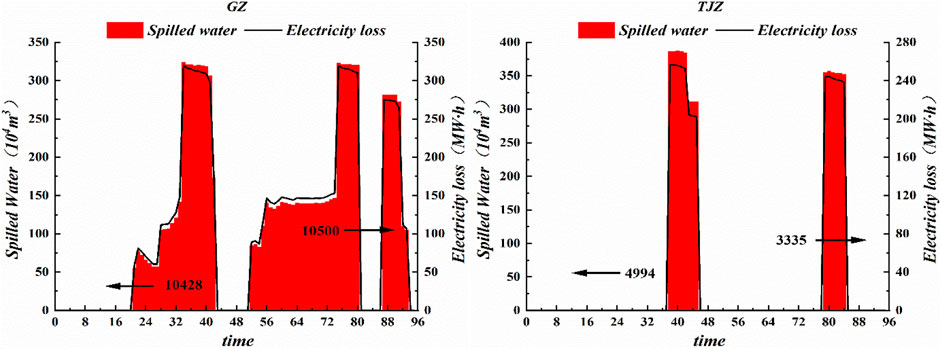
FIGURE 14. Calculated spilled water and generation wastage from GZ and TJZ.
Same as the price bidding strategy, the average price transaction results among CHSs are observed to be the same. Nevertheless, the profits exhibit a noticeable difference (see Figure 15). As an objective economic law, there is a direct natural relationship between income and power generation. For example, the electricity generation at PBG is three to five times that at the other hydropower stations. However, HZY and SP separately account for 1/9 and 1/15 of the electricity generated at PBG.
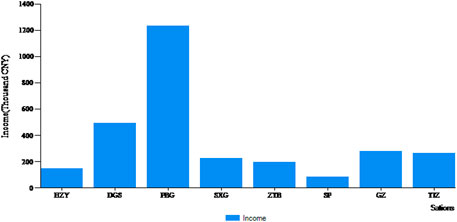
FIGURE 15. Comparison of profit and power generation among the test system.
Moreover, the CFD settlement method causes the loss of profits from power generation. DGS and SP do not satisfy the electrical energy generation required from medium- and long-term markets in many time periods during the bidding process. In this context, the profit margin is squeezed.
The model and technology proposed have been incorporated into the spot transaction bidding system for CHSs of CHN Energy Co., Ltd. (Figure 16). Relying on a comprehensive data collection and transmission cloud platform, the system can automatically capture inflow, water level, unit status, transaction information, and others. Adaptively rolling simulation and deduction can realize real-time transaction risk monitoring a day ahead and assist bid decision-making. Up to now, the system has been running stably for nearly 2 years. The actual risk warning of safety and economic operation results of the system on a certain day are illustrated in Figures 17, 18, respectively.

FIGURE 16. Login and home pages of spot transaction bidding system for CHSs of CHN Energy Co., Ltd.
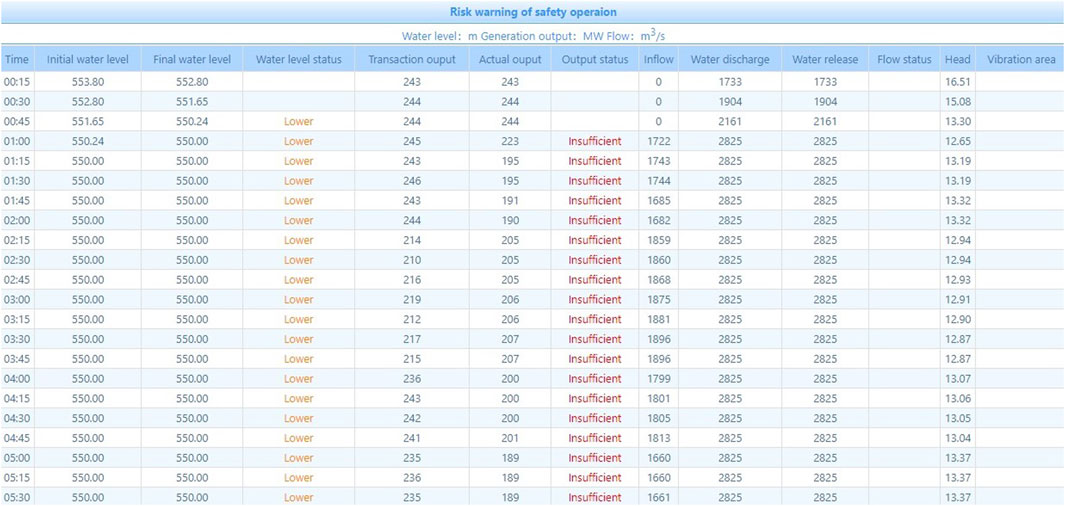
FIGURE 17. Risk warning of safety operation results in the spot transaction bidding system.
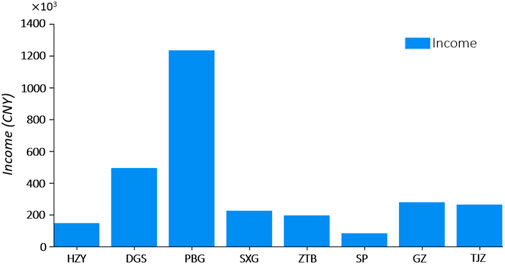
FIGURE 18. Economic operation results in the spot transaction bidding system.
6 Conclusion
Considering the requirements of electricity market reform and reality in a hydro-dominated power system, a simulation approach to risk and economic evaluation among CHSs in spot transactions was proposed. Hydraulic power matching is the key, as well as a difficulty of the problem, so multiple numerical indicators from four aspects were selected to describe it. Furthermore, a model to simulate the decision-making process of hydropower generators was constructed and solved with an algorithm strategy that considers minimum error and reasonable time consumption. In this process, the classical output calculation of hydrology was expanded from a single power station to CHSs. Finally, a cascade system in Southwest China comprising eight hydropower stations with their real transaction results was used for verification. Through discussion, the security risks and economic damage hidden in the day-ahead market on a certain day were discovered and analyzed. The technique proposed provides support for bidding decisions in spot transactions and satisfies the reality during the transition period of electricity reform.
The proposed method’s deficiency lies in regarding the propagation time of flows between the CHSs as a fixed value during calculation. However, the flow propagation time changes dynamically during a hydropower station’s actual operation. Thus, the actual propagation time presents a certain difference relative to the fixed value used during calculation, which influences the calculation of the actual change of forebay elevations under corresponding outputs from hydropower stations to some extent. In subsequent research, the propagation time of flows will be introduced to calculations after being graded and calibrated to reduce the errors.
Data availability statement
The original contributions presented in the study are included in the article/supplementary material, and further inquiries can be directed to the corresponding author.
Author contributions
Conceptualization: SZ and GM; methodology: SZ; software:WH; validation: SZ, GM, and CT; formal analysis: BY and YX; resources: CT; writing—original draft preparation: SZ. All authors have read and agreed to the published version of the manuscript.
Funding
This research was funded by the National Natural Science Foundation of China, grant number 52039006; and National Key Research and Development Plans, grant number 2018YFB0905204.
Conflict of interest
Tao C-H was employed by the company Dadu River Hydropower Development Co., Ltd. and Yang B-Q and Xue Y-L were employed by the company Power China Hydropower Development Group Co., Ltd.
The remaining authors declare that the research was conducted in the absence of any commercial or financial relationships that could be construed as a potential conflict of interest.
Publisher’s note
All claims expressed in this article are solely those of the authors and do not necessarily represent those of their affiliated organizations, or those of the publisher, the editors, and the reviewers. Any product that may be evaluated in this article, or claim that may be made by its manufacturer, is not guaranteed or endorsed by the publisher.
References
Akbari-Dibavar, A., Mohammadi-Ivatloo, B., Zare, K., Khalili, T., and Bidram, A. (2021). Economic-emission dispatch problem in power systems with carbon capture power plants. IEEE Trans. Ind. Appl. 57 (4), 3341–3351. doi:10.1109/tia.2021.3079329
Ali, H., Aslam, F., and Ferreira, P. (2021). Modeling dynamic multifractal efficiency of US electricity market. Energies 14 (19), 6145. doi:10.3390/en14196145
Aliabadi, D. E., Kaya, M., and Şahin, G. (2017). An agent-based simulation of power generation company behavior in electricity markets under different market-clearing mechanisms. Energy Policy 100, 191–205. doi:10.1016/j.enpol.2016.09.063
Apostolopoulou, D., and McCulloch, M. (2019). Optimal short-term operation of a cascaded hydro-solar hybrid system: a case study in Kenya. IEEE Trans. Sustain. Energy 10 (4), 1878–1889. doi:10.1109/tste.2018.2874810
Cai, Z., Li, Q., and Dai, S. (2021). “Discussion on key technologies and model for hydropower-dominated electricity spot market in sichuan,” in 2021 China international conference on electricity distribution (CICED), Shanghai, China, 07-09 April 2021, 1074–1078.
Chen, F., Liu, B., Cheng, C., and Mirchi, A. (2017). Simulation and regulation of market operation in hydro-dominated environment: the yunnan case. Water 9 (8), 623. doi:10.3390/w9080623
de Queiroz, A. R., Lima, L. M. M., Lima, J. W. M., da Silva, B. C., and Scianni, L. A. (2016). Climate change impacts in the energy supply of the Brazilian hydro-dominant power system. Renew. Energy 99, 379–389. doi:10.1016/j.renene.2016.07.022
Ding, Q., Chang, L., and Tu, M. (2018). Key technologies of technical support system for electricity spot market. Automation Electr. Power Syst. 42 (23), 7–14. doi:10.7500/AEPS20180509006
Douglas Foster, F., Lee, A. D., and Liu, W.-M. (2019). CFDs, forwards, futures and the cost-of-carry. Pacific-Basin Finance J. 54, 183–198. doi:10.1016/j.pacfin.2018.05.004
Exizidis, L., Kazempour, J., Papakonstantinou, A., Pinson, P., De Greve, Z., and Vallee, F. (2019). Incentive-compatibility in a two-stage stochastic electricity market with high wind power penetration. IEEE Trans. Power Syst. 34 (4), 2846–2858. doi:10.1109/tpwrs.2019.2901249
Helseth, A., Fodstad, M., Askeland, M., Mo, B., Nilsen, O. B., Pérez-Díaz, J. I., et al. (2017). Assessing hydropower operational profitability considering energy and reserve markets. IET Renew. Power Gener. 11 (13), 1640–1647. doi:10.1049/iet-rpg.2017.0407
Huang, J., Lin, C., Zhou, H., Xu, Z., and Lin, C. (2019). Research on key technologies of deduction of multinational power trading in the context of Global Energy Interconnection. Glob. Energy Interconnect. 2 (6), 560–566. doi:10.1016/j.gloei.2020.01.010
Ivar Skjelbred, H., and Kong, J. (2018). “Operational hydropower simulation in cascaded river systems for intraday Re-planning,” in 2018 power systems computation conference (PSCC), Dublin, Ireland, 11-15 June 2018, 1–7.
Khorasany, M., Mishra, Y., and Ledwich, G. (2020). A decentralized bilateral energy trading system for peer-to-peer electricity markets. IEEE Trans. Ind. Electron. 67 (6), 4646–4657. doi:10.1109/tie.2019.2931229
Lei, N., Chen, L., Sun, C., and Tao, Y. (2018). Electricity market creation in China: policy options from political economics perspective. Sustainability 10 (5), 1481. doi:10.3390/su10051481
Li, X. Z., Chen, Z. J., Fan, X. C., and Cheng, Z. J. (2018). Hydropower development situation and prospects in China. Renew. Sustain. Energy Rev. 82, 232–239. doi:10.1016/j.rser.2017.08.090
Li, Y., Zhao, T., Liu, C., Zhao, Y., Yu, Z., Li, K., et al. (2019). Day-ahead coordinated scheduling of hydro and wind power generation system considering uncertainties. IEEE Trans. Ind. Appl. 55 (3), 2368–2377. doi:10.1109/tia.2019.2893836
Liu, S., Bie, Z., Lin, J., and Wang, X. (2018). Curtailment of renewable energy in Northwest China and market-based solutions. Energy Policy 123, 494–502. doi:10.1016/j.enpol.2018.09.007
Liu, Y., Ma, G. W., Huang, W. B., Chen, S. J., and Zhang, S. (2020). Analyses of market alliance stability of hydropower stations. Proc. Institution Civ. Eng. - Water Manag. 173 (1), 31–45. doi:10.1680/jwama.18.00052
Loschenbrand, M., and Korpas, M. (2019). Multiple nash equilibria in electricity markets with price-making hydrothermal producers. IEEE Trans. Power Syst. 34 (1), 422–431. doi:10.1109/tpwrs.2018.2858574
Lu, J., Li, G., Cheng, C. T., and Liu, B. X. (2021). A long-term intelligent operation and management model of cascade hydropower stations based on chance constrained programming under multi-market coupling. Environ. Res. Lett. 16 (5), 055034. doi:10.1088/1748-9326/abef90
Lu, J., Li, G., Cheng, C., and Yu, H. (2020). Risk analysis method of cascade plants operation in medium term based on multi-scale market and settlement rules. IEEE Access 8, 90730–90740. doi:10.1109/access.2020.2994093
Luo, S., Hu, W., Liu, W., Xu, X., Huang, Q., Chen, Z., et al. (2021). Transition pathways towards a deep decarbonization energy system—a case study in sichuan, China. Appl. Energy 302, 117507. doi:10.1016/j.apenergy.2021.117507
Niu, W.-J., Feng, Z.-K., Cheng, C.-T., and Wu, X.-Y. (2018). A parallel multi-objective particle swarm optimization for cascade hydropower reservoir operation in southwest China. Appl. Soft Comput. 70, 562–575. doi:10.1016/j.asoc.2018.06.011
Nunna, H. S. V. S. K., Sesetti, A., Rathore, A. K., and Doolla, S. (2020). Multiagent-based energy trading platform for energy storage systems in distribution systems with interconnected microgrids. IEEE Trans. Ind. Appl. 56 (3), 3207–3217. doi:10.1109/tia.2020.2979782
Pereira, A. C., de Oliveira, A. Q., Baptista, E. C., Balbo, A. R., Soler, E. M., and Nepomuceno, L. (2017). Network-constrained multiperiod auction for pool-based electricity markets of hydrothermal systems. IEEE Trans. Power Syst. 32 (6), 4501–4514. doi:10.1109/tpwrs.2017.2685245
Rasmussen, C., Hansen, J. B. Ø., Korpås, M., and Fodstad, M. (2016). Profitability of a hydro power producer bidding in multiple power markets. Energy Procedia 87, 141–148. doi:10.1016/j.egypro.2015.12.344
Ringler, P., Keles, D., and Fichtner, W. (2016). Agent-based modelling and simulation of smart electricity grids and markets – a literature review. Renew. Sustain. Energy Rev. 57, 205–215. doi:10.1016/j.rser.2015.12.169
Saini, G., and Saini, R. P. (2019). A review on technology, configurations, and performance of cross-flow hydrokinetic turbines. Int. J. Energy Res. 43 (13), 6639–6679. doi:10.1002/er.4625
Seljom, P., and Tomasgard, A. (2017). The impact of policy actions and future energy prices on the cost-optimal development of the energy system in Norway and Sweden. Energy Policy 106, 85–102. doi:10.1016/j.enpol.2017.03.011
Shafiekhani, M., and Badri, A. (2019). A risk-based gaming framework for VPP bidding strategy in a joint energy and regulation market. Iran. J. Sci. Technol. Trans. Electr. Eng. 43 (3), 545–558. doi:10.1007/s40998-019-00179-6
Sioshansi, R. (2015). Optimized offers for cascaded hydroelectric generators in a market with centralized dispatch. IEEE Trans. Power Syst. 30 (2), 773–783. doi:10.1109/tpwrs.2014.2332501
Su, C., Yuan, W., Cheng, C., Wang, P., Sun, L., and Zhang, T. (2020). Short-term generation scheduling of cascade hydropower plants with strong hydraulic coupling and head-dependent prohibited operating zones. J. Hydrol. 591, 125556. doi:10.1016/j.jhydrol.2020.125556
Tian, C., Huang, G., and Xie, Y. (2021). Systematic evaluation for hydropower exploitation rationality in hydro-dominant area: a case study of sichuan province, China. Renew. Energy 168, 1096–1111. doi:10.1016/j.renene.2020.12.121
Wang, F., Ge, X., Li, K., and Mi, Z. (2019). Day-ahead market optimal bidding strategy and quantitative compensation mechanism design for load aggregator engaging demand response. IEEE Trans. Ind. Appl. 55 (6), 5564–5573. doi:10.1109/tia.2019.2936183
Wang, J., Chen, S., Ma, G., Huang, W., and Liu, Y. (2018). Competitiveness of hydropower price and preferential policies for hydropower development in Tibet and the Sichuan-Yunnan Tibetan area of China. Water Policy 20 (6), 1092–1111. doi:10.2166/wp.2018.122
Wang, X., Yang, K., and Zhou, X. (2018). Two-stage glowworm swarm optimisation for economical operation of hydropower station. IET Renew. Power Gener. 12 (9), 992–1003. doi:10.1049/iet-rpg.2017.0466
Wang, Y., Shi, R., Zhang, C., He, Y., Jiang, H., and Kubota, J. (2022). Structural changes and trends in China’s renewable electricity production in the policy evolution process. Renew. Energy 182, 879–886. doi:10.1016/j.renene.2021.10.052
Xu, Z., Hu, Z., Song, Y., and Wang, J. (2017). Risk-averse optimal bidding strategy for demand-side resource aggregators in day-ahead electricity markets under uncertainty. IEEE Trans. Smart Grid 8 (1), 96–105. doi:10.1109/tsg.2015.2477101
Ye, H., Ge, Y., Shahidehpour, M., and Li, Z. (2017). Uncertainty marginal price, transmission reserve, and day-ahead market clearing with robust unit commitment. IEEE Trans. Power Syst. 32 (3), 1782–1795. doi:10.1109/tpwrs.2016.2595621
Ye, Y., Hu, Y., Ma, G., Huang, W., Chen, S., and Li, B. (2020). Pricing of grid electricity of reservoir power plants based on quantification of the values of positive externality factors. Water Policy 22 (3), 376–395. doi:10.2166/wp.2020.133
Ye, Y., Huang, W., Ma, G., Wang, J., Liu, Y., and Hu, Y. (2018). Cause analysis and policy options for the surplus hydropower in southwest China based on quantification. J. Renew. Sustain. Energy 10 (1), 015908. doi:10.1063/1.5024256
Yu, X., Li, G., Cheng, C., Sun, Y., and Chen, R. (2019). Research and application of continuous bidirectional trading mechanism in yunnan electricity market. Energies 12 (24), 4663. doi:10.3390/en12244663
Zakeri, B., Virasjoki, V., Syri, S., Connolly, D., Mathiesen, B. V., and Welsch, M. (2016). Impact of Germany’s energy transition on the Nordic power market – a market-based multi-region energy system model. Energy 115, 1640–1662. doi:10.1016/j.energy.2016.07.083
Zhang, D., Wang, J., Lin, Y., Si, Y., Huang, C., Yang, J., et al. (2017). Present situation and future prospect of renewable energy in China. Renew. Sustain. Energy Rev. 76, 865–871. doi:10.1016/j.rser.2017.03.023
Zhang, S., Andrews-Speed, P., and Li, S. (2018). To what extent will China’s ongoing electricity market reforms assist the integration of renewable energy? Energy Policy 114, 165–172. doi:10.1016/j.enpol.2017.12.002
Zhang, Z., Tang, H., Ren, J., Huang, Q., and Lee, W.-J. (2021). Strategic prosumers-based peer-to-peer energy market design for community microgrids. IEEE Trans. Ind. Appl. 57 (3), 2048–2057. doi:10.1109/tia.2021.3064523
Zhang, S., Chen, S., Ma, G., Zhu, Y., and Tao, C. (2021). Curve tracking and comparison during electricity spot trading based on judgment methods for curve similarity. J. Phys. Conf. Ser. 2005 (1), 012028. doi:10.1088/1742-6596/2005/1/012028
Zhou, N., Wu, D., Duan, P., Chen, L., Li, W., and Yang, Y. (2020). “Research and application of related settlement method considering price stabilization in yunnan power market,” in 2020 IEEE sustainable power and energy conference (iSPEC), Chengdu, China, 23-25 November 2020, 1153–1158.
Zhu, Y., Huang, W., Chen, S., Zhang, S., Lai, C., and Ma, G. (2021). Spot quotation alliance modeling method of cascade hydropower based on symbiosis theory. J. Hydrol. 602, 126753. doi:10.1016/j.jhydrol.2021.126753
Nomenclature
Keywords: electricity spot market, cascade hydropower stations, hydraulic power matching, multi-objective optimization, risk and economic evaluation
Citation: Zhang S, Ma G-W, Huang W-B, Tao C-H, Yang B-Q and Xue Y-L (2022) Simulation of hydraulic power matching–based risk and economic evaluation among cascade hydropower stations in spot transactions. Front. Energy Res. 10:959150. doi: 10.3389/fenrg.2022.959150
Received: 01 June 2022; Accepted: 01 August 2022;
Published: 01 September 2022.
Edited by:
Nallapaneni Manoj Kumar, City University of Hong Kong, Hong Kong SAR, ChinaReviewed by:
Gaurav Saini, Indian Institute of Engineering Science and Technology, Shibpur, IndiaAneesh A. Chand, University of the South Pacific, Fiji
Ali Thaeer Hammid, Imam Sadiq University, Iran
Copyright © 2022 Zhang, Ma, Huang, Tao, Yang and Xue. This is an open-access article distributed under the terms of the Creative Commons Attribution License (CC BY). The use, distribution or reproduction in other forums is permitted, provided the original author(s) and the copyright owner(s) are credited and that the original publication in this journal is cited, in accordance with accepted academic practice. No use, distribution or reproduction is permitted which does not comply with these terms.
*Correspondence: Wei-Bin Huang, xhuang2002@163.com