 Seongmun Oh
 Jaesung Jung
 Ahmet Onen
 Chul-Ho Lee
95% of researchers rate our articles as excellent or good
Learn more about the work of our research integrity team to safeguard the quality of each article we publish.
Find out more
ORIGINAL RESEARCH article
Front. Energy Res. , 15 September 2022
Sec. Smart Grids
Volume 10 - 2022 | https://doi.org/10.3389/fenrg.2022.957466
This article is part of the Research Topic Market-Based Distributed Energy Resources Operation for Future Power Systems View all 5 articles
The demand response (DR) program is a promising way to increase the ability to balance both supply and demand, optimizing the economic efficiency of the overall system. This study focuses on the DR participation strategy in terms of aggregators who offer appropriate DR programs to customers with flexible loads. DR aggregators engage in the electricity market according to customer behavior and must make decisions that increase the profits of both DR aggregators and customers. Customers use the DR program model, which sends its demand reduction capabilities to a DR aggregator that bids aggregate demand reduction to the electricity market. DR aggregators not only determine the optimal rate of incentives to present to the customers but can also serve customers and formulate an optimal energy storage system (ESS) operation to reduce their demands. This study formalized the problem as a Markov decision process (MDP) and used the reinforcement learning (RL) framework. In the RL framework, the DR aggregator and each customer are allocated to each agent, and the agents interact with the environment and are trained to make an optimal decision. The proposed method was validated using actual industrial and commercial customer demand profiles and market price profiles in South Korea. Simulation results demonstrated that the proposed method could optimize decisions from the perspective of the DR aggregator.
The demand response (DR) program can increase the ability to balance both supply and demand, improving the economic efficiency of the overall system (Kang et al., 2018). The utilization of DR programs can reduce operating costs by reducing additional investments to fulfill high-peak-load situations. DR programs can be classified into two categories: time-based and incentive-based DR programs. Time-based DR programs can change the demand patterns by responding to time-varying electricity prices. Incentive-based DR dispatches a signal to involved customers to reduce their electric usage and provides incentives or penalties from the system operator based on these criteria. Time-based DR fundamentally benefits customers rather than the system operator; however, an incentive-based DR program dispatches a signal to reduce the demand for system operators to manage their demand source more flexibly. Despite the advantages of DR, participating in a DR program renders it difficult for typical customers to access the electricity market because it involves a complex process. Therefore, DR aggregators have emerged in the electricity market. DR aggregators are new entities and counterparties to the electricity market that serve as intermediaries between market operators and customers in DR programs (Abapour et al., 2020; Lu et al., 2020). Therefore, the DR aggregator provides registered customers with an easy access point to the electricity market and can manage their customers’ demand resources; examples include energy storage systems (ESSs).
ESSs are often used to participate effectively in DR programs on the demand side. An ESS can not only respond quickly to system changes but also store and supply its stored energy at a required time (Manz et al., 2012). These abilities of ESS render it an ideal candidate for a wide range of power system applications, such as energy arbitrage, peak shaving, frequency regulation, and renewable integration (Makarov et al., 2012; Gayme and Topcu, 2013; Pandžić et al., 2015; Vargas et al., 2015; Lee et al., 2018). Ref (Pandžić et al., 2015) presented an optimal method for siting and sizing of ESS for energy arbitrage, frequency regulation, and so on. In (Gayme and Topcu, 2013), ESS is used to maintain consistent power of renewable energy sources. The authors included the charge/discharge operations of ESS in power flow formulations and solved the formulations. Makarov at al (Makarov et al., 2012) presented a sizing method of grid-scale ESS to mitigate the variability of renewable energy. ESS was used to handle the over-generation or under generation periods. Congestion management method using ESS was proposed in (Vargas et al., 2015). Lee at al (Lee et al., 2018) proposed a strategy to participate DR program. The authors used the ESS and developed an optimal scheduling algorithm. Existing research provides insight into the attractive benefits of using ESS. Among them, participation in the DR market is attracting attention because of its benefits to obtain economics, system reliability and optimized load profile (Eyer and Corey, 2010).
Several studies have used reinforcement learning (RL), with significant interest in machine learning, to develop DR strategies that maximize profits. Zamzam et al. (2019) discussed a control method for energy systems comprising an ESS, a renewable energy source, and a load using a deep Q-learning algorithm. Xu et al. (2019) presented a method for obtaining the maximum profit of arbitrage in the real-time electricity market using an ESS. Guan et al. (2015) used a TD-learning algorithm to determine the optimal control policy to minimize the residential customer bill using an ESS. Yu et al. (2020) studied a joint arbitrage of electricity and carbon prices using double Q-learning-based ESS arbitrage. Similarly, a Q-learning-based arbitrage strategy was presented in (Han et al., 2021). The authors utilized an electricity price and customer demand forecasting model to consider their uncertainty. In (Bahrami et al., 2020), the authors proposed the RL-based load control method during peak time periods. Actor-critic algorithm was used to curtail customer’s electrical load while considering the distribution network constraints. Wang et al. (2020) presented RL-based DR management on customer side. The authors formulated a Markov decision process (MDP) to solve RL problem and aimed to reduce the peak load demand and operation costs. Recently, RL-based aggregator operation strategies were presented in (Ghosh et al., 2019; Chuang and Chiu, 2022). Ref (Ghosh et al., 2019) presented a RL-based aggregator decision making method. The RL-based aggregator designed customer’s retail tariff structure by purchasing or selling power in the wholesale market. This aggregator plays like a distribution system operator in local distribution system. In (Chuang and Chiu, 2022), RL-based pricing strategy of aggregators was proposed. In this study, the aggregator plays as an energy trading platform so that energy producer and consumer subscribe to aggregator, and share their energy based on the aggregator pricing strategy.
Most of previous studies have been used RL methods to maximize DR profit, and they considered only the demand-side problem. Although a few aggregator-side studies have been conducted, these studies assumed that the customers could make optimal decisions and directly communicate the whole sale market for DR. Nevertheless, it is difficult not only to make optimal decisions, but also to communicate directly with the whole market for most customers. It may be restricted customers’ participation in the DR program. In fact, customers can effectively participate in the DR program by subscribing to the DR aggregator and pay a certain fee to delegate decision making and communication with the whole market. Therefore, this study presents the aggregator side DR management to reduce the above drawback, contributing the follows:
1) This paper proposes a method for developing a DR strategy from the perspective of a DR aggregator with RL techniques, considering both DR aggregator and customers benefits.
2) Different with conventional DR scheduling methods, this study utilizes a RL based decision making process to obtain the optimal DR strategy. RL is a model free and data-driven method, enabling automatically determines their optimal decisions from the data without prior knowledge for the environment.
3) This study takes into account the DR program model, which sends its demand reduction capabilities to a DR aggregator that bids aggregate demand reduction to the electricity market. In this model, the DR aggregators not only determine the optimal rate of incentives to provide to customers but also makes decisions for customers to ensure optimal ESS operation to reduce demand.
4) Compared to the case of not participating in the DR aggregator, more practical benefits can be confirmed. The reward function in RL is designed in consideration of the benefits for electricity and the whole sale market price, indicating the proposed method can help not only the DR aggregator to procure demand resources but it also shows that it can help reduce costs for customers.
The remainder of this paper is organized as follows. Section 2 provides the fundamental background of this study. Section 3 formulates the RL problem, Section 4 describes Deep Q learning method, Section 5 presents a numerical simulation, and Section 6 concludes the paper.
The fundamental role of the DR aggregator is to communicate between the electricity market and customers. The DR aggregator provides DR services for the market operator, and obtains a settlement based on the electricity market prices. However, the DR aggregator provides an incentive for customers to procure energy resources. The DR aggregator is usually a for-profit organization, so the aggregator aims to maximize its profit and minimize the incentive rate that settles on customers. Therefore, the objective of the DR aggregator is as follows:
where N represents the total number of customers; H is 24 h, which is the last hour of the day;
Customers are registered in the DR aggregator to participate in the DR program. The DR aggregator is an easier access point for customers to obtain information regarding the electricity market. In particular, customers obtain incentive prices from the DR aggregator, and they try to maximize their profits by reducing electricity demand. Customers control their controllable loads, such as heating, ventilation, and air conditioning (HVAC), lighting, and energy storage systems (ESS).
In this study, we assume that the customer participates in the DR program using an ESS, which enables the storage and supply of electrical energy at the required time. An ESS can flexibly control demand and does not induce discomfort while controlling customer demands. Based on the ESS, the customer can purchase power to charge energy to the ESS and discharge the stored energy to the grid in DR situations. The operational energy from the ESS at each time point is denoted
where
where
Through the ESS model above, customers participate in the DR program and aim to maximize the profit received from the DR aggregator. Therefore, the objectives of the customers can be represented as follows:
where
Figure 1 shows the overall DR program model. As mentioned previously, the DR aggregator communicates with both the wholesale electricity market and customers. In this model, customers send their reduction to DR aggregator and the DR aggregator, which bids the aggregated reduction to the wholesale electricity market, receiving the wholesale settlement based on the wholesale electricity market price. The wholesale settlement is distributed to customers according to the incentive price determined by the DR aggregator. However, the decision to reduce the number of customers can be made by itself or by the DR aggregator. However, not all customers can make optimal decisions to participate in the DR program; therefore, this study assumes that the DR aggregator can assist customer decision-making. Therefore, customers can also send their controllable device specification (ESS in this case), and the DR aggregator can decide to maximize both the wholesale settlement and the customer’s incentive settlement.
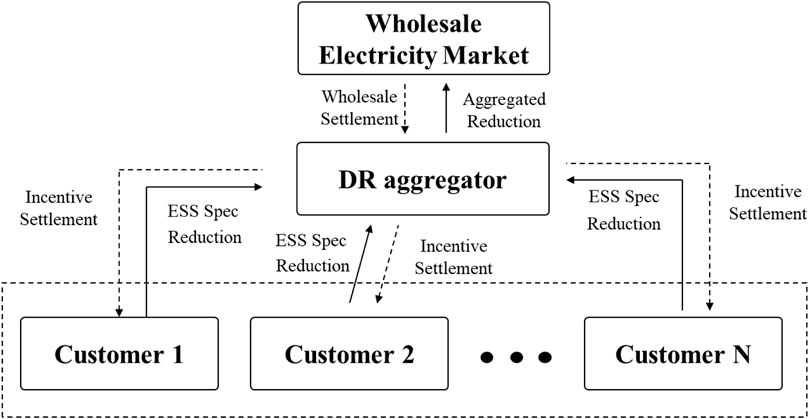
FIGURE 1. DR Program model.
RL is a domain of machine learning concerned with how agents make a sequence of decisions in a complex environment to maximize profit. Figure 2 shows the architecture of RL. The agent interacts with the environment to find an optimal policy by trial and error, without explicitly modeling the system dynamics. In the interacting process, the agent modifies its action strategy to obtain the maximum return in the long run.
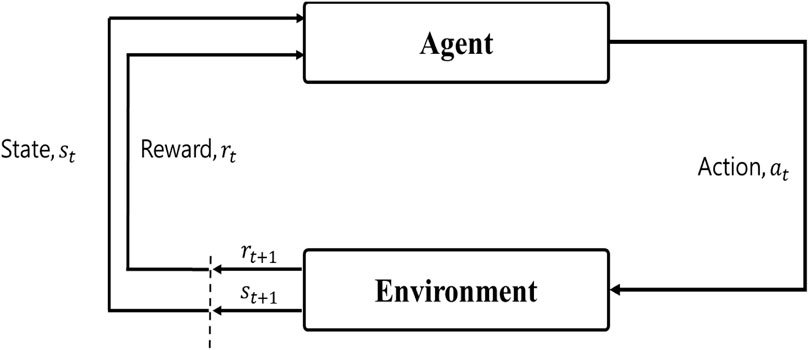
FIGURE 2. Architecture of RL.
In this study, the operational objective of the DR aggregator is to maximize both the wholesale settlement and customer incentive settlement. Although we designed the objective function for the DR aggregator and customers, the functions cannot be directly used in the RL framework. To use the objective function in the RL framework, we must formulate the objective function as a MDP framework, including state, action, and reward for the DR aggregator and customers. In other words, the agent is provided with its surrounding environment state
where
The reward functions implicitly represent the DR profits of the DR aggregator and customers. In the reward functions, the DR aggregator simply determines the ratio of incentives to make profits, whereas customers consider the appropriate ESS operation. More specifically, the ESS should be charged when the electricity prices are low or discharged when the electricity prices are high to provide operational benefits. For this purpose,
With the above formulations, the RL agents receive the reward with a discount factor and the sum of all discounted rewards, which is called the return. The return can be used as a measure of how good the policy is, so the optimal policy is the policy that maximizes the return.
The deep Q-network (DQN) uses a neural network and overcomes the shortcomings of conventional RL algorithms. For example, DQN has been shown to be successful in playing Atari and Go games, and it is a powerful method for solving complex control problems (Mnih et al., 2013). Q-learning implemented with a DQN is called a deep (DQL). When selecting the actions, DQL considers the value of the actions. This value is called a Q-value, which is defined as the expected return of action in the state. It measures how good the action is in the given state for a specific action for a specific policy
Moreover, we aim to obtain the maximum expected return, which can be represented using the optimal action-value function. The optimal action value can be calculated recursively using the Bellman equation as follows: In DQN, the action-value function
where DQL has two networks, Q-network
In this study, we applied the Bellman equation to update the action-value function during the RL training process. This update eventually converges to the optimal action-value function. Furthermore, experience replay techniques have been used to store past experiences in replay memory. A mini-batch randomly drawn from the replay memory was chosen to perform gradient updates in the neural network at each update. Moreover, the DQL agent explores the environment under
DQL has received considerable attention and has shown successful performance in many fundamental control problems. However, in our problem, a single DQL struggled to explore the environment and obtain rewards. In our environment, the DR aggregator and customers have different states and action spaces. This makes it difficult for the agent to explore its actions for the DR aggregator and the customer. Therefore, multiple DQL agents have been used to create more appropriate interactions with the environment.
A two-stage procedure is used, consisting of an aggregator agent and two customer agents. The aggregator agent receives the state
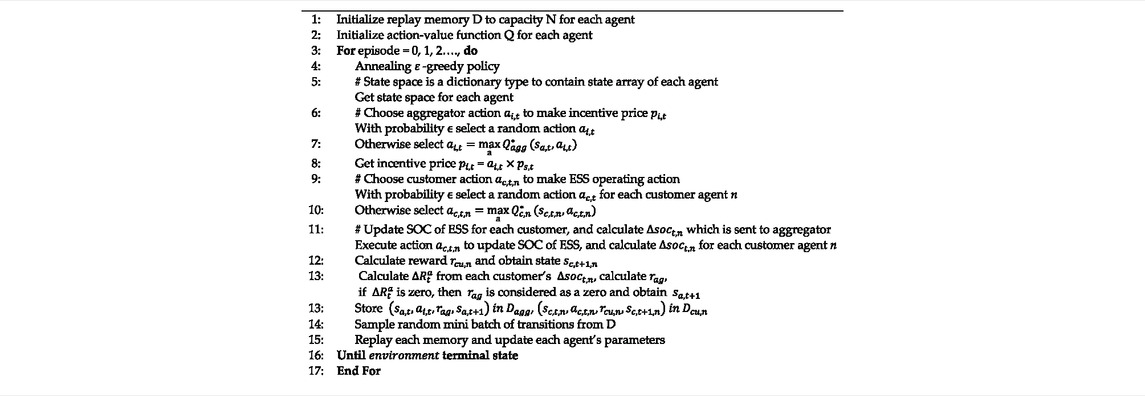
TABLE 1. Training algorithm.
The real industrial and commercial demand for 1-year datasets were collected for the simulation. The demand profiles were sampled with a 1-hour frequency. Figures 3, 4 show the monthly average demand profiles for the target customers. The industrial customer profile shows an M-shaped pattern. This shape is representative of the demand profile of the customers in the manufacturing industry. The commercial customer profile, on the other hand, shows a relatively stable pattern, except for an increase in working hours (9 am–6 pm). This shape represents a typical demand profile for office customers.
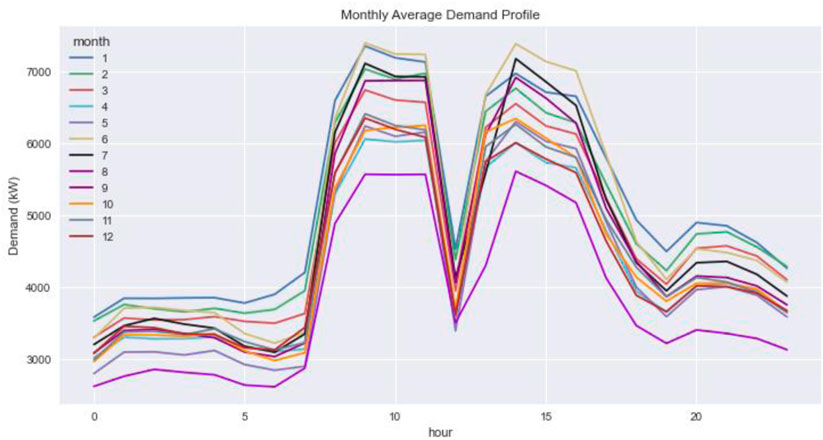
FIGURE 3. Monthly average industrial demand profile.
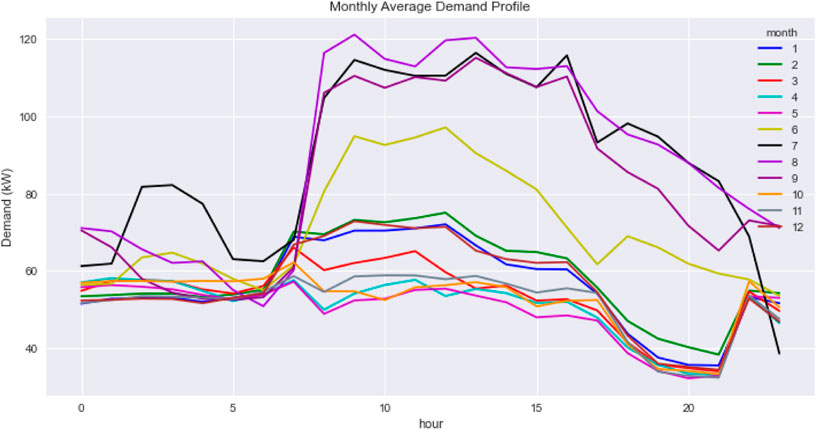
FIGURE 4. Monthly average commercial demand profile.
The same period as the demand profile of the wholesale market price dataset is used for the simulation (EPSIS, 2022). This profile was also sampled with a 1-hour frequency. Figure 5 shows the monthly average market price profiles. This profile shows a generally stable pattern, with relatively high price points in January-March and June-August, correlating to when heating and cooling demand may increase.
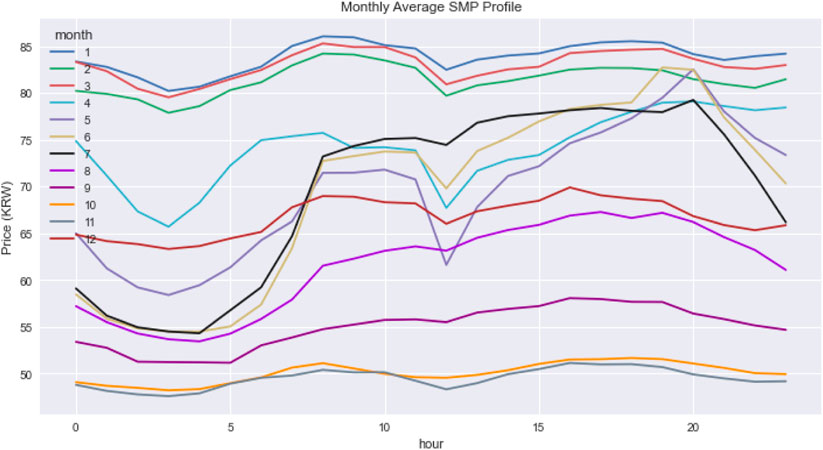
FIGURE 5. Monthly average market price profile.
Industrial and commercial customers in South Korea follow the electricity tariff system (Korean Electricity Bill, 2022). The industrial customer pays electricity bills based on the industrial load (B), high voltage (B), and option II rate plan. Commercial customers pay electricity bills based on commercial load (A) II, high voltage (A), and option I rate plan, as shown in Table 2. Table 3 shows the time of use (TOU) electric rate schedule for season and time. In Table 2, non-bracket values represent the industrial rate plan and bracket values represent the commercial rate plan.
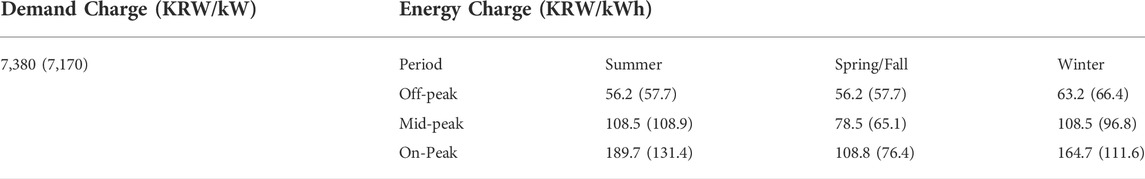
TABLE 2. Electricity rate plan
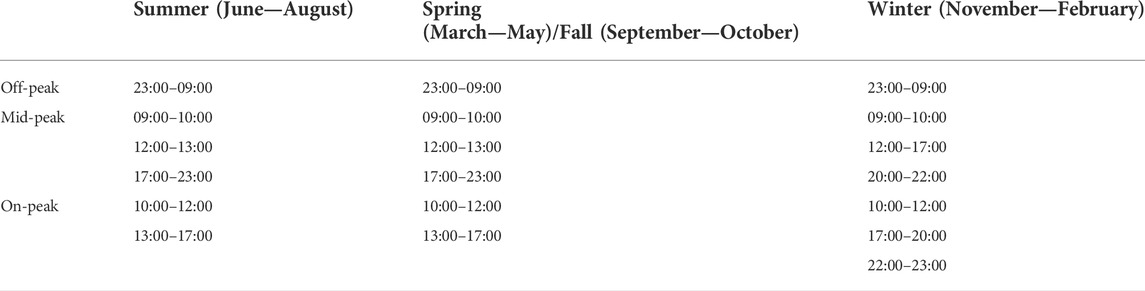
TABLE 3. Electricity rate schedule
The installed ESS is connected to both the demand side and power grid. A 500 kWh and 20 kWh lithium-ion battery connected to an ESS with a power conversion system (PCS) was used to simulate the proposed method. A total of 500 kWh is used on the industrial side, and 20 kWh is used on the commercial side. The batteries were considered to operate at an operate 1.0C-rate in the experiment. The charge/discharge amount was defined as that operating within the maximum rate of the ESS. The battery is assumed to operate between the lower SOC bound (0%) and upper bound (100%) of the rated capacity, and the efficiency of the ESS charging, and discharging is assumed to be 95%. Table 4 summarizes the ESS specifications for the target customers, and this information is provided to the DR aggregator.
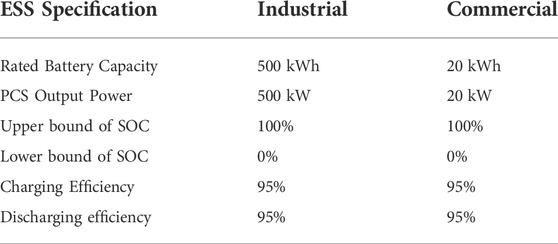
TABLE 4. Summary of ESS specification
Multiple DQL agents have been developed to make decisions for both the DR aggregator and customers. Figure 6 shows the hyperparameters and structure of agents used to model RL agents. In the simulation, we used the same parameters for each agent; however, the parameters could be tuned for better results. Each agent was trained for 500 iterations. For ε-greedy, the agents used the linear annealing method with ε-decay value, 3e-3, and minimum ε is set as 1e-2.
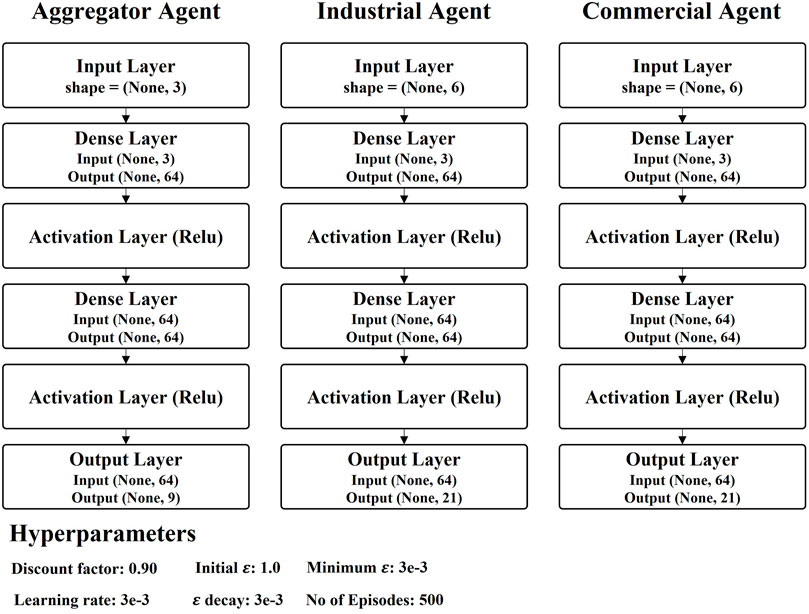
FIGURE 6. DQL agent structure and hyperparameters.
Furthermore, we compare the proposed method with the conventional DR strategy (Kang et al., 2018; Lee et al., 2018). The conventional DR strategy designed to maintain its self-consumption at a minimum so that the ESS can participate in the DR program as much as possible on the demand side. For aggregator side, we utilized conventional ZI (zero intelligence) strategy (Friedman, 2018). ZI strategy set its incentive price as a random value from its valuation, based on a uniform distribution from a specified range. ZI is a fundamental and popular strategy adopted in market environment. By combining these two strategies, conventional algorithm can response to both DR aggregator and customers. Thus, this conventional algorithm can be used as a baseline model to demonstrate the superiority of the RL algorithm.
Figure 7 shows the expected returns for each episode. The shaded area represents the reward per episode, and the solid line represents the 5-rolling average. Total rewards per episode represent the sum of all agents, while others represent the cumulative rewards of individual agents. Base in parentheses indicates the baseline model. In the figure, the reward received by the DQL agent gradually increased according to the episode, and the accumulated reward after 300 episodes stably converged. The figure shows that the proposed method has a higher expected return than the baseline. This implicates that agent can properly learn about the DR aggregator and customer decisions.
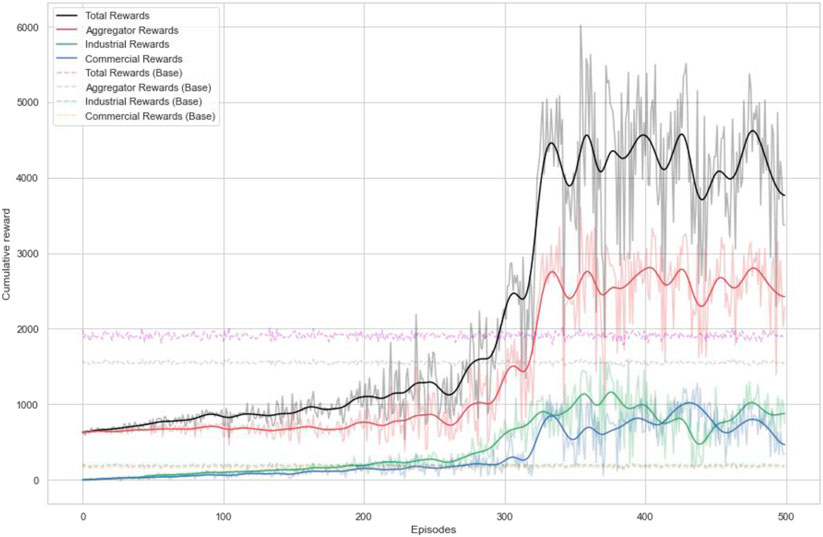
FIGURE 7. Performance of RL agents.
Figures 8, 9 show the results of the actions of trained agents. The customer demand and electricity prices were normalized to show the graph in similar scale. In these figures, the incentive price is determined by the DR aggregator agent. Figure 10 shows the probability distribution of the prices. In this figure, Incentive prices, unlike market prices, have a skewed distribution pattern to the right. This is because the incentive price is determined based on the DR aggregator action space, and the incentive price is distributed with a minimum value of 0.3 × market price and a maximum value of 0.8 × market price. Incentive distribution is more distributed at lower price points. This is because the agent’s action tends to set incentives low for their own benefit. The ESS operation can be determined by the customer agent provided by the DR aggregator. In the reward function
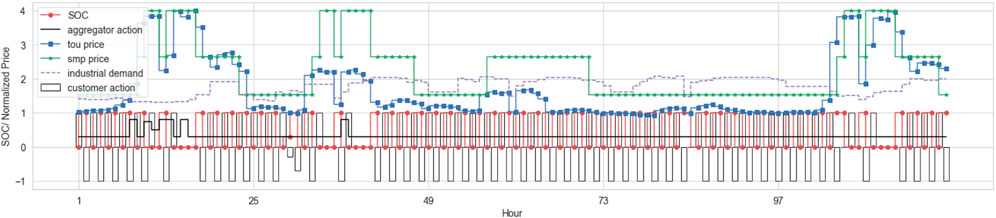
FIGURE 8. Industrial Customer operation profile.
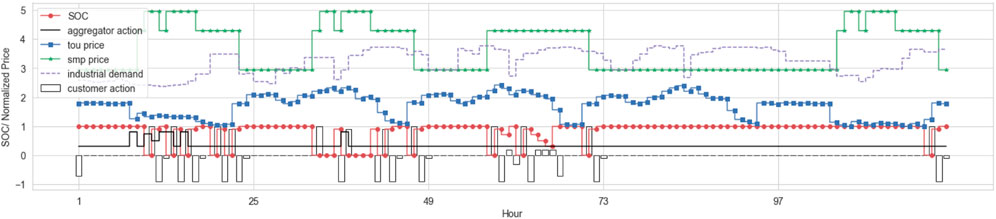
FIGURE 9. Commercial customer operation profile.
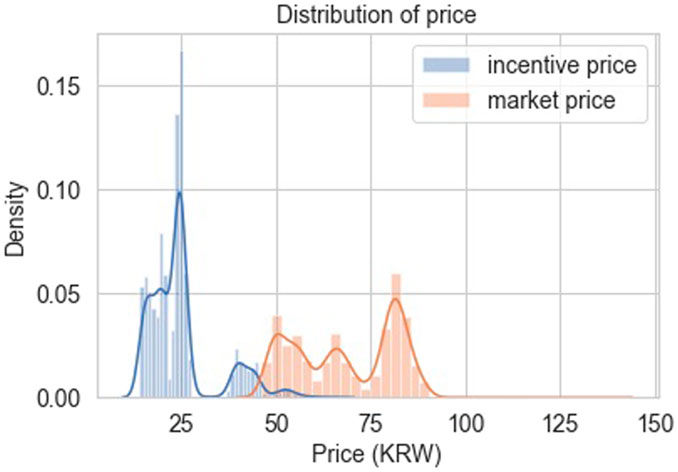
FIGURE 10. Probability distribution of the prices.
Furthermore, we analyzed the effect of the economic benefits and action results that can be achieved when participating in the DR program. Table 5 shows the overall DR benefits. A total profit of aggregator was obtained 61,550,864 KRW through the DR program during the simulation period. Industrial customers earned 46,083,785 KRW of DR profit and saved 17,459,190 KRW in electricity bills. In the case of commercial customers, 2,412,555 KRW of DR profit was obtained, and 1,342,46 KRW of the electricity bill was saved. Base in parentheses indicates the baseline model. The proposed method outperforms baseline in terms of economic evaluation overall.
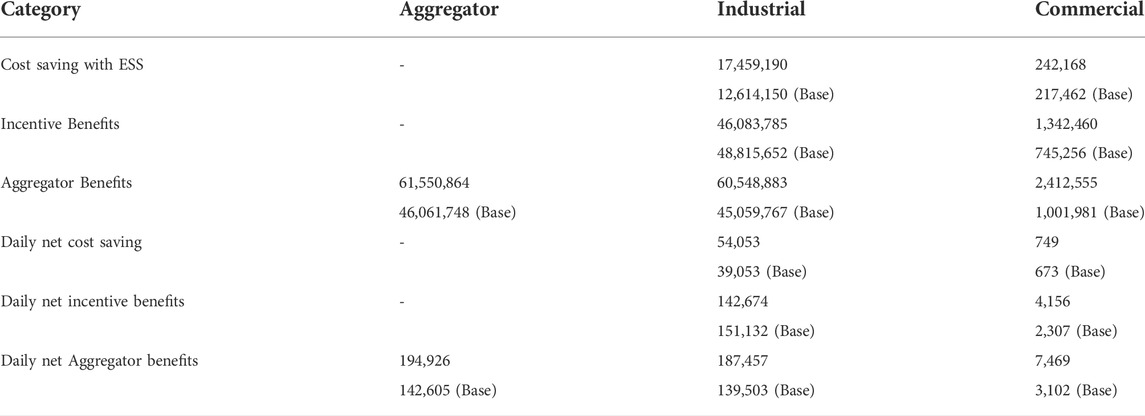
TABLE 5. Overall DR benefits (in KRW).
Figure 11 shows the distribution of DR benefits for each agent. The benefits of the DR aggregator account for the largest portion, followed by that of industrial customers. Commercial customers are the least profitable, as they have less capacity to participate in DR programs. Aggregators seem to generate tremendous profits because they want to offer as few incentives as possible to increase profits. Notably, the energy bill savings of customers are relatively small, and the DR benefits are large. As the main purpose of the agent is to maximize profits through DR participation, the agent is viewed as making an appropriate decision.
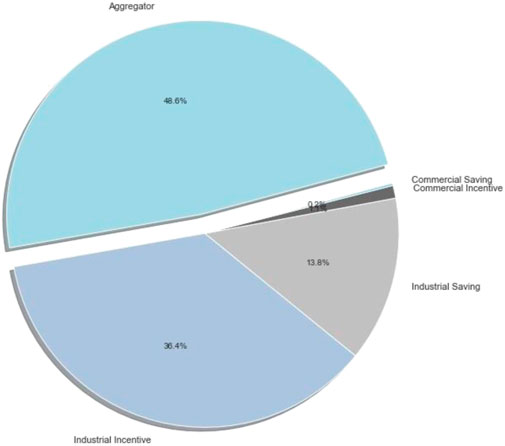
FIGURE 11. The distribution of the DR benefits for each agent.
Overall, the simulation results show that the proposed method makes optimal decisions for the DR programs. Hence, the proposed method can be utilized to operate DR programs from the perspective of DR aggregators. Even if the aggregator supports the customer’s decision-making as in this paper, sufficient profits can be obtained. This is expected to motivate customers to engage with the aggregator and attract more customers.
This study presents a method for developing a DR strategy from the perspective of a DR aggregator. Customers use the DR program model, which sends its demand reduction capabilities to a DR aggregator that bids aggregate demand reduction to the electricity market. DR aggregators not only determine the optimal rate of incentives to provide to customers but can also induce the customers to make an optimal ESS operation to reduce their demands. This study formalized the problem as an MDP and used the RL framework. In the RL framework, the DR aggregator and each customer are allocated to each agent, and the agents interact with the environment and are trained to make the optimal decision.
The simulation results show that A total profit of aggregator was obtained 61,550,864 KRW through the DR program during the simulation period. Industrial customers earned 46,083,785 KRW of DR profit and saved 17,459,190 KRW in electricity bills. In the case of commercial customers, 2,412,555 KRW of DR profit was obtained, and 1,342,46 KRW of the electricity bill was saved. In addition, the distribution of DR profit is 48.6% for the DR aggregator and 51.4% for customers, showing a suitable profit-sharing structure. Overall, the simulation results show that the proposed method makes optimal decisions for the DR programs. Therefore, the proposed method can be utilized to operate DR programs from the perspective of DR aggregators.
In the future, we will develop a demand and market price forecasting model. Current state information includes customer demand and market prices. In a real system, the market price and customer demand are unknown values at the time the agent makes a decision. To address this uncertainty, an accurate forecasting model should be developed in future studies. Furthermore, we plan to develop a bidding strategy for the DR programs. In this study, the probability of winning a bid was assumed to be 100%, which does not equal the actual winning rate. Therefore, there is a need for developing a detailed bidding strategy for DR.
The original contributions presented in the study are included in the article, further inquiries can be directed to the corresponding author.
SO; Conceptualization; Data curation; Formal analysis; Investigation; Methodology; Resources; Software; Validation; Visualization; Roles/Writing—original draft. JJ; Conceptualization; Funding acquisition; Project administration; Validation; Writing—review and editing. AO and CL: Formal analysis; Investigation; Validation. All authors have read and agreed to the published version of the manuscript.
This research was supported by Energy AI Convergence Research & Development Program through the National IT Industry Promotion Agency of Korea (NIPA) funded by the Ministry of Science and ICT (No. 1711151479). This work was supported by the Ajou University research fund.
The authors declare that the research was conducted in the absence of any commercial or financial relationships that could be construed as a potential conflict of interest.
All claims expressed in this article are solely those of the authors and do not necessarily represent those of their affiliated organizations, or those of the publisher, the editors and the reviewers. Any product that may be evaluated in this article, or claim that may be made by its manufacturer, is not guaranteed or endorsed by the publisher.
Abapour, S., Mohammadi-Ivatloo, B., and Tarafdar Hagh, M. (2020). Robust bidding strategy for demand response aggregators in electricity market based on game theory. J. Clean. Prod. 2020, 118393. doi:10.1016/j.jclepro.2019.118393
Bahrami, S., Chen, Y. C., and Wong, V. W. S. (2020). “Deep reinforcement learning for direct load control in distribution networks,” in IEEE power & energy society general meeting (PESGM), Montreal, 1–5. doi:10.1109/PESGM41954.2020.9281703
Chuang, Y. -C., and Chiu, W. -Y. (2022). Deep reinforcement learning based pricing strategy of aggregators considering renewable energy. IEEE Trans. Emerg. Top. Comput. Intell. 6 (3), 499–508. doi:10.1109/TETCI.2021.3109954
EPSIS (2022). Whole-sale market price data. Available at: https://epsis.kpx.or.kr/epsisnew/selectMain.do?locale=eng (Accessed July 18, 2022).
Eyer, J., and Corey, G.P. (2010). Energy storage for the electricity grid : benefits and market potential assessment guide : a study for the DOE Energy Storage Systems ProgramUnited States. doi:10.2172/1031895
Friedman, D. (2018). The double auction market: Institutions, theories, and evidence. London: Routledge.
Gayme, D., and Topcu, U. (2013). Optimal power flow with large-scale storage integration. IEEE Trans. Power Syst. 28, 709–717. doi:10.1109/tpwrs.2012.2212286
Ghosh, S., Subramanian, E., Bhat, S. P., Gujar, S., and Paruchuri, P. (2019). VidyutVanika: A reinforcement learning based broker agent for a power trading competition. Proc. AAAI Conf. Artif. Intell. 33 (01), 914–921. doi:10.1609/aaai.v33i01.3301914
Guan, C., Wang, Y., Lin, X., Nazarian, S., and Pedram, M. (2015). “Reinforcement learning-based control of residential energy storage systems for electric bill minimization,” in 2015 12th Annu. IEEE Consum. Commun. Netw. Conf. CCNC, Las Vegas, 637–642. doi:10.1109/CCNC.2015.7158054
Han, G., Lee, S., Lee, J., Lee, K., and Bae, J. (2021). Deep-learning- and reinforcement-learning-based profitable strategy of a grid-level energy storage system for the smart grid. J. Energy Storage 41, 102868. doi:10.1016/j.est.2021.102868
Kang, B.O., Lee, M., Kim, Y., and Jung, J. (2018). Economic analysis of a customer-installed energy storage system for both self-saving operation and demand response program participation in South Korea. Renew. Sustain. Energy Rev. 94, 69–83. doi:10.1016/j.rser.2018.05.062
Korean Electricity Bill (2022). Electricity tariff structure (in Korean). Available at: https://cyber.kepco.co.kr/ckepco/front/jsp/CY/E/E/CYEEHP00103.jsp (Accessed July 18, 2022).
Lee, W., Kang, B.O., and Jung, J. (2018). Development of energy storage system scheduling algorithm for simultaneous self-consumption and demand response program participation in South Korea. Energy 161, 963–973. doi:10.1016/j.energy.2018.07.190
Lu, X., Li, K., Xu, H., Wang, F., Zhou, Z., and Zhang, Y. (2020). Fundamentals and business model for resource aggregator of demand response in electricity markets. Energy 204, 117885. doi:10.1016/j.energy.2020.117885
Makarov, Y. V., Du, P., Kintner-Meyer, M. C., Jin, C., and Illian, H. F. (2012). Sizing energy storage to accommodate high penetration of variable energy resources. IEEE Trans. Sustain. Energy 3, 34–40. doi:10.1109/tste.2011.2164101
Manz, D., Piwko, R., and Miller, N. (2012). Look before you leap: The role of energy storage in the grid. IEEE Power Energy Mag. 10, 75–84. doi:10.1109/mpe.2012.2196337
Mnih, V., Kavukcuoglu, K., Silver, D., Graves, A., Antonoglou, I., Wierstra, D., et al. (2013). Playing Atari with deep reinforcement learning. arXiv preprint arXiv:1312.5602.
Pandžić, H., Wang, Y., Qiu, T., Dvorkin, Y., and Kirschen, D. S. (2015). Near-optimal method for siting and sizing of distributed storage in a transmission network. IEEE Trans. Power Syst. 30, 2 288–2300. doi:10.1109/tpwrs.2014.2364257
Vargas, L. S., Bustos-Turu, G., and Larra´ın, F. (2015). Wind power curtailment and energy storage in transmission congestion management considering power plants ramp rates. IEEE Trans. Power Syst. 30, 2498–2506. doi:10.1109/tpwrs.2014.2362922
Wang, B., Li, Y., Ming, W., and Wang, S. (2020). Deep reinforcement learning method for demand response management of interruptible load. IEEE Trans. Smart Grid 11 (4), 3146–3155. doi:10.1109/TSG.2020.2967430
Xu, H., Li, X., Zhang, X., and Zhang, J. (2019). Arbitrage of energy storage in electricity markets with deep reinforcement learning, 1–3.
Yu, Y., Cai, Z., and Huang, Y. (2020). Energy storage arbitrage in grid-connected micro-grids under real-time market price uncertainty: A double-Q learning approach. IEEE Access 8, 54456–54464. doi:10.1109/ACCESS.2020.2981543
Keywords: reinforcement learning, energy storage system, demand response, aggregator, electricity market
Citation: Oh S, Jung J, Onen A and Lee C-H (2022) A reinforcement learning-based demand response strategy designed from the Aggregator’s perspective. Front. Energy Res. 10:957466. doi: 10.3389/fenrg.2022.957466
Received: 31 May 2022; Accepted: 18 August 2022;
Published: 15 September 2022.
Edited by:
Morteza Nazari-Heris, The Pennsylvania State University (PSU), United StatesReviewed by:
Amin Mohammadpour Shotorbani, University of British Columbia, CanadaCopyright © 2022 Oh, Jung, Onen and Lee. This is an open-access article distributed under the terms of the Creative Commons Attribution License (CC BY). The use, distribution or reproduction in other forums is permitted, provided the original author(s) and the copyright owner(s) are credited and that the original publication in this journal is cited, in accordance with accepted academic practice. No use, distribution or reproduction is permitted which does not comply with these terms.
*Correspondence: Jaesung Jung, amp1bmdAYWpvdS5hYy5rcg==
Disclaimer: All claims expressed in this article are solely those of the authors and do not necessarily represent those of their affiliated organizations, or those of the publisher, the editors and the reviewers. Any product that may be evaluated in this article or claim that may be made by its manufacturer is not guaranteed or endorsed by the publisher.
Research integrity at Frontiers
Learn more about the work of our research integrity team to safeguard the quality of each article we publish.