Abstract
Geological storage of carbon dioxide is receiving more and more attention as one of the efficient carbon reduction technologies, as China’s carbon-neutral strategic plan moves forward. There is an increasing demand for more effective and thorough methodologies to assess the potential of CO2 storage in deep saline aquifers. This study proposes a method for evaluating the geological storage potential of CO2 in deep saline aquifers and constructs an automatic evaluation system for the comprehensive potential of CO2 geological storage using ArcGIS Model Builder visual modeling technology. The automatic evaluation system consists of four functional parts: information collating and database constructing, data pre-processing, model building evaluation and result validation evaluation. First, structured and unstructured data including underlying geology, tectonic geology, oil and gas geology, and drilling data are collated and established in a geodatabase. Second, pre-processing models of the deep saline reservoir-caprock data are established based on the analysis of the geological evolution history of the study area to determine the effective storage thickness, effective porosity, and the influence range of faults; kriging methods are then used to realize the spatial interpolation of the evaluation parameters. Third, the volume coefficient method is adopted to construct the underground storage space model and to establish the density distribution model of the supercritical CO2 with nonlinear function while taking into account four evaluation factors (i.e. area, effective porosity, effective thickness, effective coefficient) and two limiting factors (i.e. fault, burial depth). Finally, the geological storage potential of CO2 in the study area is evaluated with the classification of the potential level and compared with the numerical simulation results to verify the model’s accuracy. The model is first applied in this paper using a suitable target in China as a case study. The results show that this target area’s anticipated storage potential value reaches 52.557 Mt. The total precision error, according to a comparison of the numerical simulation results, is 8.20%. Based on the results obtained, it can be concluded that the automatic GIS-based modeling approach is suitable for a comparable study of potential evaluation of CO2 geological storage in deep saline aquifers.
Introduction
With economic development and population growth, the global warming situation is extremely serious (Vijayavenkataraman et al., 2012). The emissions of CO2, greenhouse gases, are considered to be one of the significant factors in causing global warming (Dorner et al., 2010; Raza et al., 2016; Cao et al., 2020). Evaluation of geological storage potential is a critical part of large-scale carbon sequestration, which has received great attention over the last two decades (Anwar et al., 2018). CO2 geological storage has multiple carbon reduction pathways (i.e., deep saline aquifers (Murai and Fujioka, 2008), depleted oil and gas reservoirs, unmineable coal seams (Ranathunga et al., 2014), basaltic rocks (Gilmore et al., 2020). The deep saline aquifers, as the greatest potential reservoirs, have a great significance for the geological storage of CO2 in China (Fan et al., 2020). By the estimation of the China Geological Survey 2005, the geological storage potential of CO2 in deep saline aquifers can reach 1435 GT (Zhang et al., 2005). Considering the complexity and scale of China’s sedimentary basins, and based on the previous research on CO2 geological storage conducted by the Carbon Sequestration Leadership Forum (CSLF ) (Bachu et al., 2007) and Other institutions(the Intergovernmental Panel on Climate Change (IPCC), 2005; the U.S. Department of Energy (USDOE), 2007, as well as academics (Bachu and Adams, 2003; Oldenburg, 2008; Goodman et al., 2011), China divided the evaluation of CO2 geological storage potential into five scales, from low to high, national scale, basin scale, target scale, site selection scale, and injection scale (Figure 1) (Guo et al., 2015).
FIGURE 1

Session and potential grading of CO2 geological storage in China (national scale (E), basin scale (D), target scale (C), site scale (B), and injection scale (A)).
According to the characteristics of potential evaluation at different scales, a series of evaluation methods have been proposed by CLSF, USDOE, and other institutions, such as area method, volume method, volume factor method, burial mechanism method, numerical simulation, etc. These methods can be categorized as simple function methods and numerical simulation methods (Bachu, 2015). The former methods are generally applied to potential evaluation at small and medium scales (e.g., national scale, basin scale), with the major parameters of reservoir area, thickness, porosity, permeability, boundaries, etc. The latter methods focus on the evaluation of potential at large scales (e.g., site scale, injection scale) and are more concerned with non-homogeneity, uncertainty, and displacement storage efficiency, etc (Rasheed et al., 2020). Based on previous studies, an overview of the advantages and disadvantages of these methods is presented. For feasibility evaluation, the simple function methods have the advantages of simplicity and efficiency in the selection of evaluation parameters and calculation processes. Due to the limitation of existing legacy data, the methods are difficult to quantify geological uncertainties, and often select a few representative borehole cases to replace the whole basin or region that lead to less accurate and reliable evaluation results. For detailed evaluation, the numerical simulation methods involve a combination of two computationally intensive steps: geological modeling and dynamic simulation. The accuracy of geological modeling depends on the quantity and quality of geological data, such as borehole data, 2D and 3D geophysical data, etc (Zhong and Carr, 2019). Dynamic simulation is a commonly used engineering numerical simulation prediction or verification method, mainly based on Physico-chemical experiments and empirical parameters, etc. Through numerical simulation and engineering validation methods, we can obtain the accurate and reliable potential evaluation results, but there are also some problems, such as the problem of data acquisition, and the inefficiency of calculation. Target scale potential evaluation, as a medium scale, plays a bridging role in the feasibility planning and detailed site selection for CO2 geological storage. It serves as a crucial foundation for selecting and evaluating site scale suitability (Li et al., 2015). However, studies on the evaluation of CO2 geological storage potential at the target scale still need to be further developed. Due to the uncertainty of underground space and the complexity of geological structure, target scale potential modeling needs to consider a series of geological parameters, including reservoir geometry, thickness, porosity and permeability, the salinity of formation water, caprock thickness and continuity, and the presence of known active faults (Martinez et al., 2010). Our study addresses the need for practical, efficient, and reliable approaches for quantifying the geologic uncertainty and the safety constraint on target scale potential evaluation.
In this paper, to solve the problem of spatially heterogeneous distribution of reservoir parameters (e.g., reservoir thickness, top-bottom surface, porosity, etc.), we employ an empirical Bayesian kriging interpolation method for uncertainty estimation from existing boreholes, physical surveys, and other geological data. Also, a nonlinear fitting equation of CO2 burial depth versus density is established based on the formation pressure and temperature data. In addition, to ensure the safety of CO2 geological storage, fault and burial depth constraints are added to the USDOE potential evaluation method. Finally, spatial analysis methods and visual modeling techniques by Geographic Information System (GIS) are utilized to develop an automatic modeling method for the geological storage potential of CO2 in saline aquifers at the target scale. Comparing with previous studies, this automatic method employs spatial interpolation to estimate the uncertainty of subsurface space, which can improve the accuracy and reliability of potential evaluation to a certain extent. In the modeling of complex geological systems with high volume of data, the GIS technology can improve the efficiency and automation of the model building. Certainly, this approach, as an automated black-box model, is not perfect, data quality, standardized processing, and applicability are all practical issues that need to be explored. Certainly, this approach is not perfect, and as an automated black-box model, issues like data quality, standardized processing, etc have a major impact on modeling. Those are also all are practical problems that need to be addressed.
Study area
The study area is a potential target area of CO2 geological storage located in a sedimentary basin in southern China. The selection of the target area is based on the information of the CO2 geological storage suitability of China prepared by the China Geological Survey (Guo et al., 2014). The deep saline aquifers in the target area contain three sets of stratigraphy, rock 1(roc1), rock 2(roc2), and rock 3(roc3), as shown in Figure 2. The formation roc1 has a mudstone with little sandstone lithology, with burial depth of 878.0–2505.0 m and thickness of 123.5–1021.5 m, which has a suitable caprock condition. The formation roc2 has a complex lithology with sandstone and mudstone interlayers. The burial depth of the formation is 963.5–3218.5 m, and the thickness is 85.5–851.3 m. Moreover, the porosity of sandstone is 17–26%, and the permeability of sandstone is about 234.7–689.1mD, which can be treated as a reservoir for the geological storage of CO2. The formation roc3 has a burial depth of 1058.5–4097.0 m and a thickness of 94.0–880.4 m. The lithology of the formation is sandstone interbedded mudstone, where the porosity of the sandstone is 18–22% and the permeability of the sandstone is about 20.0–655.0 mD. Similar to the formation of roc2, roc3 is also suitable as a reservoir for the geological storage of CO2.
FIGURE 2
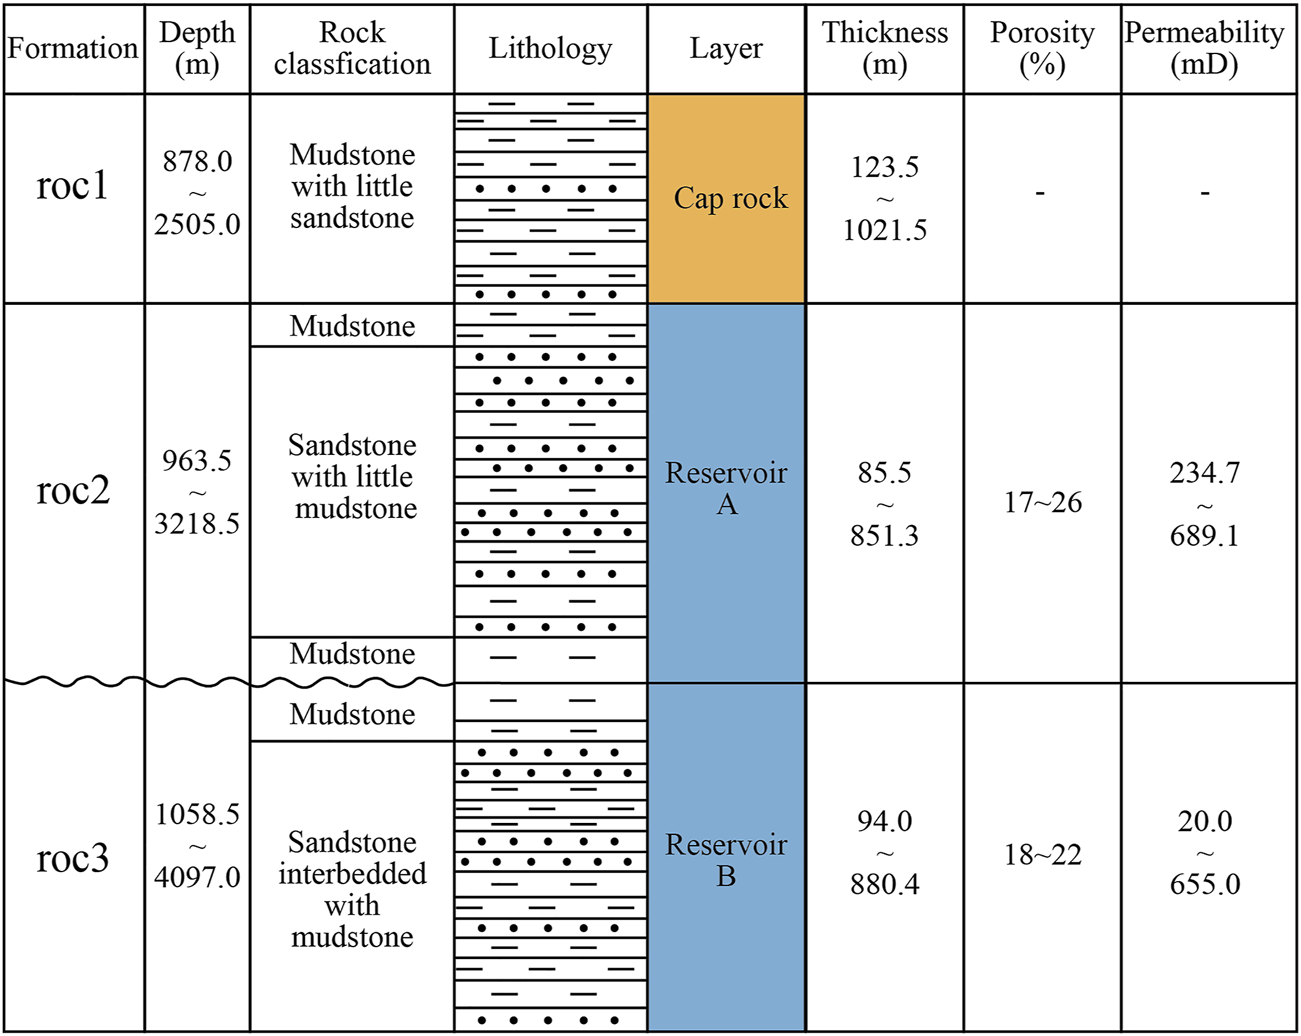
Overview of the study area formations (modified by Guo et al. (2014)).
The spatial distribution characteristics of the sedimentary facies are mapped based on the geological investigation of the reservoir, as illustrated in Figure 3. In the study area, a lake-braided river delta sedimentary structure was created. Three types of sedimentary facies are identified: shore-shallow lake facies (type c), delta-front facies (type b), and delta-plain facies (type c).
FIGURE 3
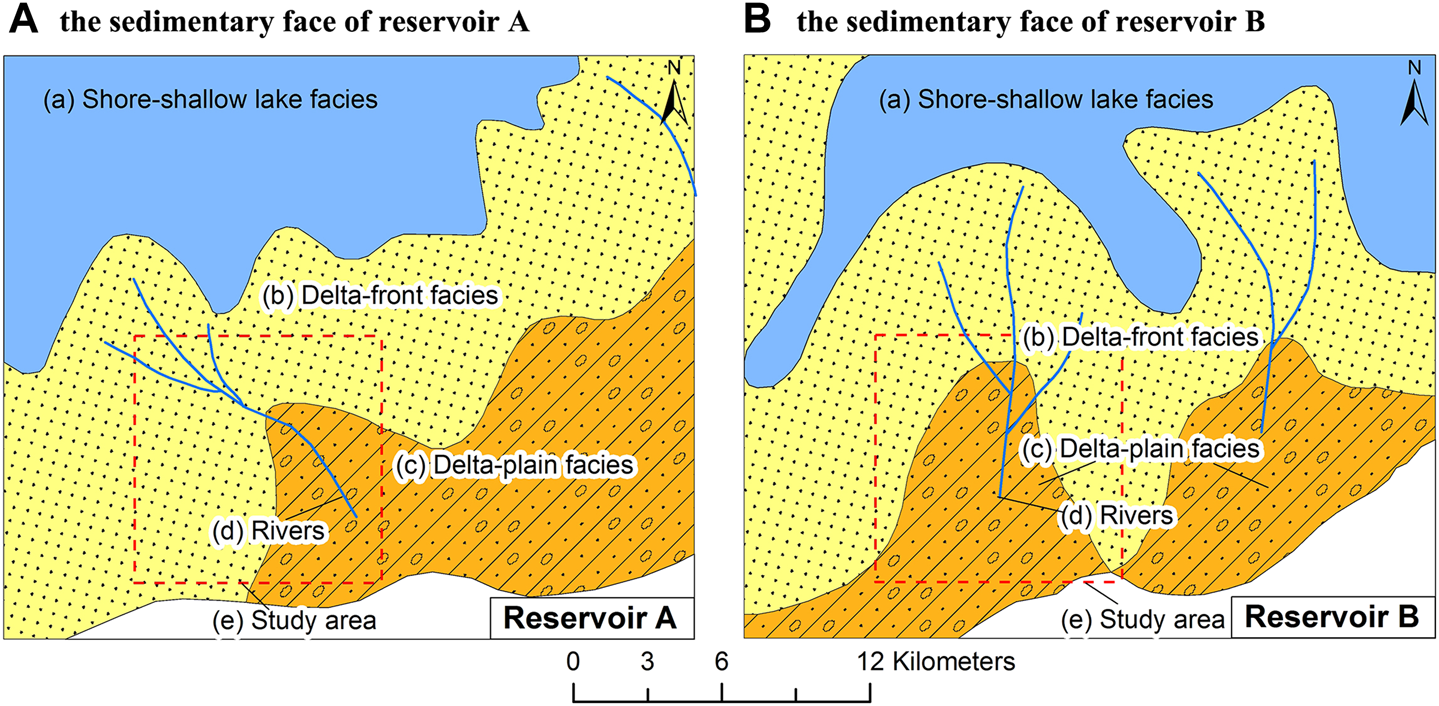
Sedimentary facies maps of the study area (Original data from Reference (Wang, 2019)).
Materials and methods
Data and processing
The magnitude of geological storage potential of CO2 in saline aquifers is related to the geological storage conditions, storage mechanism types, and the driven efficiency (Hicks and Green, 2017). The potential evaluation includes two main aspects of CO2 storage: storage potential, and containment safety (Abuov et al., 2020). The storage potential is determined by the scale of the storage area, the thickness of aquifers, the formation porosity, the storage density of CO2, and the storage efficiency factor (Popova et al., 2014). The containment safety is bound by tectonic, depth, and fault intensity (Tan et al., 2020). The data source includes the macro geological characteristics information of the reservoir and caprock layer such as reservoir distribution area, depth, thickness, and lithology. It is also important to collect information on key parameters such as porosity, permeability, water saturation, formation water mineralization, formation temperature, formation pressure, storage efficiency, etc., as shown in Table 1.
TABLE 1
| Terms | Parameters | Description |
|---|---|---|
| storage potential | area | Evaluated with GIS for each unit at the scale 100 m × 100 m |
| thickness of reservoirs | Evaluated with GIS for each individual area from isopach maps of the reservoir | |
| porosity of reservoirs | Evaluated from geophysical logs in boreholes using GIS. | |
| density of CO2 | Dataset of CO2 properties for the reservoir pressure and temperature estimated using GIS. | |
| storage efficiency | The factor is a function of geologic parameters and displacement efficiency components | |
| containment safety | tectonic setting | The factor reflects the regional background conditions of CO2 geological storage security |
| depth of reservoirs | Burial depth of the reservoir is from 800 to 3500 m | |
| faults | Buffering a certain safety distance from faults using GIS |
Data for CO2 geological storage potential evaluation.
The approach developed by USDOE is used to evaluate the CO2 storage potential in deep saltwater aquifers (Goodman et al., 2011). Aquifers are thought to be subject to regional flows connected to large-scale flow systems, and as a result, CO2 will only be present in the hydrodynamic trap. Equation 1 provides the formula for the effective storage potential in saline aquifers.where MCO2 is the expected value for the geological storage potential of CO2, E is the effective coefficient of CO2 geological storage, A is the whole area of the target area, h is the effective thickness of reservoirs, is the effective porosity of reservoirs and is the storage density of CO2.
The CO2 storage safety in deep saline aquifers is a constraint controlled by the fault and burial depth, which can be formulated using a set of activation functions (2,3).where means the evaluation unit is in the fault affected area, while means the evaluation unit is not in the fault affected area.where x means burial depth, CO2 storage is only suitable when the depth of burial is greater than 800.
Reservoir criteria
Characterizing reservoir compartmentalization is a crucial step in the estimation of CO2 geological storage. It contains reservoir characteristics, hydrogeological conditions, and geological safety factors. The criteria for reservoir characterization include reservoir depth, reservoir thickness, and physical properties, namely porosity and permeability, and other relevant reservoir parameters. According to Table 2, the depth of the reservoir must be no less than 800 m to ensure that the CO2 is in a supercritical state. Individual aquifers should have favorable storage properties, such as the thickness of not less than 10 m, the porosity of not less than 5%, and permeability of not less than 1 mD for better injectivity and larger storage potential. These relevant properties are regarded as the key controlling parameters for reservoir selection for the potential evaluation of CO2 storage (Goudarzi et al., 2019). In the terms of hydrogeological conditions, there are some constraints on the water mineralization degree and the dynamic conditions of groundwater. Reasonable assumptions on hydrogeological boundary conditions are the prerequisites for the potential evaluation of CO2 geological storage. The mineralization of saline stratigraphic water is preferably controlled at 10–50 g/L. It is assumed that the dynamic condition of the groundwater in the reservoir is not in the opening zone and can’t be used directly. Since many aquifers are confined or semi-confined, geologic safety parameters are focused on caprock failure criteria, such as the thickness of caprock, distance from active faults, and peak ground acceleration (Martinez et al., 2010; Elenius et al., 2018; Ling et al., 2021). The thickness of the caprock can be characterized by the individual thickness and the cumulative thickness, which has a significant effect on CO2 leakage (Chen et al., 2014). According to the sealing study of caprock, the optimum thickness index is the individual thickness greater than 20 m or the cumulative thickness greater than 300 m (Shen et al., 2009). A stable crustal is essential for the security of geological storage. The evaluation indexes of crustal stability include fault distance and peak ground acceleration. According to the reservoir selection evaluation of CO2 site selection, the distance to the regional active fault is not less than 25 km away, and the dynamic peak acceleration is not higher than 0.015 (g).
TABLE 2
| Screening term | Index | Criteria |
|---|---|---|
| Reservoir characteristics | Depth | ≥800 m |
| Thickness | ≥10 m | |
| Porosity | ≥5% | |
| Permeability | ≥1 mD | |
| Hydrogeological conditions | Mineralization degree | 10–50 g/L |
| Dynamic conditions of groundwater | Not in the opening zone | |
| Geological safety factors | Thickness of caprock | individual thickness > 20 m, or cumulative thickness > 300 m |
| Distance from active fault | ≥25 km | |
| Peak ground acceleration | ≤0.15 g |
Reservoir screening criteria.
Effective area
The effective area is the evaluation area of the selected reservoirs that match the conditions of CO2 geological storage, including the boundary range and spatial accuracy. Based on the qualitative analysis of geological formations and faults, the boundary range of the evaluation area is determined. According to numerical simulation experiments, CO2 migration in isotropic, homogeneous, and non-deformable saline aquifers may reach a lateral distance of approximately 1,000 m after 100 years since injection (Xie et al., 2015). To cover the later geological storage siting requirements, it is appropriate to determine the spatial accuracy of the potential evaluation as 100 m × 100 m.
Effective thickness
Effective thickness is the thickness of the reservoir that meets the criteria for the geological storage of CO2. Different categories of geological reservoirs have different effective thickness screening criteria. The geological storage of CO2 in the deep saline aquifer mainly considers the thickness of individual aquifers, sand to mud ratio, and other factors. The ratio of effective thickness Rh is the fraction of thickness of the individual aquifers and the total reservoir (4). In spatial terms, reservoirs in the same depositional system have similar parameters (e.g., reservoir properties and fluid properties). Therefore, the ratio of effective thicknesses can be spatially interpolated employing the analogous method, as shown in Figure 4.
FIGURE 4
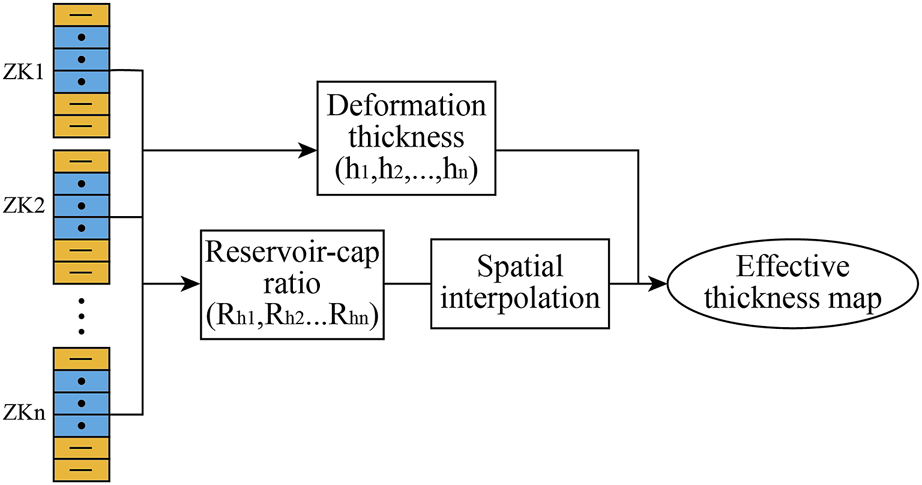
Processing of effective thickness.
The ratio of effective thickness :
Effective porosity
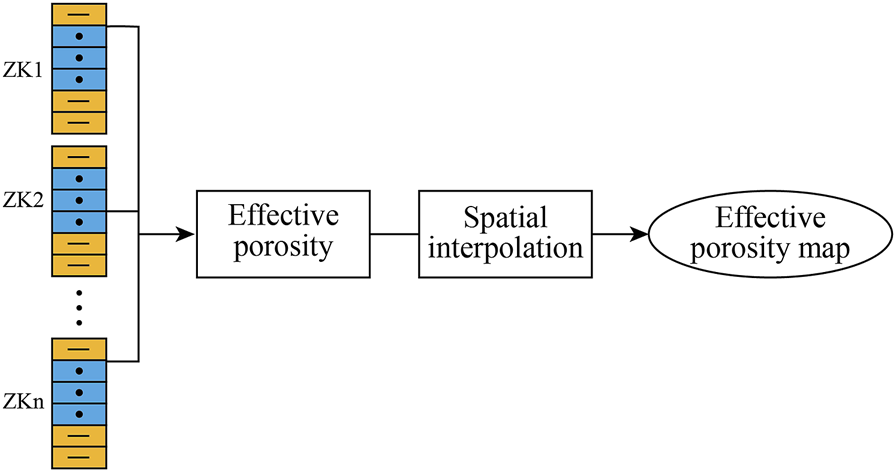
Reservoir porosity is a key controlling parameter for CO2 storage potential (Goudarzi et al., 2019; Lv et al., 2020). Porosity is the ratio of the volume of pores in a rock to the total volume of the rock. The effective porosity is the fraction of porosity of the individual aquifers and the total reservoir (5).where is the thickness of the total reservoir; is the thickness of the individual aquifers; is the porosity of the individual aquifers.
The processing model of the porosity includes effective index parameter calculation, spatial interpolation analysis, and raster conversion, as shown in Figure 5.
FIGURE 5
Processing of the effective porosity.
CO2 density
The density of CO2 varies with the external environmental conditions. Pressure and temperature are the largest factors controlling density and are both functions of depth (Popova et al., 2014; Kabirzadeh et al., 2020). Under a specific temperature and pressure, the state of CO2 can switch between gaseous, liquid, solid, and supercritical states. When the temperature is 31.1°C and the pressure is 7.38 MPa, CO2 transforms into a supercritical state and turns into a dense, thick liquid (Nomeli and Riaz, 2017; Yuan et al., 2020). Density is the in situ density of pure carbon dioxide at a specific pressure and temperature (Ogawa et al., 2011).
Density (ρ) is the mass (m) of a substance per unit volume (V). The density of CO2 can be calculated by (6):Where M refers to the relative molecular mass of CO2 gas; R is the ideal gas constant; Z is the compressibility.
According to the equation, the density of CO2 depends mainly on temperature and pressure, both of which are related to the burial depth (Aminu et al., 2017). According to the temperature and pressure data at different depths, the corresponding density data of CO2 can be obtained from the website (http://www.peacesoftware.de/einigewerte/CO2 e.html). Then, the density model of CO2 can be built by the fitting method.
Fault effects
The presence of faults and fractures affects the integrity and continuity of the caprock. When the fault offset is greater than the thickness of caprock and the fractured zones are permeable, the sealing ability of cap rock will be greatly weakened (Bigi et al., 2013; Bu et al., 2016). Therefore, faults are very detrimental to CO2 geological storage. To mitigate the threat of faults, the effects of faults need to be assessed at the stage of CO2 storage potential evaluation. Selection of a suitable avoidance distance to ensure the safety of geological storage is the common means. According to the scale of faults, the avoidance distance can be roughly divided into four categories, 25 km for Class I faults (regional faults), 5.0 km for Class II faults (major faults), 0.5 km for Class III faults (secondary faults) and 0.1 km for other derived faults (ACCA and CHEGS, 2012).
With the classification criterion, the fault-affected areas are calculated by multi-level buffer spatial analysis based on the vector data of fault lines. To facilitate model calculations, all evaluation data are converted to raster format. The process of classification of fault-affected areas is shown in Figure 6.
FIGURE 6

Processing of fault affected zone.
Burial depth of CO2
The burial depth of CO2 is the distance from the top surface of the reservoir to the ground surface, namely the depth of the reservoir (Zhang et al., 2020). According to the supercritical CO2 state condition, the theoretical depth of CO2 geological storage is 800 m. Considering the current internationally accepted economic level, the economic depth of CO2 geological storage is 3500 m. The depth of the reservoir can be modeled by the three-dimensional spatial interpolation method, as shown in Figure 7. First, the irregular triangular network (TIN) of the reservoir depth is generated by the 3D analyst of the fathom line maps. Then, a spatial interpolation method is adopted to obtain the raster data of the reservoir depth.
FIGURE 7

Processing of the reservoir depth.
Empirical Bayesian Kriging
Empirical Bayesian kriging (EBK) is a geostatistical interpolation method that provides the fast and reliable solution for both automatic and interactive data interpolation. As a contrast, a major improvement of EBK has been made by Krivoruchko and Gribov upon the classical Kriging methods coded within the ESRI ® software package (Krivoruchko and Gribov, 2019). EBK accounts for the error introduced by estimating the underlying semi-variogram through numerous simulations (Finzgar et al., 2014). The semi-variogram calculation is based on the Bayesian rule, which exhibits the proclivity that the observed dataset can be created from the semi-variogram. The bayesian equation rule is given as posterior:where the represents the prior, marginal probability in the most instances there they are ignored, the posterior.
The interpolation process of EBK follows three criteria as proposed by Krivoruchko, 1) the model estimate semivariogram from the input dataset 2) based on the generated semivariogram a new predicted is value against each inputted dataset location and 3) finally a model is computed from the simulated dataset. Through a process of sub-setting and simulations, EBK automatically calculates model parameters instead of manually adjust parameters (Li et al., 2020).
Automatic modeling framework
The workflow of potential evaluation and the processing of evaluation factors provides the foundation for establishing a unified and standardized automatic modeling of CO2 geological storage potential. ArcGIS Model Builder is a graphical modeling program for creating, editing, and managing models. The program uses a flowchart approach to connect data and models in an orderly manner to achieve advanced and complex modeling tasks. In this paper, the Model Builder visual modeling technology is used to construct an automatic assessment system for the comprehensive potential of CO2 geological storage in deep saline aquifers. The modeling data includes an equi-depth reservoir, reservoir thickness, borehole porosity, distribution of faults, etc. Components for automatic modeling consist of file conversion, 3D analysis, spatial analysis, and data management, and other tools from ArcToolbox. The visualization framework for automatic modeling is shown in Figure 8.
FIGURE 8
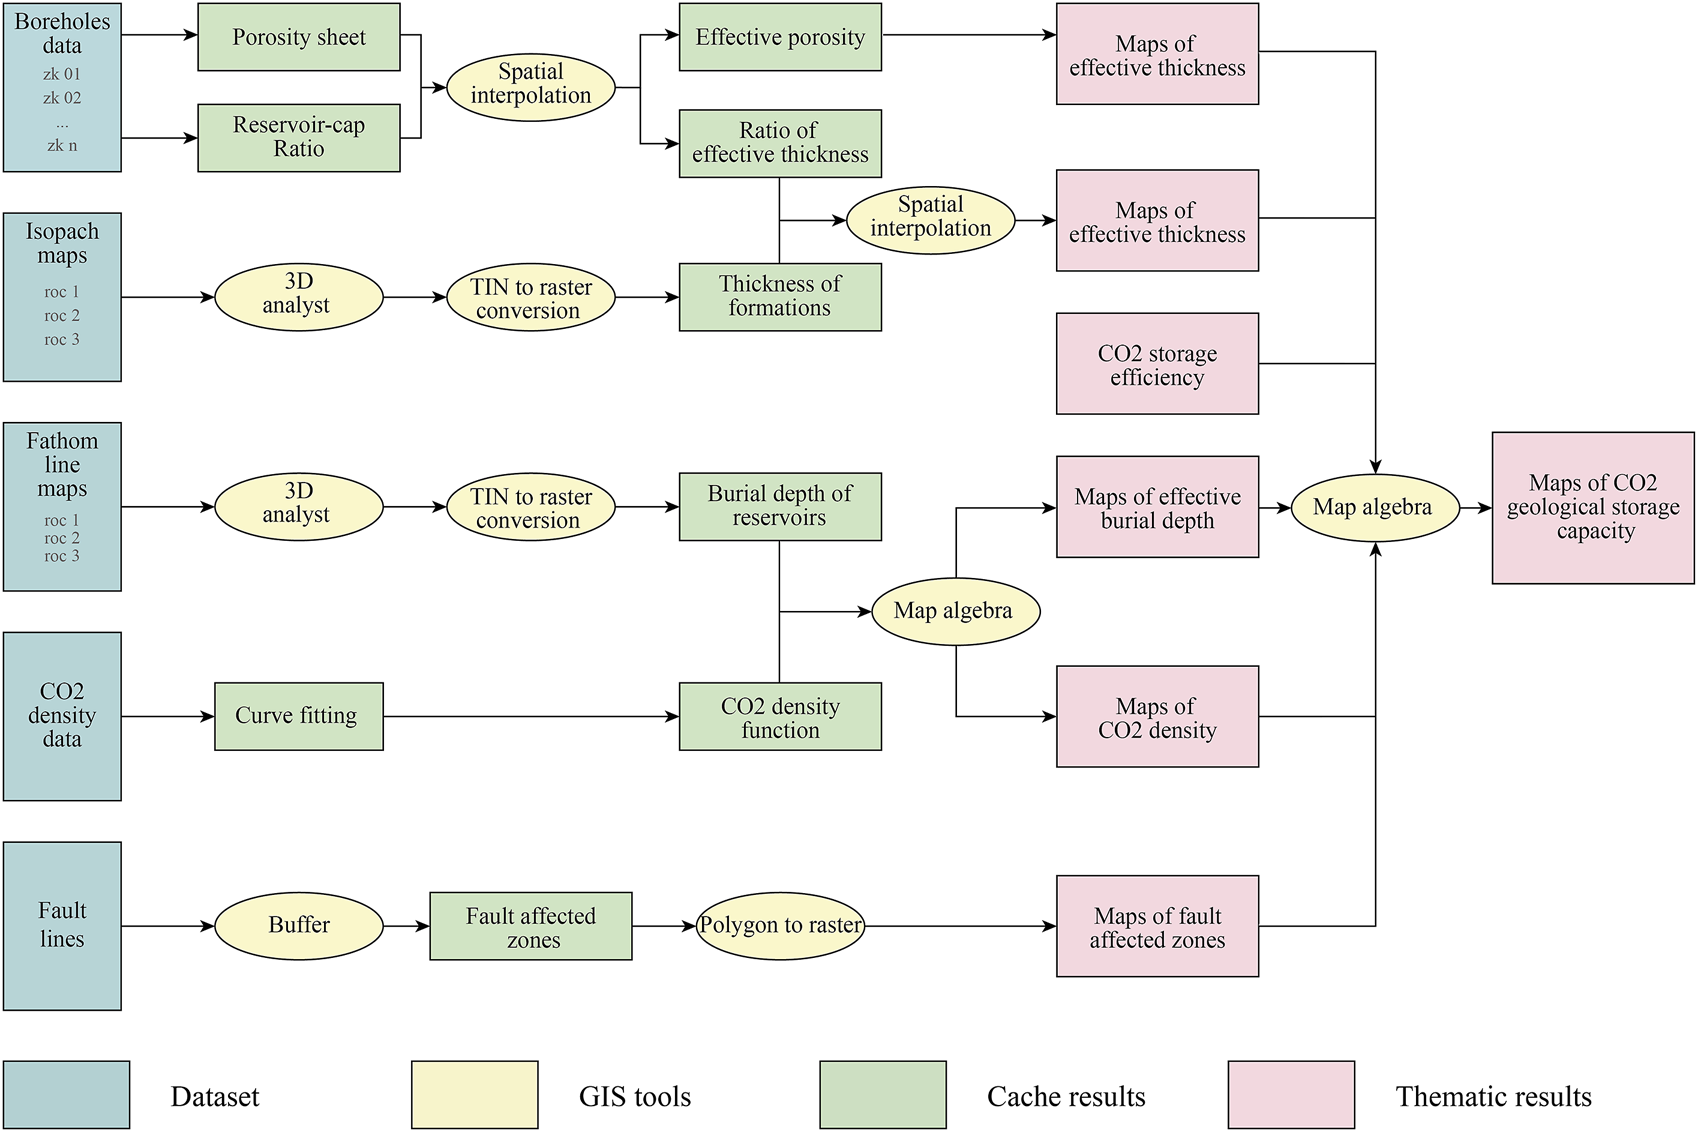
Automatic modeling diagram of CO2 geological storage potential evaluation based on GIS.
Results and discussion
Taking a target area in a sedimentary basin in China as an example, we calculate the subsurface reservoir space and its corresponding CO2 density under different stratigraphic conditions respectively, to calculate the total amount of CO2 geological storage.
Results of the effective volume
(1) Thickness distribution of reservoirs
The thickness of the reservoir is obtained from the rate of the effective reservoir and the thickness of the formation. At the spatial level, the rate of the effective reservoir is obtained through spatial interpolation analysis of existing borehole data by ArcGIS 10.2 software. The spatial interpolation operation assumes that similar depositional environment has a similar rate of the effective reservoir, and that the distance from the existing borehole site is the weight affecting the magnitude of the rate of the effective reservoir. The thickness distribution of reservoirs for CO
2geological storage is shown in
Figure 9. According to the thickness distribution of the reservoir A and B, the thickness of reservoir ranges from 100 to 900 m, and the average thickness of reservoir A is 390.28 m, and the average thickness of reservoir B is 486.16 m.
(2) Porosity distribution of reservoirs
FIGURE 9
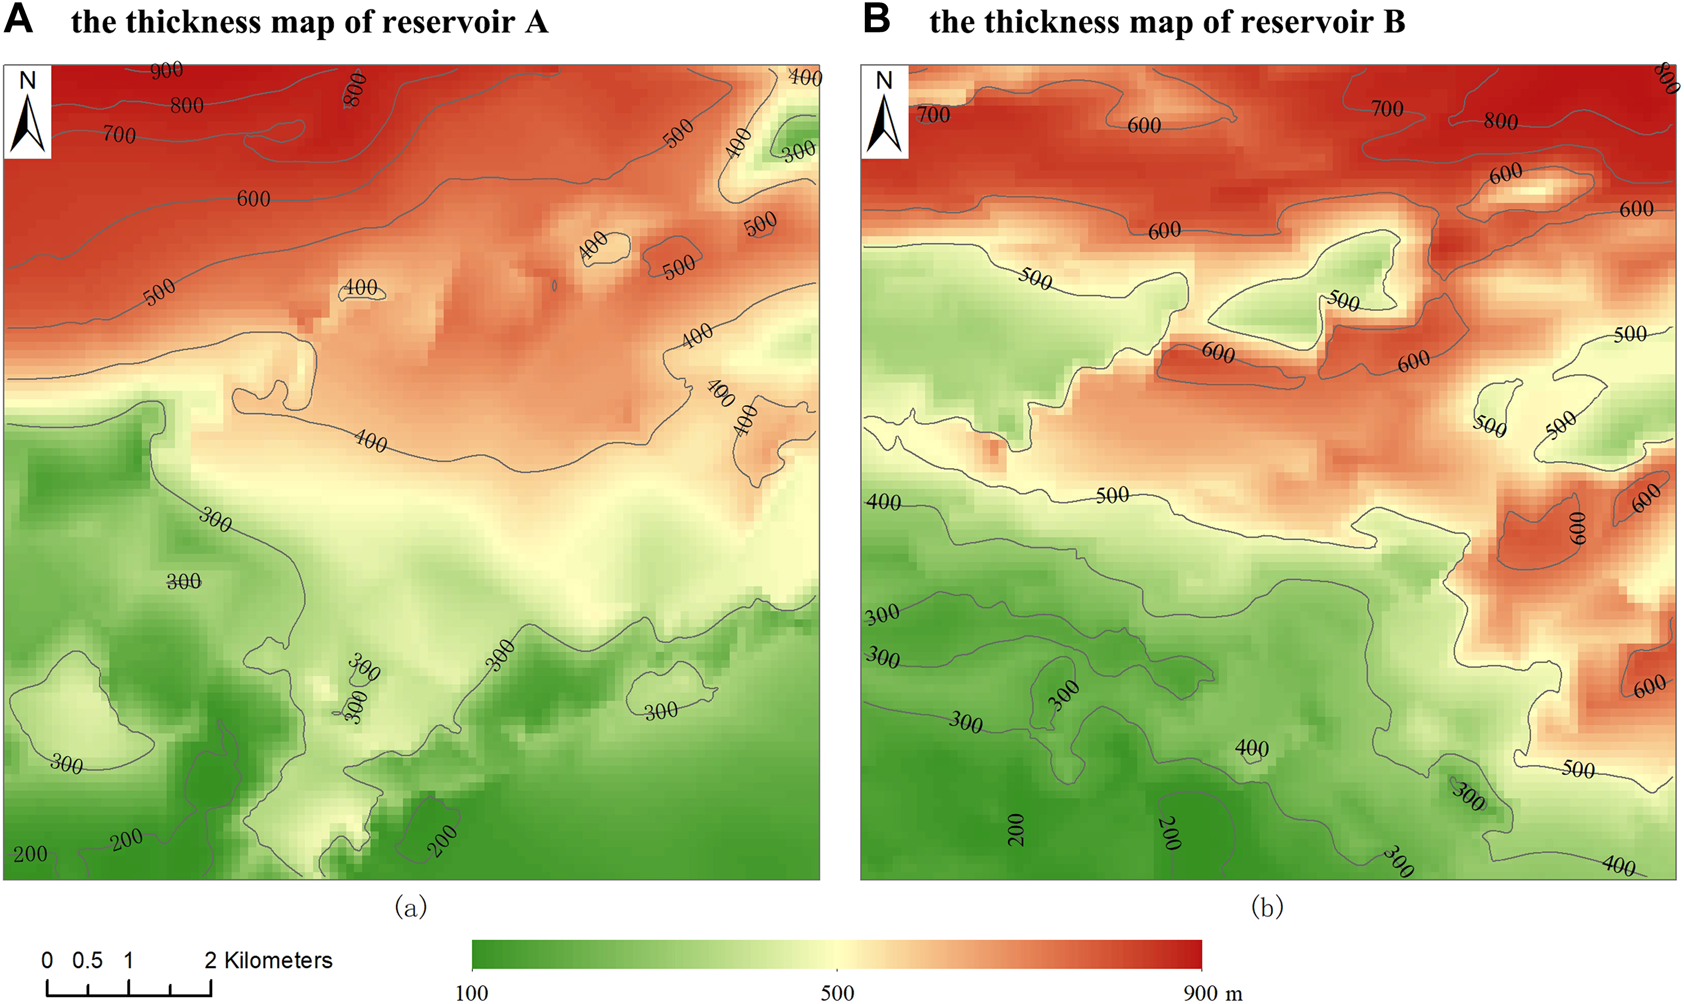
Thickness maps of reservoirs.
As shown in
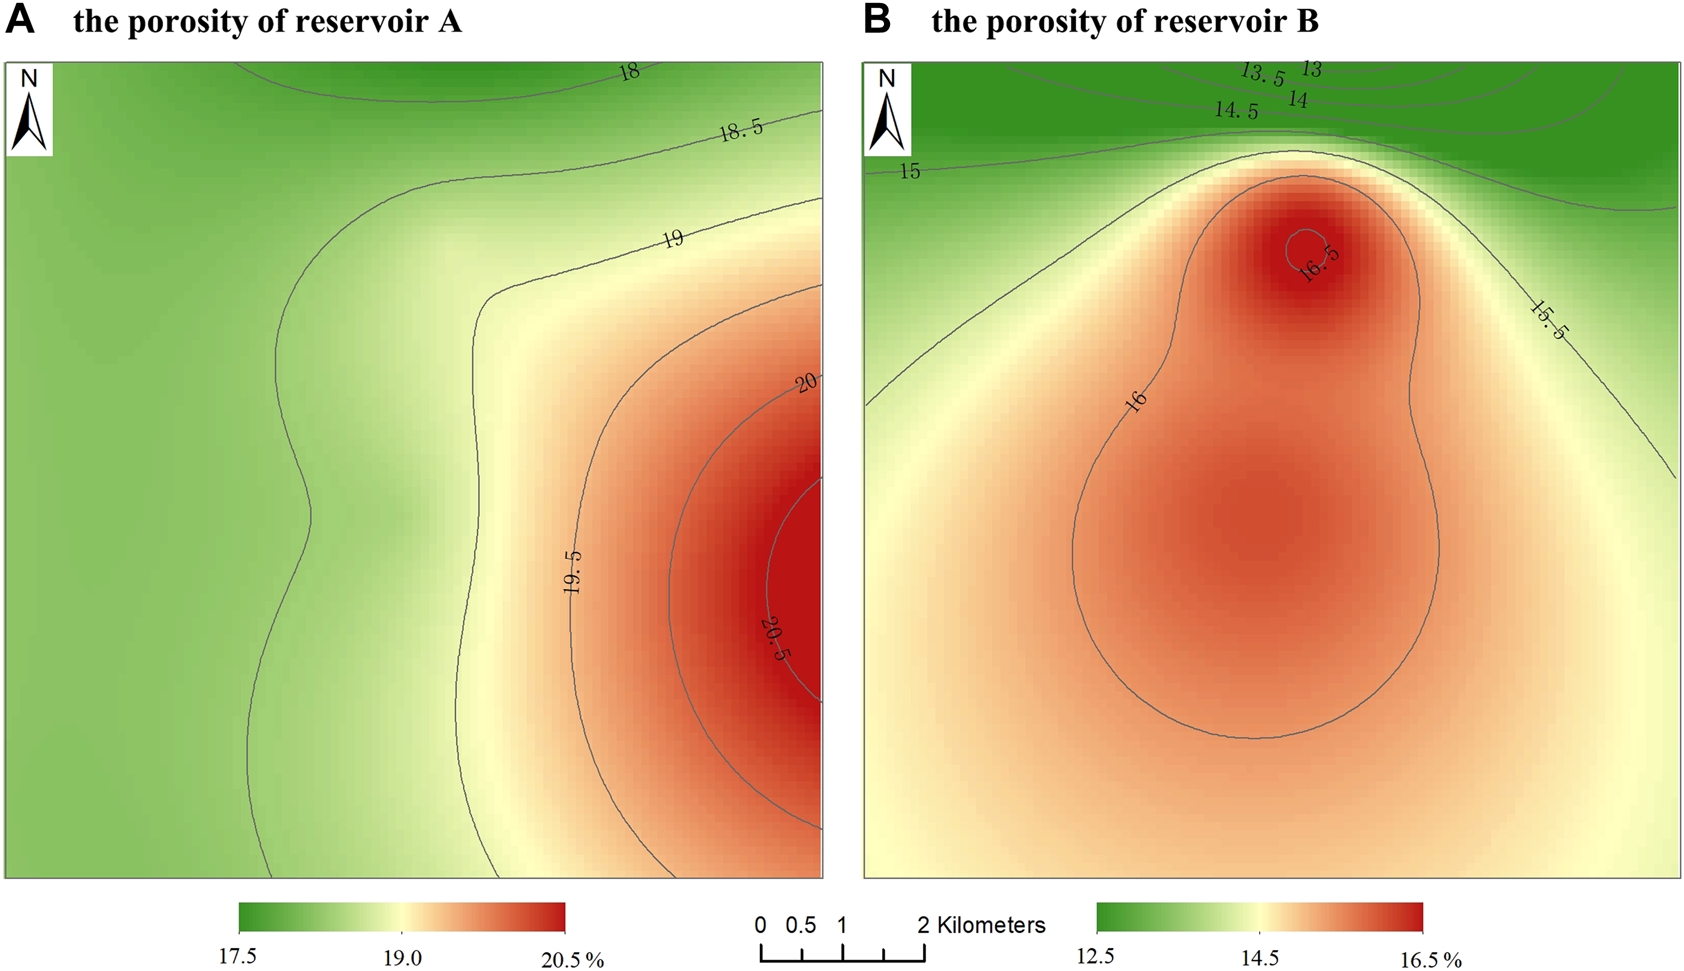
Figure 10, it observed that reservoir A has excellent connectivity, with effective porosity ranging from 17.77% to 20.76% and an average porosity of 18.86%. Similarly, reservoir B also has good connectivity with effective porosity ranging from 12.85% to 16.53% with an average porosity of 15.64%.
(3) CO2 storage efficiency
FIGURE 10
Porosity maps of reservoirs.
For saline aquifers, the CO2 storage efficiency factor is a function of geologic parameters. According to the USDOE methodological recommendations for assessing the geological storage potential of CO2, the parameters of storage efficiency adopt Goodman’s suggested values which are based on the Monte Carlo method (Goodman et al., 2011).
In this study, we used the value of the efficiency factor suggested by the USDOE.
The USDOE uses Monte Carlo simulation to obtain the statistical distribution of the effective storage factor (E), which ranges from 3.1% to 10% over the P10 and P90 percent probability of the clastic reservoir (Table 3).
TABLE 3
| Lithology | P10 (%) | P50 (%) | P90 (%) |
|---|---|---|---|
| Clastics | 3.1 | 6.1 | 10 |
| Dolomite | 5.1 | 6.9 | 9.2 |
| Limestone | 3.5 | 5.2 | 7.3 |
Suggested values for geological storage coefficient for CO2 in the saline aquifer.
The storage density of CO2
It’s difficult to obtain the precise density when calculating the amount of CO2 structural storage. For that, it must make a reasonable generalization of the geological reservoir model in two sections. Firstly, a statistical method is used to establish the CO2 density equation in the vertical direction. Secondly, the spatial calculation of CO2 density distribution in the whole area is performed by the map algebra toolset. According to the borehole logging data, the temperature and pressure data at different depths are obtained after conversion in Table 3. The CO2 density column is obtained by performing calculations through the website (http://www.peacesoftware.de). Based on Table 3, a relationship between CO2 density and reservoir depth can be established by the curve fitting method. The functional relationship can be expressed as Eqs 7–9, and the fitted curve plot is shown in Figure 11.where where where . where T is the in-situ temperature of the reservoir, °C; P is the in-situ pressure of the reservoir, MPa; ρCO2 is the density of the storage CO2, kg/m3; H is the depth of the reservoir, m.
FIGURE 11

The fitted curve plot of CO2 density.
Based on Eq. 9, the CO2 density distribution maps can be calculated using GIS spatial analysis, as shown in Figure 12. From the CO2 density distribution map of reservoir A, it can be seen that the CO2 density is ranging from 281.94 kg/m3 to 633.49 kg/m3 and the average density is 524.67 kg/m3. From the CO2 density distribution map of reservoir B, it observes that the CO2 density is ranging from 379.49 kg/m3 to 690.63 kg/m3 and the average density is 591.89 kg/m3.
FIGURE 12
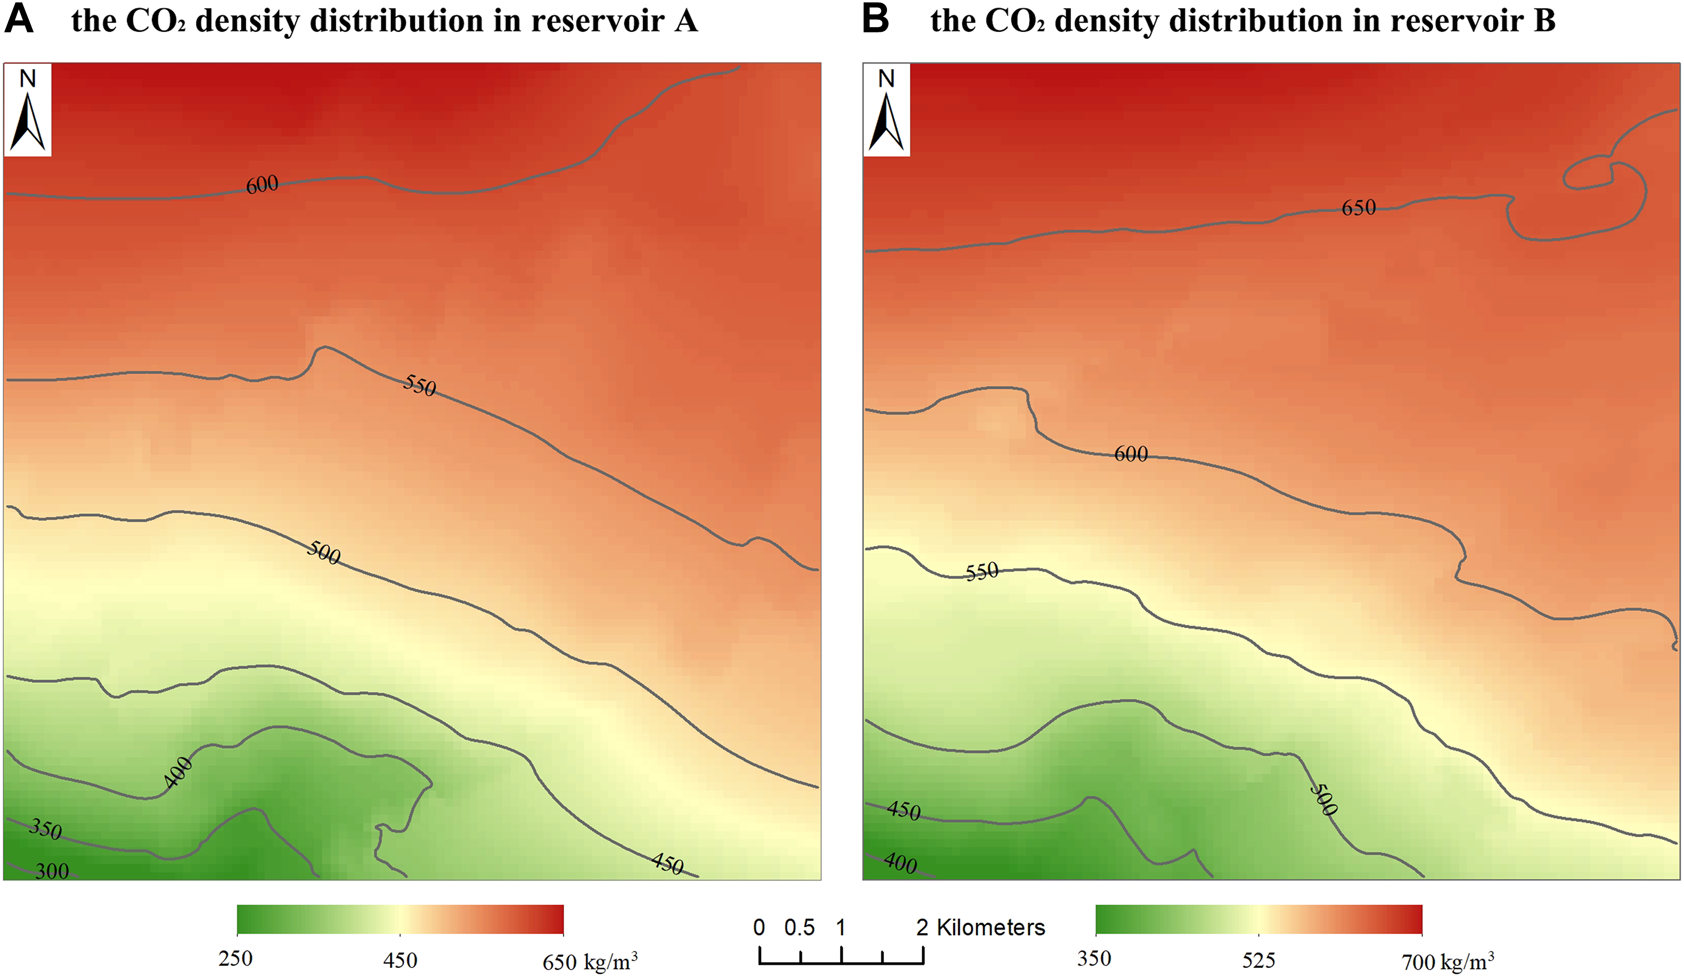
Maps of CO2 density distribution.
Results of the containment safety
(1) Distribution of faults
It not only has abundant potential and is essential for CO
2storage, but also for the estimation of potential risks of leakage. Therefore, a suitable storage site should be far from fault-affected areas. By buffer analysis of the faults, the areas affected by individual faults have been delineated, as shown in
Figure 13. Reservoir A is divided into six zones, as shown in
Figure 13A. The total area of CO
2storage amounts to 53.527 km
2, and the largest zone is about 22.626 km
2. Reservoir B is divided into six zones, as shown in
Figure 13B. The total area of CO
2storage amounts to 41.129 km
2, and the largest zone is about 15.945 km
2.
(2) Depth of the reservoirs
FIGURE 13
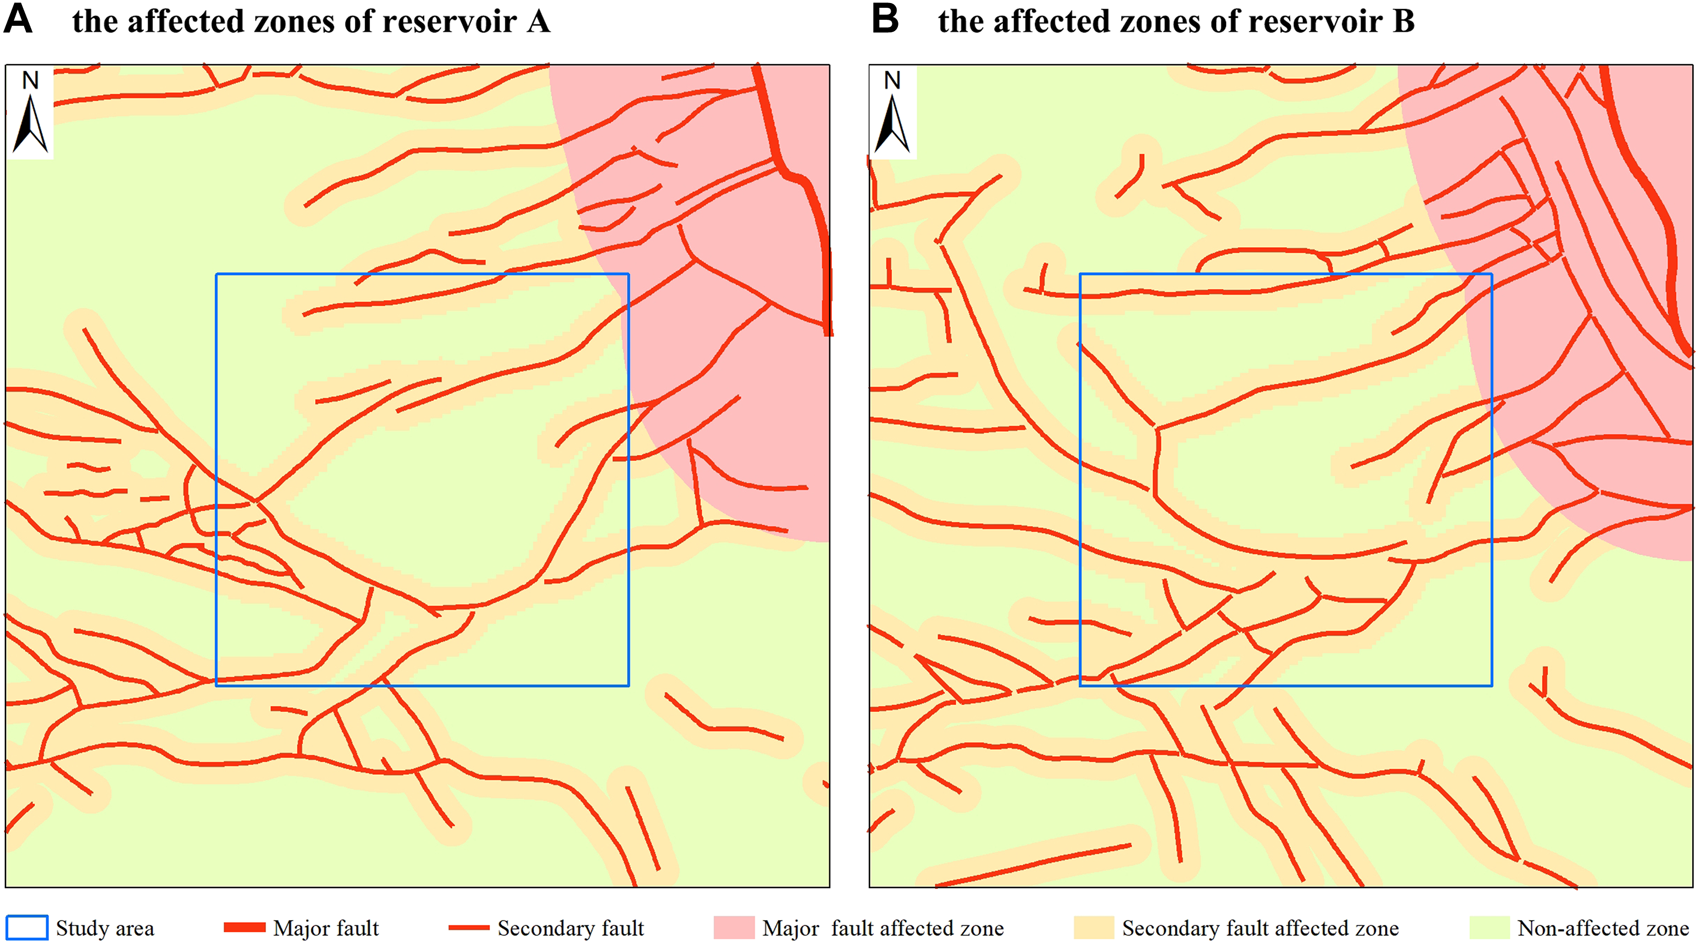
Maps of the zone affected by the faults.
CO
2burial depth is generally based on the top depth of the reservoir. The map of the burial depth can be obtained by ArcGIS software using 3D analysis for isobath interpolation and raster conversion. It can be observed that the depth of reservoir A is mainly between −947 and −2100 m, and the average depth is about −1600 m, as shown in
Figure 14A. Besides,
Figure 14Balso portrays the depth map of the reservoir B, it ranges from −1100 to −2900 m, with an average depth of about −1975 m. In general, the depth of the reservoir is greater than 800 m, and the CO
2storage will be in the safe depth range.
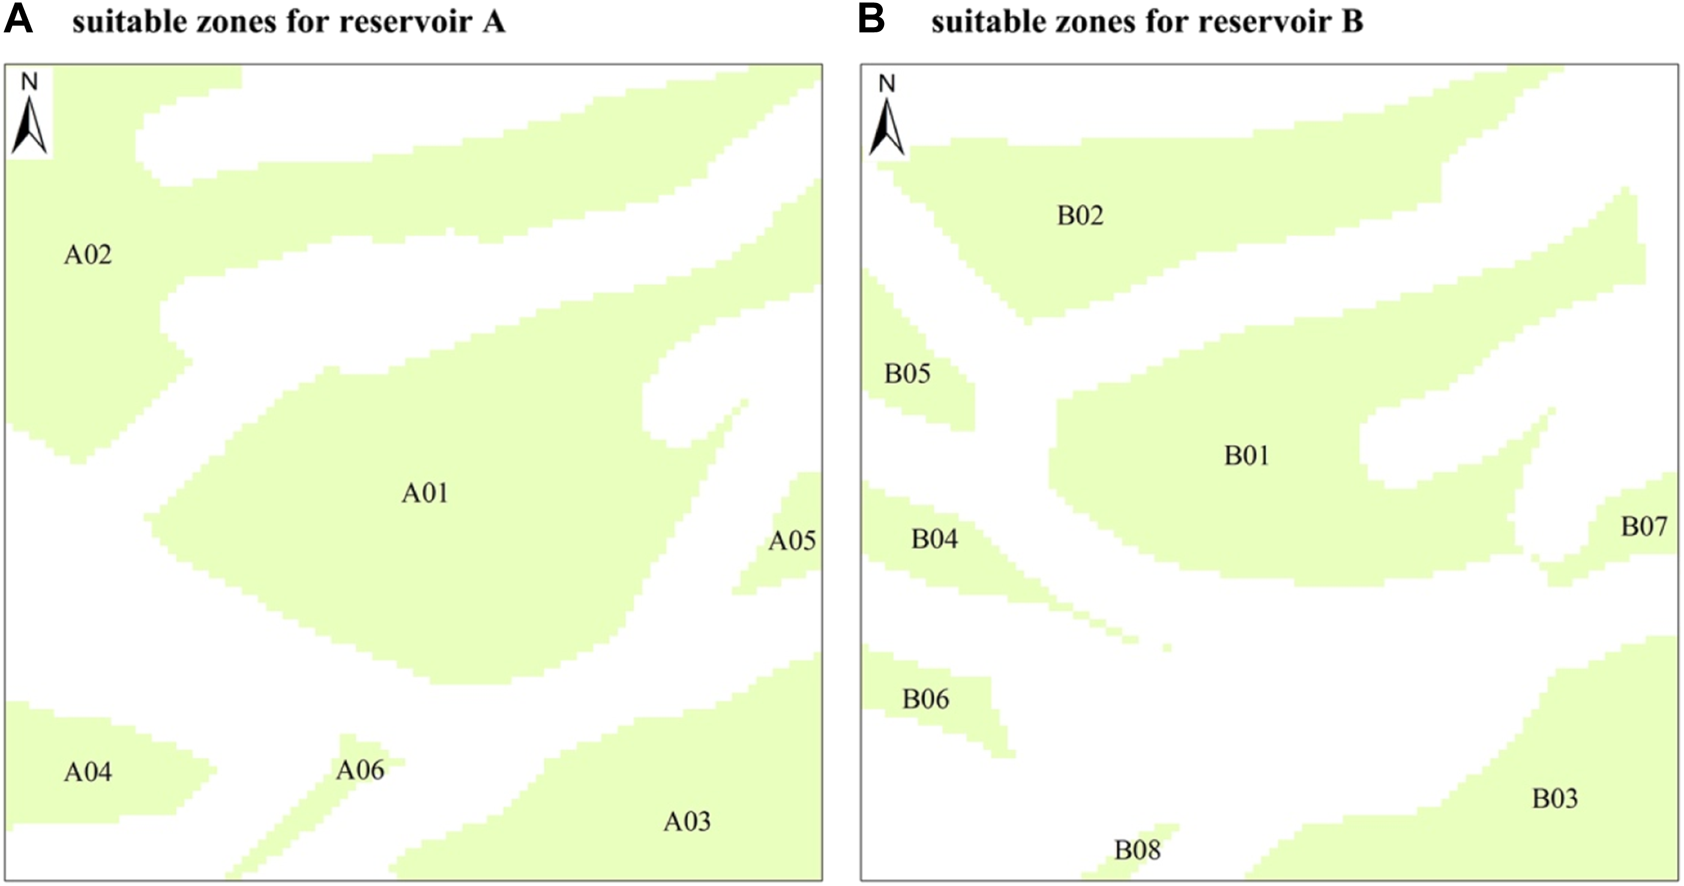
(3) Area of the containment safety
FIGURE 14
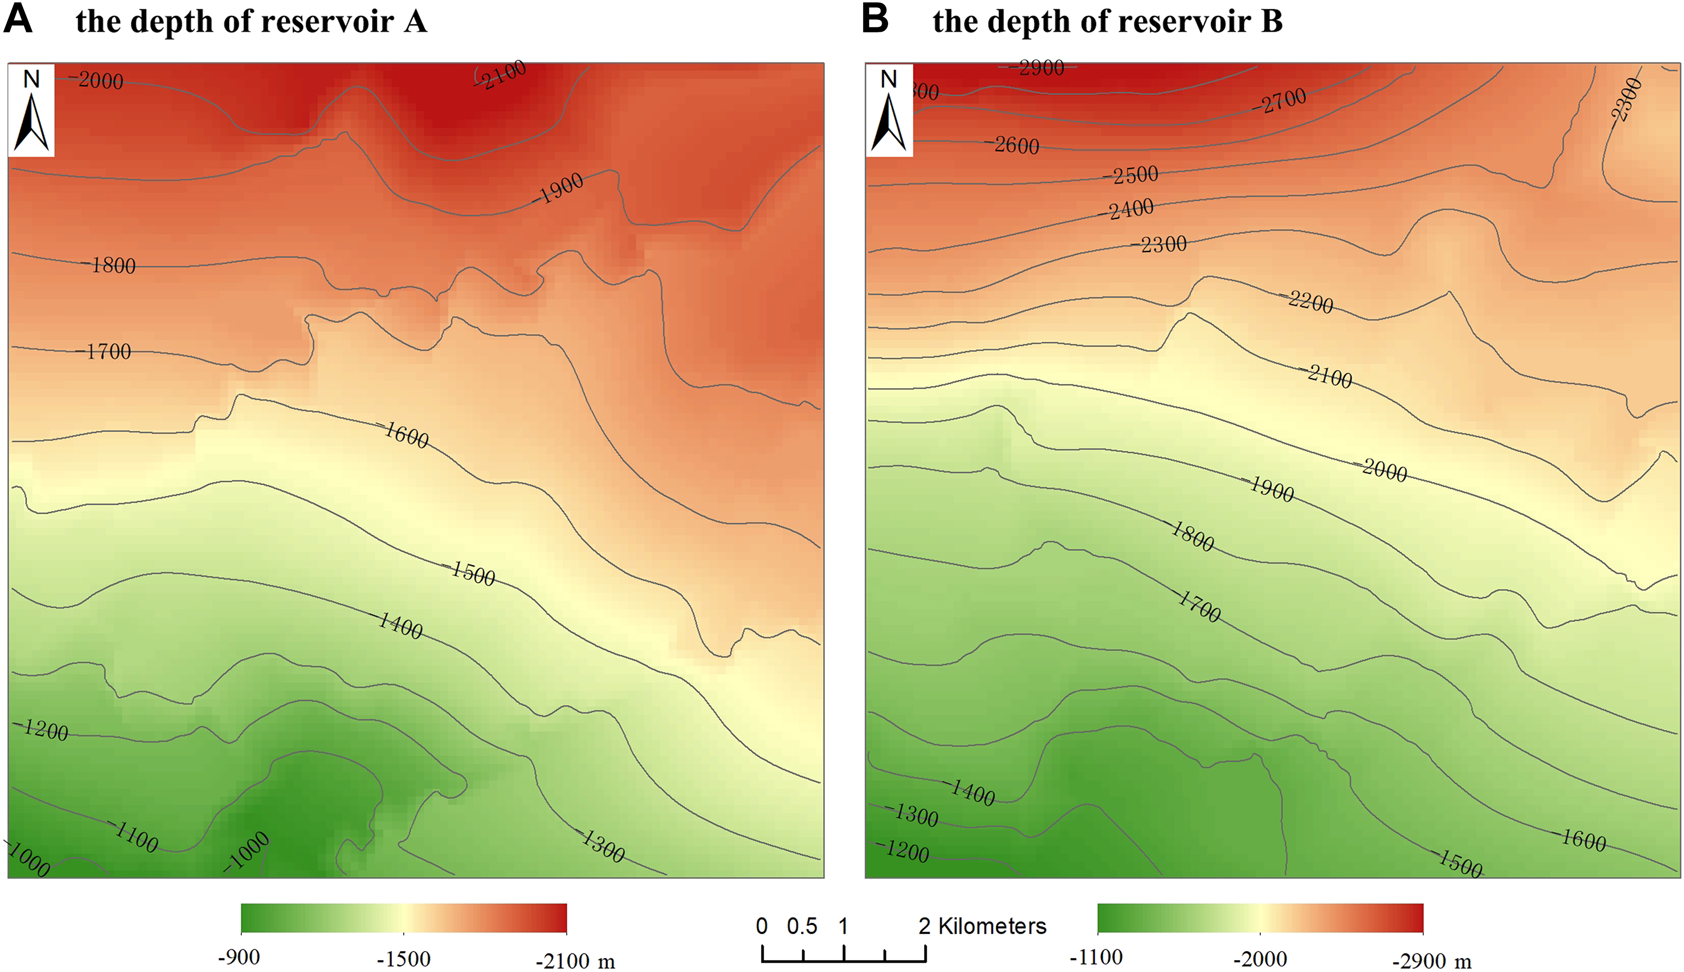
Depth maps of reservoirs.
According to Figures 13, 14, the suitable areas of CO2 storage have been divided into several zones, as shown in Figure 15. Reservoir A was divided into six suitable zones with a total area of 53.527 km2. Reservoir B was divided into eight suitable zones with a total area of 41.129 km2.
FIGURE 15

Suitable zone for reservoir A and B.
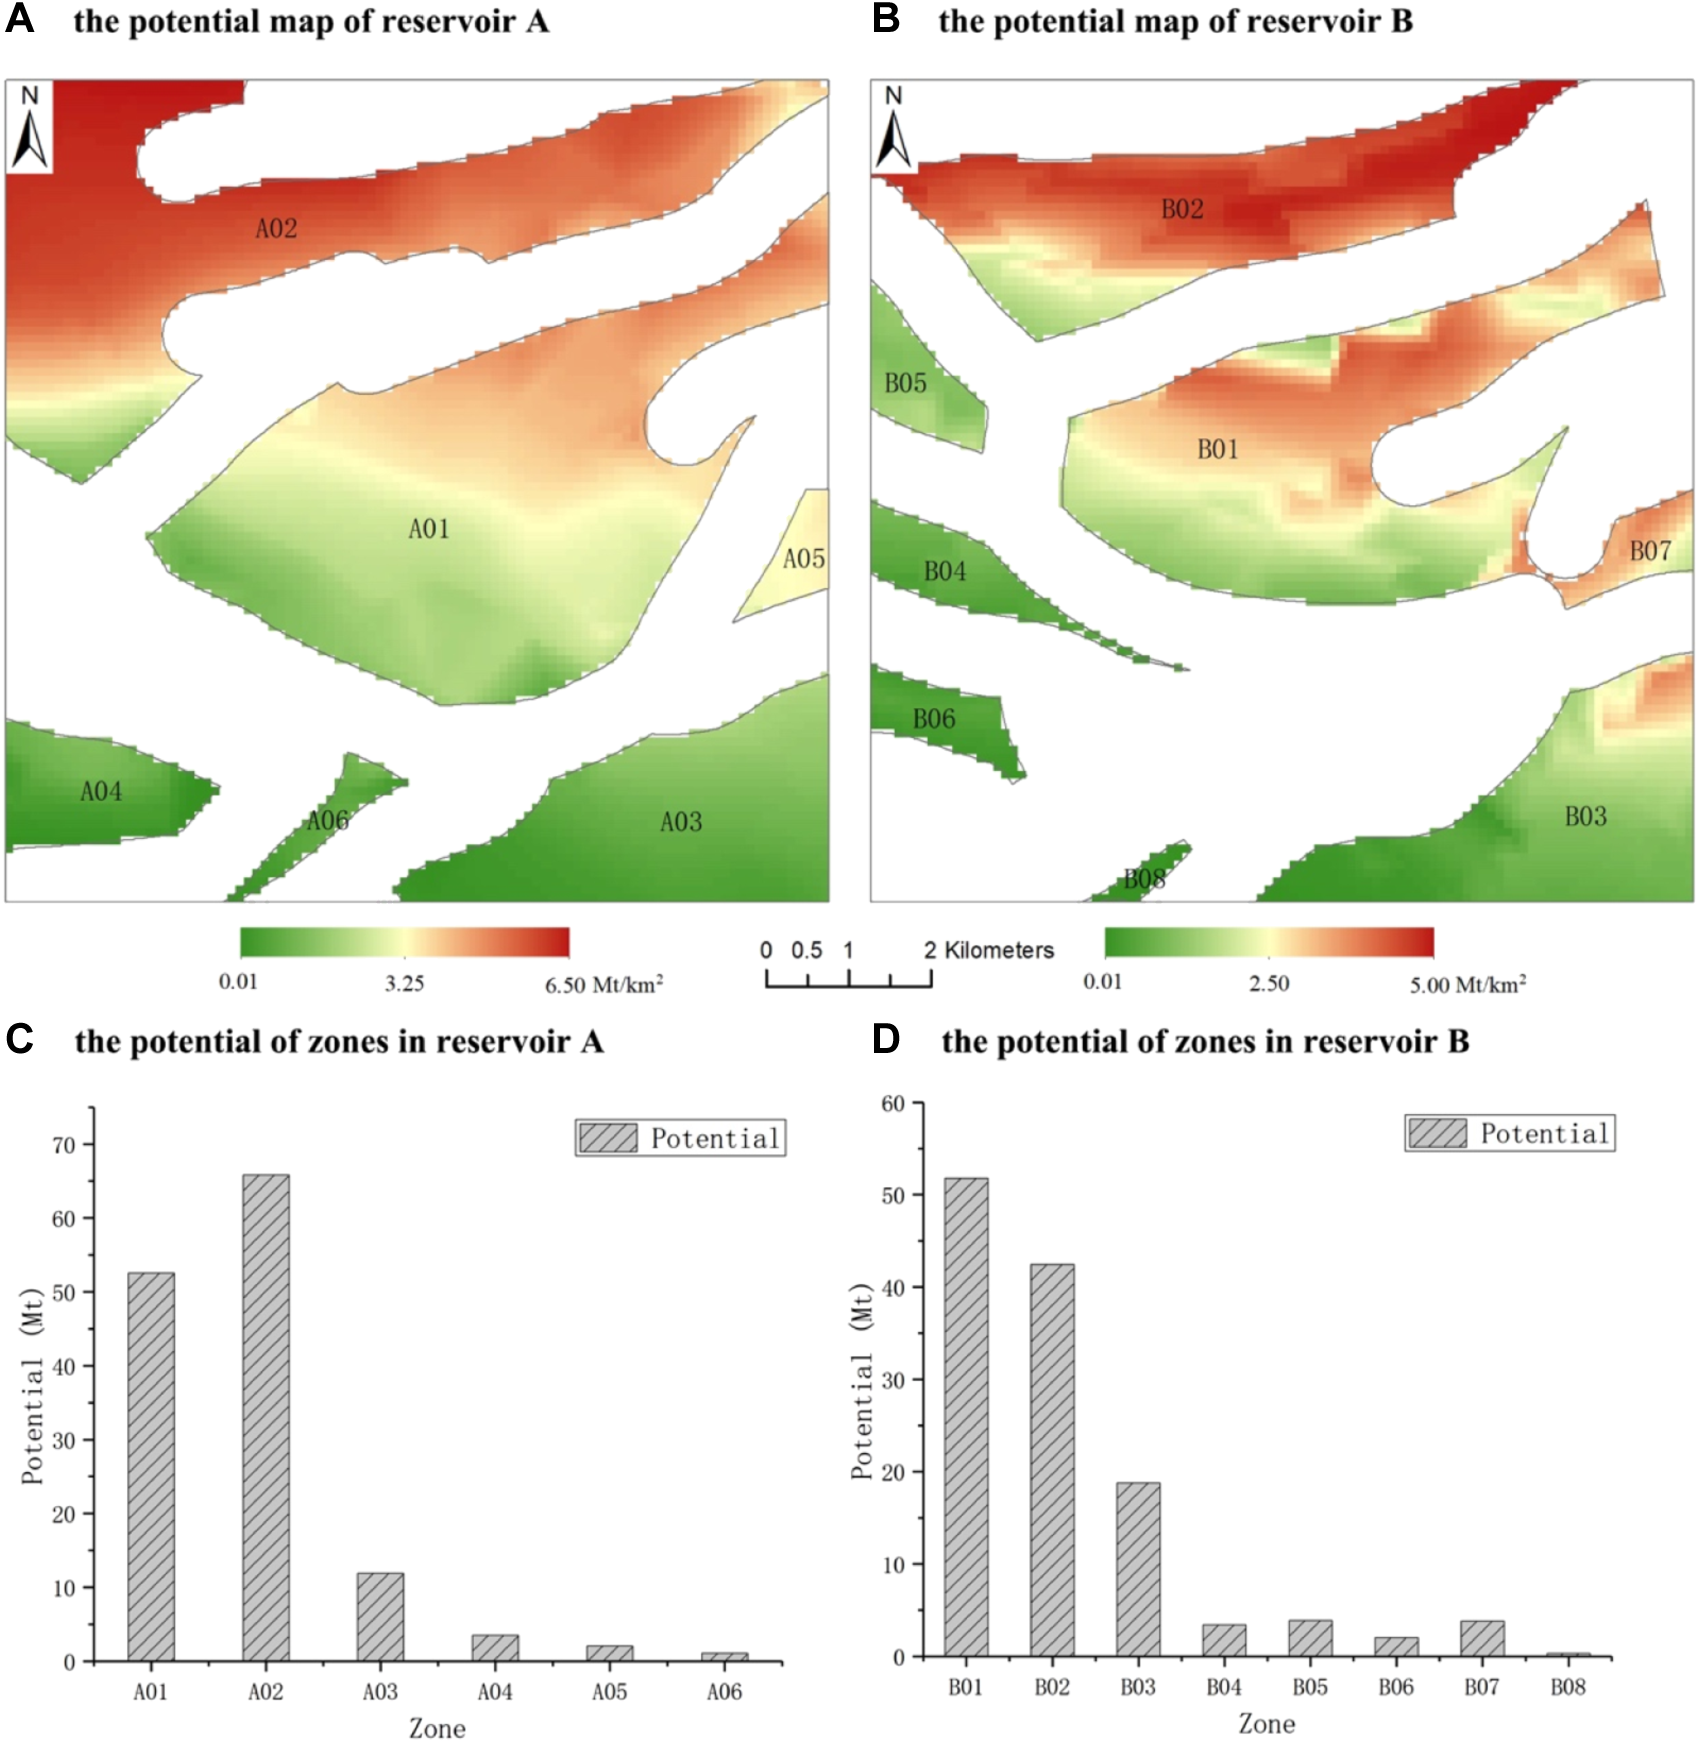
Results of the potential evaluation
The potential results for reservoir A and reservoir B are evaluated using the CO2 geological storage potential evaluation model, as shown in Figure 16 and Table 4. Reservoirs A and B have total CO2 geological storage potentials of 69.629–224.608 Mt and 64.295–207.399 Mt, respectively, with average potentials of 137.011 Mt and 126.514 Mt. As shown in Figure 16, the potential of CO2 geological storage is mainly distributed in the north of the study area. By comparing Figures 9, 10, 15, it can be found that the potential of CO2 geological storage is correlated with the thickness and burial depth of the reservoir, and the faults in Figure 13 divide the target area into several zones. As shown in Table 4, reservoir A is divided into six zones with the average potential ranging from 1.104–65.835 Mt and the average potential per unit ranging from 1.356–3.665 Mt/km2. Zone A1 and A2 are the main potential zones, with the potential of CO2 geological storage greater than 10 Mt and the average potential per unit greater than 2 Mt/km2, which have a good prospect for CO2 geological storage. Reservoir B is divided into eight zones, as indicated in Table 5, with average potentials ranging from 0.328 to 51.787 Mt and average potentials per unit ranging from 1.043 to 3.844 Mt/km2. Zone B1, B2 and B3 are the main potential zones, with the potential of CO2 geological storage greater than 10 Mt and the average potential per unit greater than 2 Mt/km2, which also have good prospects for CO2 geological storage.
TABLE 4
| Zone | Min potential (Mt) | Avarage potential (Mt) | Max potential (Mt) | Storage area (km2) | Average potential per km2 (Mt/km2)< |
|---|---|---|---|---|---|
| A01 | 26.709 | 52.557 | 86.159 | 22.626 | 2.323 |
| A02 | 33.457 | 65.835 | 107.926 | 17.962 | 3.665 |
| A03 | 6.059 | 11.922 | 19.544 | 8.463 | 1.409 |
| A04 | 1.786 | 3.514 | 5.761 | 2.797 | 1.256 |
| A05 | 1.057 | 2.079 | 3.408 | 0.865 | 2.403 |
| A06 | 0.561 | 1.104 | 1.810 | 0.814 | 1.356 |
| Total A | 69.629 | 137.011 | 224.608 | 53.527 | 2.560 |
CO2 geological storage potential of reservoir A
FIGURE 16
CO2 geological storage potential maps of reservoirs.
TABLE 5
| Zone | Min potential (Mt) | Avarage potential (Mt) | Max potential (Mt) | Storage area (km2) | Average potential per km2 |
|---|---|---|---|---|---|
| B01 | 26.318 | 51.787 | 84.896 | 15.945 | 3.248 |
| B02 | 21.573 | 42.449 | 69.589 | 11.044 | 3.844 |
| B03 | 9.555 | 18.803 | 30.824 | 8.078 | 2.328 |
| B04 | 1.746 | 3.436 | 5.633 | 1.828 | 1.879 |
| B05 | 1.974 | 3.884 | 6.367 | 1.495 | 2.597 |
| B06 | 1.024 | 2.014 | 3.302 | 1.308 | 1.540 |
| B07 | 1.938 | 3.813 | 6.250 | 1.116 | 3.417 |
| B08 | 0.167 | 0.328 | 0.538 | 0.315 | 1.043 |
| Total B | 64.295 | 126.514 | 207.399 | 41.129 | 3.076 |
CO2 geological storage potential of reservoir B.
We considered three probabilities (P10, P50, and P90) for each reservoir to determine the geological storage efficiency factor in both areas.
Discussion
To evaluate the accuracy and reliability of the results, a numerical simulation experiment was carried out for comparison. We chose the A01 zone as the simulation object, which has detailed borehole data from the existing oil exploration reports. According to the borehole logging data, the thickness of the target formation ranges from 300 to 400 m, the formation temperature is stable at 94.31°C, and the formation pressure ranges from 11.567 to 22.151 MPa. To simplify the calculation, the formation is divided into 30 layers for simulation, and the effective porosity and permeability of a single layer are assigned with reference to the average porosity and permeability data of the corresponding layer of the borehole. The effective porosity and permeability of the formation considers the ratio of net sand to gross interval of the formation. The assigned values of porosity and permeability parameters for each layer are shown in Table 6.
TABLE 6
| Layer | Porosity (%) | Permeability (mD) | Layer | Porosity (%) | Permeability (mD) | ||
|---|---|---|---|---|---|---|---|
| XY | Z | XY | Z | ||||
| 1 | 2.75 | 0.13 | 0.01 | 16 | 10.30 | 17.90 | 1.79 |
| 2 | 7.38 | 1.34 | 0.13 | 17 | 4.50 | 4.84 | 0.48 |
| 3 | 15.50 | 4.74 | 0.47 | 18 | 0.50 | 0.20 | 0.02 |
| 4 | 6.70 | 1.26 | 0.13 | 19 | 0.50 | 0.20 | 0.02 |
| 5 | 2.35 | 7.71 | 0.77 | 20 | 9.20 | 15.75 | 1.58 |
| 6 | 7.70 | 63.90 | 6.39 | 21 | 8.30 | 18.15 | 1.82 |
| 7 | 10.20 | 219.70 | 21.97 | 22 | 1.64 | 0.27 | 0.03 |
| 8 | 3.27 | 9.35 | 0.94 | 23 | 5.04 | 3.00 | 0.30 |
| 9 | 6.04 | 9.60 | 0.96 | 24 | 3.92 | 5.17 | 0.52 |
| 10 | 3.30 | 10.70 | 1.07 | 25 | 2.20 | 3.47 | 0.35 |
| 11 | 4.80 | 15.20 | 1.52 | 26 | 4.10 | 21.30 | 2.13 |
| 12 | 5.10 | 7.65 | 0.77 | 27 | 1.25 | 0.59 | 0.06 |
| 13 | 8.09 | 13.40 | 1.34 | 28 | 6.80 | 12.40 | 1.24 |
| 14 | 2.90 | 1.31 | 0.13 | 29 | 1.60 | 4.24 | 0.42 |
| 15 | 4.06 | 5.63 | 0.56 | 30 | 1.20 | 0.61 | 0.06 |
The effective porosity and permeability parameters of layers.
The numerical simulation experiment adopts TOUGH2 software ECO2N module for simulation analysis. TOUGH2 series software is a general simulation software developed by Lawrence Berkeley Laboratory, USA, to solve the groundwater and heat transport in unsaturated zone (Pruess, 1991). ECO2N is a fluid property module for the TOUGH2 simulator (Version 2.0) that was designed for applications to geologic sequestration of CO2 in saline aquifers. The CO2 injection time is set to 30 years and the stable operation time is 70 years, for a total of 100 years of simulated operation. The calculation method employed two factors as constraints on the ending of CO2 injection, the annual injection rate () and the location of the spatial distribution of CO2 at the 100-year moment. It assumes that the total amount of CO2 injected is the maximum potential when the spatial distribution of CO2 reaches the fault boundary at the 100-year moment. The annual injection rate ranges from 100 to 200 Mt. Through the numerical simulation experiments of CO2 injection, we observe the location of the spatial distribution of CO2 at the 100-year moment is close to the fault boundary when the annual injection rate is about 160 Mt, as shown in Figure 17. Therefore, the total amount of CO2 injected is the CO2 storage potential and is 48.249 Mt from the TOUGH2 simulator.
FIGURE 17
The location of the spatial distribution of CO2 at the 100-year moment ().
According to the numerical simulation results, the geological storage potential of CO2 in target area A01 is 48.249 Mt. While the expected value of storage potential (p = 50%) using the GIS-based approach in this paper is 52.557 Mt. The error of storage potential is 4.308 Mt, and the error accuracy is 8.20%. In general, the evaluation results of the CO2 geological storage potential model in this paper are larger than the numerical simulation validation results, but the error precision is still within acceptable limits for engineering applications.
Conclusion
In order to assess the geological storage potential of CO
2in deep saline aquifers at the target scale, the construction method and process of a GIS-based model are proposed in this study. An evaluation model for the geological storage potential of CO
2in the deep saline aquifer is constructed, and the results are compared with the numerical simulation results for verification, using a target area in the south of China as an example.
(1) An accurate, effective, and reliable method is proposed for the evaluation of CO2 geological storage potential in saline aquifers at the target scale, taking into account geological uncertainties and containment safety.
(2) The empirical Bayesian kriging interpolation method, the nonlinear fitting equation for CO2 density, and an automatic evaluation model of CO2 geological storage potential in deep saline aquifers at the target scale, combined with Model Builder visualization modeling technology, were proposed, to address the issues of spatial uncertainty, inconsistent structure, and inadequate accuracy of evaluation data.
(3) A database for evaluating the CO2 potential of the deep saline aquifers was constructed using the target area of the sedimentary basin in China as an example. The results of a comprehensive evaluation model used to determine the geological storage potential of CO2 in the deep saline aquifers indicated that the storage potential was 52.557 Mt. The results were also compared with the numerical simulation results of the reservoir in zone A01. The evaluation results were relatively accurate with an overall error precision of 8.20%.
Statements
Data availability statement
The original contributions presented in the study are included in the article/Supplementary Material, further inquiries can be directed to the corresponding authors.
Author contributions
TJ: Conceptualization, Data curation, Project administration, Funding acquisition. JF: Conceptualization, Methodology, writing-original draft, Formal analysis. JZ: Conceptualization, Supervision. XM: Conceptualization, Formal analysis, Writing-review and editing. YD: Conceptualization, Methodology, Writing-review and editing. TL: Data curation. LF: Methodology, Writing-review and editing. JG: Writing-review and editing.
Funding
This work is supported by the China Huaneng Group science and technology projects (No. HNKJ21-H51, HNKJ22-H10 and HNKJ21-H67), China Huaneng Group High-level Talents Programme (Research on Spatial Distribution and Control Technology of Methane in Yunnan Diandong Mining Area) and National Key Research and Development Program (Project No. 2019YFE0100100), and China geological survey project (No. DD20221818).
Acknowledgments
We’d like to thank the editors and reviewers for their helpful remarks.
Conflict of interest
The authors declare that the research was conducted in the absence of any commercial or financial relationships that could be construed as a potential conflict of interest.
Publisher’s note
All claims expressed in this article are solely those of the authors and do not necessarily represent those of their affiliated organizations, or those of the publisher, the editors and the reviewers. Any product that may be evaluated in this article, or claim that may be made by its manufacturer, is not guaranteed or endorsed by the publisher.
Supplementary material
The Supplementary Material for this article can be found online at: https://www.frontiersin.org/articles/10.3389/fenrg.2022.957014/full#supplementary-material
References
1
AbuovY.SeisenbayevN.LeeW. (2020). CO2 storage potential in sedimentary basins of Kazakhstan. Int. J. Greenh. Gas Control103, 103186. 10.1016/j.ijggc.2020.103186
2
ACCA and CHEGS (2012). A study of site selection guidelines for geological storage of CO2 in China. Beijing: Geology press.
3
AminuM. D.NabaviS. A.RochelleC. A.ManovicV. (2017). A review of developments in carbon dioxide storage. Appl. Energy208, 1389–1419. 10.1016/j.apenergy.2017.09.015
4
AnwarM. N.FayyazA.SohailN. F.KhokharM. F.BaqarM.KhanW. D.et al (2018). CO2 capture and storage: A way forward for sustainable environment. J. Environ. Manag.226, 131–144. 10.1016/j.jenvman.2018.08.009
5
BachuS.AdamsJ. J. (2003). Sequestration of CO2 in geological media in response to climate change: Capacity of deep saline aquifers to sequester CO2 in solution. Energy Convers. Manag.44, 3151–3175. 10.1016/s0196-8904(03)00101-8
6
BachuS.BonijolyD.BradshawJ.BurrussR.ChristensenN. P.HollowayS.et al (2007). “Estimation of CO2 Storage Capacity in Geological Media - Phase 2 - Work under the auspices of the Carbon Sequestration Leadership Forum (CSLF),” in Final report from the task force for review and identification of standards for CO2 storage capacity estimation (Washington, DC: Carbon Sequestration Leadership Forum). Available at: www.cslforum.org
7
BachuS. (2015). Review of CO2 storage efficiency in deep saline aquifers. Int. J. Greenh. Gas Control40, 188–202. 10.1016/j.ijggc.2015.01.007
8
BigiS.BattagliaM.AlemanniA.LombardiS.CampanaA.BorisovaE.et al (2013). CO2 flow through a fractured rock volume: Insights from field data, 3D fractures representation and fluid flow modeling. Int. J. Greenh. Gas Control18, 183–199. 10.1016/j.ijggc.2013.07.011
9
BuF.XuT.WangF.YangZ.TianH. (2016). Influence of highly permeable faults within a low-porosity and low- permeability reservoir on migration and storage of injected CO2. Geofluids16, 769–781. 10.1111/gfl.12185
10
CaoC.LiuH.HouZ.MehmoodF.LiaoJ.FengW. (2020). A review of CO2 storage in view of safety and cost-effectiveness. Energies13, 600. 10.3390/en13030600
11
ChenZ.ZhouF.RahmanS. S. (2014). Effect of cap rock thickness and permeability on geological storage of CO2: Laboratory test and numerical simulation. Energy Explor. Exploitation32, 943–964. 10.1260/0144-5987.32.6.943
12
DornerR. W.HardyD. R.WilliamsF. W.WillauerH. D. (2010). Heterogeneous catalytic CO2 conversion to value-added hydrocarbons. Energy Environ. Sci.3, 884–890. 10.1039/c001514h
13
EleniusM.SkurtveitE.YarushinaV.BaigI.SundalA.WangenM.et al (2018). Assessment of CO2 storage capacity based on sparse data: Skade Formation. Int. J. Greenh. Gas Control79, 252–271. 10.1016/j.ijggc.2018.09.004
14
FanJ. L.ShenS.WeiS.-J.XuM.ZhangX. (2020). Near-term CO2 storage potential for coal-fired power plants in China: A county-level source-sink matching assessment. Appl. Energy279, 115878. 10.1016/j.apenergy.2020.115878
15
FinzgarN.JezE.VoglarD.LestanD. (2014). Spatial distribution of metal contamination before and after remediation in the Meza Valley, Slovenia. Geoderma217-218, 135–143. 10.1016/j.geoderma.2013.11.011
16
GilmoreK. A.NeufeldJ. A.BickleM. J. (2020). CO2 dissolution trapping rates in heterogeneous porous media. Geophys. Res. Lett.47, e2020GL087001. 10.1029/2020gl087001
17
GoodmanA.HakalaA.BromhalG.DeelD.RodostaT.FraileyS.et al (2011). US DOE methodology for the development of geologic storage potential for carbon dioxide at the national and regional scale. Int. J. Greenh. Gas Control5, 952–965. 10.1016/j.ijggc.2011.03.010
18
GoudarziA.MeckelT. A.HosseiniS. A.TrevinoR. H. (2019). Statistical analysis of historic hydrocarbon production data from Gulf of Mexico oil and gas fields and application to dynamic capacity assessment in CO2 storage. Int. J. Greenh. Gas Control80, 96–102. 10.1016/j.ijggc.2018.11.014
19
GuoJ.WenD.ZhangS.JiaX.JinX. (2014). The atlas of carbon dioxide geological storage potential and suitability assessments of China major sedimentary basins. Beijing: Geology Press.
20
GuoJ.WenD.ZhangS.XuT.LiX.DiaoY.et al (2015). Potential and suitability evaluation of CO2 geological storage in major sedimentary basins of China, and the demonstration project in ordos basin. Acta Geol. Sin. - Engl. Ed.89, 1319–1332. 10.1111/1755-6724.12531
21
HicksN.GreenA. (2017). A first assessment of potential stratigraphic traps for geological storage of CO2 in the Durban Basin, South Africa. Int. J. Greenh. Gas Control64, 73–86. 10.1016/j.ijggc.2017.06.015
22
KabirzadehH.KimJ. W.SiderisM. G.VatankhahS. (2020). Analysis of surface gravity and ground deformation responses of geological CO2 reservoirs to variations in CO2 mass and density and reservoir depth and size. Environ. Earth Sci.79, 163. 10.1007/s12665-020-08902-x
23
KrivoruchkoK.GribovA. (2019). Evaluation of empirical Bayesian kriging. Spat. Stat.32, 100368. 10.1016/j.spasta.2019.100368
24
LiP.ZhouD.ZhangC.ChenG. (2015). Assessment of the effective CO2 storage capacity in the Beibuwan Basin, offshore of southwestern P. R. China. Int. J. Greenh. Gas Control37, 325–339. 10.1016/j.ijggc.2015.03.033
25
LiY.HernandezJ. H.AvilesM.KnappettP. S. K.GiardinoJ. R.MirandaR.et al (2020). Empirical Bayesian Kriging method to evaluate inter-annual water-table evolution in the Cuenca Alta del Río Laja aquifer, Guanajuato, México. J. Hydrology582, 124517. 10.1016/j.jhydrol.2019.124517
26
LingF. T.PlattenbergerD. A.PetersC. A.ClarensA. F. (2021). Sealing porous media through calcium silicate reactions with CO2 to enhance the security of geologic carbon sequestration. Environ. Eng. Sci.38, 127–142. 10.1089/ees.2020.0369
27
LvP.LiuY.YangW. (2020). Investigation on CO2 permeation in water-saturated porous media with disordered pore sizes. Exp. Therm. Fluid Sci.119, 110207. 10.1016/j.expthermflusci.2020.110207
28
MartinezC.HancockG. R.KalmaJ. D.WellsT.BolandL. (2010). An assessment of digital elevation models and their ability to capture geomorphic and hydrologic properties at the catchment scale. Int. J. Remote Sens.31, 6239–6257. 10.1080/01431160903403060
29
MuraiS.FujiokaY. (2008). Challenges to the carbon dioxide capture and storage (CCS) technology. IEEJ Trans. Elec. Electron. Eng.3, 37–42. 10.1002/tee.20231
30
NomeliM. A.RiazA. (2017). A data driven model for the impact of IFT and density variations on CO2 storage capacity in geologic formations. Adv. Water Resour.107, 83–92. 10.1016/j.advwatres.2017.06.015
31
OgawaT.NakanishiS.ShidaharaT.OkumuraT.HayashiE. (2011). Saline-aquifer CO2 sequestration in Japan-methodology of storage capacity assessment. Int. J. Greenh. Gas Control5, 318–326. 10.1016/j.ijggc.2010.09.009
32
OldenburgC. M. (2008). Screening and ranking framework for geologic CO2 storage site selection on the basis of health, safety, and environmental risk. Environ. Geol.54, 1687–1694. 10.1007/s00254-007-0947-8
33
PopovaO. H.SmallM. J.MccoyS. T.ThomasA. C.RoseS.KarimiB.et al (2014). Spatial stochastic modeling of sedimentary formations to assess CO2 storage potential. Environ. Sci. Technol.48, 6247–6255. 10.1021/es501931r
34
PruessK. (1991). TOUGH2: A general-purpose numerical simulator for multiphase fluid and heat flow. United States: Earth Sciences Division.
35
RanathungaA. S.PereraM. S. A.RanjithP. G. (2014). Deep coal seams as a greener energy source: A review. J. Geophys. Eng.11, 063001. 10.1088/1742-2132/11/6/063001
36
RasheedZ.RazaA.GholamiR.RabieiM.IsmailA.RasouliV. (2020). A numerical study to assess the effect of heterogeneity on CO2 storage potential of saline aquifers. Energy Geosci.1, 20–27. 10.1016/j.engeos.2020.03.002
37
RazaA.GholamiR.SarmadivalehM.TaromN.RezaeeR.BingC. H.et al (2016). Integrity analysis of CO2 storage sites concerning geochemical-geomechanical interactions in saline aquifers. J. Nat. Gas Sci. Eng.36, 224–240. 10.1016/j.jngse.2016.10.016
38
ShenP.LiaoX.LiuQ. (2009). Methodology for estimation of CO2 storage capacity in reservoirs. Petroleum Explor. Dev.36, 216–220. 10.1016/s1876-3804(09)60121-x
39
TanR. R.AvisoK. B.JanairoJ. I. B.PromentillaM. A. B. (2020). A hyperbox classifier model for identifying secure carbon dioxide reservoirs. J. Clean. Prod.272, 122181. 10.1016/j.jclepro.2020.122181
40
VijayavenkataramanS.IniyanS.GoicR. (2012). A review of climate change, mitigation and adaptation. Renew. Sustain. Energy Rev.16, 878–897. 10.1016/j.rser.2011.09.009
41
WangS. (2019). Research on characteristics of the low permeability reservoirs of the liushagang formation in fushan sag. Northeast Petroleum University. 10.26995/d.cnki.gdqsc.2019.000573
42
XieJ.ZhangK.HuL.PavelicP.WangY.ChenM. (2015). Field-based simulation of a demonstration site for carbon dioxide sequestration in low-permeability saline aquifers in the Ordos Basin, China. Hydrogeol. J.23, 1465–1480. 10.1007/s10040-015-1267-9
43
YuanL.ZhangY.ZhaoJ.SongY.ChiY. (2020). Molecular simulation of equal density temperature in CCS under geological sequestration conditions. Greenh. Gas. Sci. Technol.10, 90–102. 10.1002/ghg.1929
44
ZhangH.WenD.LiY.LuJ. (2005). Conditions for CO2 geological sequestration in China and some suggestions. Regional Geol. China12, 1107–1110. 10.3969/j.issn.1671-2552.2005.12.004
45
ZhangJ.FengQ.ZhangX.ShuC.WangS.WuK. (2020). A supervised learning approach for accurate modeling of CO2-brine interfacial tension with application in identifying the optimum sequestration depth in saline aquifers. Energy fuels.34, 7353–7362. 10.1021/acs.energyfuels.0c00846
46
ZhongZ.CarrT. R. (2019). Geostatistical 3D geological model construction to estimate the capacity of commercial scale injection and storage of CO2 in Jacksonburg-Stringtown oil field, West Virginia, USA. Int. J. Greenh. Gas Control80, 61–75. 10.1016/j.ijggc.2018.10.011
Summary
Keywords
CO2 geological storage, deep saline aquifer, potential evaluation, automatic model, geographic information system (GIS)
Citation
Jing T, Fu J, Zhou J, Ma X, Diao Y, Liu T, Fu L and Guo J (2022) An automatic modeling approach for the potential evaluation of CO2 geological storage in the deep saline aquifer. Front. Energy Res. 10:957014. doi: 10.3389/fenrg.2022.957014
Received
04 June 2022
Accepted
19 August 2022
Published
16 September 2022
Volume
10 - 2022
Edited by
Myeongsub Kim, Florida Atlantic University, United States
Reviewed by
Watheq J. Al-Mudhafar, Basrah Oil Company, Iraq
Zhaoyang Kong, Beijing University of International Business and Economics, China
Jie Ren, Hohai University, China
Updates
Copyright
© 2022 Jing, Fu, Zhou, Ma, Diao, Liu, Fu and Guo.
This is an open-access article distributed under the terms of the Creative Commons Attribution License (CC BY). The use, distribution or reproduction in other forums is permitted, provided the original author(s) and the copyright owner(s) are credited and that the original publication in this journal is cited, in accordance with accepted academic practice. No use, distribution or reproduction is permitted which does not comply with these terms.
*Correspondence: Jie Fu, fujie@mail.cgs.gov.cn, Xin Ma, maxin@mail.cgs.gov.cn
This article was submitted to Carbon Capture, Utilization and Storage, a section of the journal Frontiers in Energy Research
Disclaimer
All claims expressed in this article are solely those of the authors and do not necessarily represent those of their affiliated organizations, or those of the publisher, the editors and the reviewers. Any product that may be evaluated in this article or claim that may be made by its manufacturer is not guaranteed or endorsed by the publisher.