 Xiping Ma
 Yan Liang
 Kaiyan Wang1
94% of researchers rate our articles as excellent or good
Learn more about the work of our research integrity team to safeguard the quality of each article we publish.
Find out more
ORIGINAL RESEARCH article
Front. Energy Res., 04 August 2022
Sec. Smart Grids
Volume 10 - 2022 | https://doi.org/10.3389/fenrg.2022.953573
This article is part of the Research TopicAdvanced Data-Driven Methods and Applications for Smart Power and Energy SystemsView all 31 articles
Faced with the problem of fossil energy depletion and the power industry’s low-carbon requirements, low-carbon technologies in collaboration with market mechanisms, supplemented by flexible resources, are critical to achieving the low-carbon operation of integrated energy systems (IES). This paper establishes an IES considering multiple types of low-carbon factors and demand response. Firstly, the IES is deemed to participate in the carbon trading market and introduce a ladder-type carbon trading mechanism at the low-carbon policy level. Then, at the low-carbon technology level, carbon capture power plants and power-to-gas equipment are introduced to refine the modeling of the power-to-gas process. Secondly, the integrated energy system includes pluralistic energy storage technology and demand response to increase the IES’s flexibility. Based on multiple types of low carbon factors and demand response mechanisms, the scheduling model for energy efficiency improvement is constructed with the lowest sum of the cost of wind abandonment penalty, the cost of purchasing energy, the cost of equipment operation and maintenance, and the cost of carbon trading as the optimization objective, and solved by a two-stage optimization method. Five energy efficiency indicators are presented to efficiently evaluate dispatching results: wind power consumption rate, carbon trading cost, actual carbon emissions, total cost, and load fluctuation. Finally, according to an arithmetic test system based on various operation scenarios, the proposed model may increase the IES’s comprehensive energy efficiency under the coupling effect of multiple types of low-carbon factors and demand response.
Modern energy systems have been transforming into clean, low-carbon systems. Integrated energy systems with electricity-gas-thermal coupling as the core effectively promote renewable energy consumption and improve energy efficiency (Zhang et al., 2020; Wang et al., 2022). As the permeability of distributed generation (DG) increases, flexible resources such as energy storage and controllable load in IESs begin to assume the function of reducing carbon emissions while participating in regulation. However, the accessibility of various resources also makes IESs’ operations more complex. (Hong et al., 2018; Liu et al., 2019).
Wind power and other new energy generators with low marginal costs and no carbon emissions are gradually transitioning from alternative to dominant power sources. However, the volatility and randomness of wind power output will lead to wind abandonment and increase the backup capacity assumed by thermal power units, resulting in continued high carbon emissions (Rong et al., 2019; Chen J et al., 2021). The emergence and implementation of carbon capture and storage technology has alleviated this contradiction with the development of low-carbon technologies. Carbon capture units have significantly increased operational flexibility, faster climbing rate, and greater peaking capacity by converting conventional thermal power units into carbon capture units with significantly lower emission intensity (Zhang et al., 2013; Yao et al., 2018). Carbon capture units with carbon capture equipment provide ideal space for wind power consumption, reducing carbon emissions and contributing to the development of a low-carbon economy (Viebahn et al., 2015; Akbari-Dibavar et al., 2021). In (Zhou et al., 2018), the wind turbine and carbon capture are combined to form a virtual wind power-carbon power plant. The traditional single carbon volume form of CO2 volume of the capture system is improved to a double carbon volume form of CO2 volume of the regeneration and absorption tower. A two-stage low-carbon economic dispatch model is built under the virtual power plant’s standard operation mode, significantly reducing carbon emissions. The authors (Cui et al., 2021) proposed installing a flue gas bypass system and solution storage in the source-side carbon capture plant to create an integrated and flexible operation, followed by coordination with wind power. On the load side, demand response resources are used to overcome the limits of carbon capture plant operation on numerous time scales and to increase the system’s low carbon performance through coordinated optimization of resources on the source and load sides. The literature mentioned above addresses improving the carbon capture power plant’s structure. It cooperates with wind turbines and controllable loads to fully exploit the low carbon potential of the carbon capture equipment, which effectively reduces the system’s carbon emissions. However, most existing research focuses on a single low-carbon factor, which is still unable to overcome the limits of existing equipment with poor carbon capture rates and carbon sequestration methods that are both uneconomical and leaky.
Through the deep integration of electricity and gas networks, Power to Gas (P2G) provides a novel solution to handle the problem of wind abandonment and emission reduction as one of the IES’ critical supporting technologies(Aramouni et al., 2017; Xiang et al., 2021). In (Chen et al., 2017), a day-ahead economic optimal dispatch model for a multi-source energy storage microgrid system comprising P2G is constructed based on microgrid-type energy hubs. The findings demonstrate that P2G can reduce wind desertion and enhance system economy, although only the P2G process is studied, and a more refined P2G process is missing. In (Cui et al., 2020), the paper proposed a variable efficiency combined heat and power generation scheduling model, including electricity to gas, refined the P2G model, and introduced hydrogen storage in hydrogen production from water electrolysis. Through the co-generation of heat and electricity, hydrogen fuel cells can promote the high-grade use of hydrogen energy, reduce the energy cascade loss caused by direct methanation, and improve the overall energy utilization rate. In (Chen Z et al., 2021), a carbon trading mechanism was introduced to guide the IES to control carbon emissions, and the two-stage operation process of P2G was refined. Hydrogen energy was preferentially utilized in hydrogen production to reduce the loss caused by the cascade energy utilization, thus improving IES’s economy and low-carbon characteristics. In (Tian et al., 2021; Li and Yu, 2020), a low-carbon economic dispatch model of an integrated energy system considering carbon capture technology and integrated demand response is built. Still, no detailed analysis of P2G and no carbon trading mechanism have been introduced. The previous studies all focus on a single low-carbon factor, and the function of load-storage side flexibility resources in supporting the low-carbon economic operation of IESs has yet to be thoroughly investigated. In the context of low carbon, it is rare to analyze and formulate carbon trading policies and fully consider the impact of the combined effects of various low carbon factors and the joint participation of charge-storage flexible resources on improving the IES’s wind power consumption rate and reducing carbon emissions and costs.
As a result, this paper takes multiple approaches to increase the IES’s energy efficiency. The novelty of this study is as follows: 1) design a joint low-carbon operation model that considers CCSU, P2G, and the ladder-type carbon trading mechanism in an integrated energy system. 2) utilize load-storage flexibility resources and introduce multiple energy storages for the IES’s multi-energy coupling. 3) implement a demand response mechanism using the features of controllable loads. 4) presents five energy efficiency indicators to evaluate dispatching results: wind power consumption rate, carbon trading cost, actual carbon emissions, total cost, and load fluctuation.
The rest of this article is organized as follows: Section 2 introduces the IES framework, considering multiple types of low-carbon factors. The demand response mechanism is introduced in Section 3. In Section 4, the dispatch model considering multiple types of low carbon factors and demand response is presented. Section 5 studies simulated cases to investigate the effectiveness of the proposed strategy. Finally, Section 6 concludes this article.
The IES dispatching framework established in this paper is shown in Figure 1, which mainly consists of three parts: upper-level energy supply side, energy coupling, conversion side, and demand side. The upper-level grid and wind turbine (WT) directly provide electricity for the IES. The carbon capture power plant (CCPP) includes the power generator unit (PGU) and carbon capture and storage unit (CCSU), where the PGU can produce enough power to meet the electrical load and use the CCSU to capture some of its CO2 emissions. The combined heat and power (CHP) burns natural gas to meet the demand for electricity and heat at the same time. The gas boiler (GB) burns natural gas to provide heat to meet the demand for heat. The electrolyzer (EL) converts electric energy into hydrogen energy, which is further converted into natural gas by the methane reactor (MR) and can also be directly supplied to HFC for thermoelectric production of hydrogen energy, reducing the cascade consumption of energy and improving the utilization rate of energy. The upper gas network and MR provide the gas load demand. Thermal storage (TS), gas storage (GS), and hydrogen storage (HS) are included in the IES to store energy, allowing for energy time shift. The CO2 absorption or emissions associated with each facility’s operation are eventually traded on the carbon trading market.
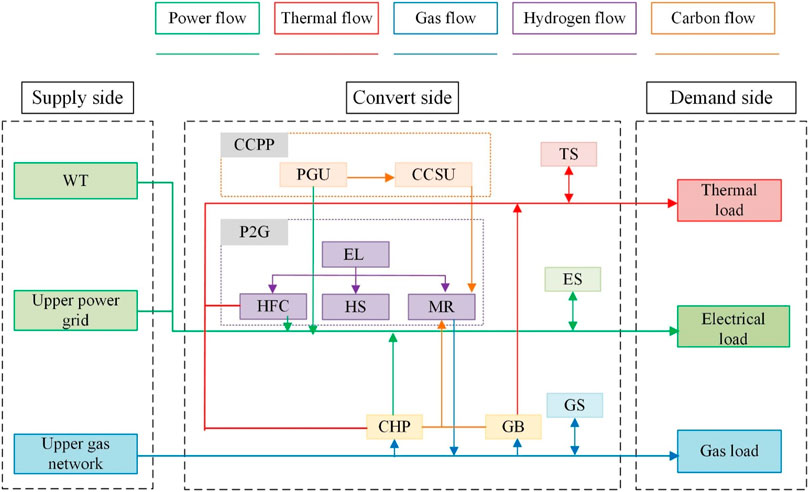
FIGURE 1. The IES dispatching framework.
The models of CHP and GB in reference (Chen J et al., 2021) are introduced, so there will be no further information provided.
The CCPP decarbonizes a traditional thermal power station that uses the CCSU to separate and enrich CO2 from fossil fuel combustion gases to mitigate the greenhouse effect. The CO2 captured is partially sequestered and partially delivered to the MR. Their mathematical models can be established as follows:
The P2G technology in the integrated energy system primarily consists of two processes: power to hydrogen and power to gas. The power to hydrogen process involves electrolyzing water in an EL to produce hydrogen and oxygen. The HFC partly uses the generated hydrogen, converted into electrical and thermal energy and partially stored in the HS. The power to hydrogen process uses the hydrogen produced in the previous cycle and the CO2 absorbed in the MR to produce methane and water under the action of a catalyst, and natural gas pipelines can transport the generated methane to the CHP and GB.
The EL is the critical piece of equipment in hydrogen production technology that uses water electrolysis from renewable energy sources to convert electrical energy into hydrogen energy. Hydrogen is produced in this paper via proton exchange electrolysis, which is mathematically modeled as follows:
The hydrogen energy transformed by the EL enters the MR and is mixed with CO2 in a particular proportion. After the catalytic exothermic reaction, the hydrogen energy is converted into methane and injected into the natural gas system, supplying the gas load, CHP, and GB to reduce the online purchase of gas from the upper gas network and reduce the energy purchase cost. Its mathematical model is as follows:
The HFC generates electricity, heat, and water via electrochemical reactions and offers good electrical and thermal qualities, allowing high-grade hydrogen energy consumption and providing clean electrical and thermal energy sources for the IES. It lowers the loss caused by stepwise energy use and improves the total energy utilization rate of the IES when compared to hydrogen first converted to natural gas and then provided to the CHP and GB, which is mathematically modeled as follows:
A part of the hydrogen produced in the EL can be temporarily stored in the HS, providing a stable and time-shiftable source of dispatchable hydrogen for the HFC and MR. Compression-storage-recompression is an example of physical processes used in the HS. Only the losses caused by the compression process are briefly described in this study by the energy storage charging and discharging efficiency, which is mathematically modeled as follows:
These three kinds of energy storage carry out reasonable charge and discharge work through the change in energy price, enhance the stability of power grid operation, realize peak cutting and valley filling, and reduce the system’s operating cost. Since the models of electric energy storage and thermal energy storage are similar to those of gas energy storage, the unified modeling of electric, thermal, and gas energy storage is as follows:
The allocation of initial carbon emission permits serves as the foundation for implementing the carbon emission trading mechanism. The baseline approach establishes the system’s free carbon emission allowances. The output of the PGU, GB, and CHP generates the majority of the IES’s carbon emissions, and their initial carbon emission allowances are as follows:
When the IES’s actual carbon emissions are fewer than the initial carbon emission allowances, the government provides some incentive allowances. Otherwise, the IES must pay a carbon trading penalty to the government. The following equation can be used to calculate the actual emissions of the IES:
In order to refine the calculation of carbon trading cost, a ladder-type calculation model of carbon trading cost is constructed. It calculates the carbon trading cost in segments according to the relationship between total carbon emissions and carbon emission allowances as follows:
Demand response (DR) means that customers adjust their energy use behavior according to tariffs or incentives and participate in grid interaction, thus optimizing the load curve and improving the system’s operational efficiency. DR is classified into two forms based on how the load can be altered in the time axis and the interaction between the different types of energy use: price-based demand response and alternate-based demand response.
Only one specific energy source can be used, and the energy source can be shifted or curtailed spontaneously according to the price signal of the energy source at different times, which is called price-based demand response (PBDR).
Multiple energy sources can be used, and energy demand can be met through energy substitution based on multiple energy prices at the same point in time, where the total energy consumption required by the user at a certain point in time is certain, but the type of energy consumed can be flexibly adjusted, called alternate-based demand response (ABDR).
PBDR formulates reasonable energy prices according to consumer psychology and then changes load and energy consumption mode. Its model for electricity and gas loads is represented in the following equation:
By analyzing the change in power prices in this period before and after the demand response, curtailable loads decide whether to curtail. The PBDR features are described using the curtailable load (CL)-type price demand elasticity matrix, where element eCL (t, j) in the tth row and jth column of the elasticity matrix ECL(t, j) reflects the elasticity coefficient of the load during the period t concerning the energy price during the period j, defined as:
where Δθ (j) indicates the amount of energy price change after the action of the PBDR; θ 0(j) shows the energy price during the period j.
Then, the change in curtailable loads during the period t after the action of the PBDR can be expressed as:
ECL(t, j) denotes the CL-type price elasticity of the demand matrix, and it is a diagonal matrix.
A shiftable load is a type of load that allows customers to adjust their working hours in response to energy prices based on their own needs. Users will spontaneously reduce load demand during higher energy prices and shift to periods of lower energy prices. The PBDR characteristics are described using the shiftable load (SL)-type price elasticity of the demand matrix and the element eSL (t, j) in the tth row and jth column of the elasticity matrix ESL(t, j) represents the elasticity coefficient of loads at the time t concerning the energy price at time j, defined as
Then, the change in shiftable loads during the period t after the action of the PBDR can be expressed as:
where ESL(t, j) denotes the SL-type price elasticity of the demand matrix, it is a diagonal matrix.
The relative relationship between the equivalent electricity and gas prices in IESs determines the ABDR. In addition to the energy cost, other factors to consider are the equipment’s utilization efficiency. Integrated energy users will use more gas and less electricity when the comparable electricity price is excellent. In contrast, they will use more electricity and less gas when the equivalent electricity price is lower.
Because the mutual substitution of electrical and gas loads in the IES satisfies the law of energy conservation, the ABDR is modeled as follows:
where
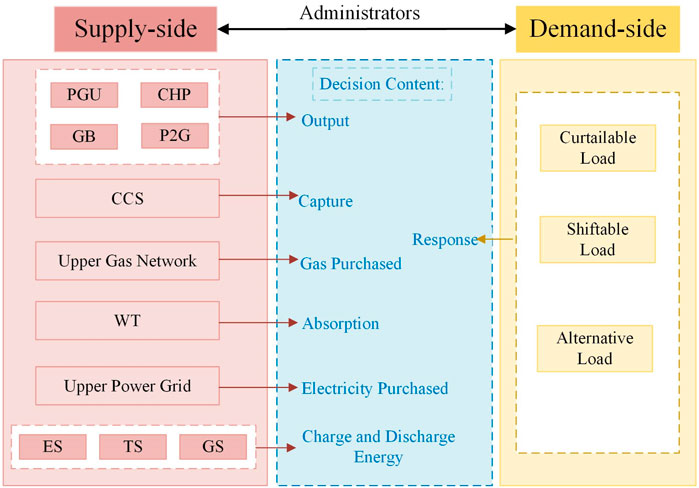
FIGURE 2. Demand response mechanism diagram.
The IES’s total cost includes the wind abandonment penalty, the cost of purchasing energy, the cost of equipment operation and maintenance, and the cost of carbon trading, so the objective function is:
1) Cost of wind abandonment penalty
2) Cost of purchasing energy
3) Cost of equipment operation and maintenance
4) Cost of carbon trading is shown in Eq. 9.
(1) Constraints on energy balance
Constraints on the energy balance satisfied by electricity, heat, gas, and hydrogen, respectively, are as follows:
(2) Constraints on equipment operation
EL: Eq. 2; MR: Eq. 3; HFC: Eq. 4;
In addition,
(3) Constraints on energy storage operation
Electrical/Thermal/Gas Storage: Eq. 6; Hydrogen Storage: Eq. 5
(4) Constraints on energy purchase
Five types of indicators are proposed to evaluate the economy and low carbon of system operation to effectively evaluate the effectiveness of the dispatching strategy: wind power consumption rate, carbon trading cost, actual carbon emission, total cost, and load fluctuation. The following are the formulas for calculating each indicator:
(1) Wind power consumption rate.
The wind power consumption rate measures the system’s ability to consume wind power. The higher the consumption rate, the easier it is to achieve the system’s clean and low-carbon functioning, and the formula is as follows:
(2) Carbon trading cost.
The carbon trading cost determines the system’s low carbon character. The higher the cost of carbon trading, the more actual carbon emissions exceed the baseline carbon emission allowances. The higher the carbon emission charge must be paid, as computed by the formula in Eq. 9.
(3) Actual carbon emissions.
The actual carbon emissions measure the quality of CO2 numerically and can more intuitively estimate the system’s carbon emission level, and the calculation formula is shown in Eq. 8.
(4) Total cost.
The total cost of operation assesses the system’s efficiency and is calculated as shown in Eq. 16.
(5) Load fluctuation.
The load fluctuation is the sum of the squares of the load difference between the previous period and that period within the dispatch cycle. It is an indicator used to measure the role of demand response, reflecting the role of demand response on load smoothing and tracking, calculated as follows:
where Je and Jg denote the electrical and gas load fluctuations, respectively.
The IES efficiency improvement scheduling model, which considers multiple types of low carbon factors and demand response, is a mixed-integer nonlinear model in this paper. The segmented linear interpolation method converts Eqs 1, 8 into segmented linear functions, with the specific linearization process shown as follows:
Step 1: According to the required accuracy, take P + 1 segment point[w1,w2,…, wQ+1], Divide the original function into P intervals.
Step 2: Add P+1 continuous auxiliary variable[a1,a2,…,aP+1] with P binary auxiliary variables[b1,b2,…,bP], and satisfy Eq. 28.
Step 3: Replace the nonlinear function with the linear expression shown in Eq. 29.
The linearized model is solved using two stages. Firstly, the demand response mathematical model is applied to find the optimized system load curve, and then the load curve and the system are combined to minimize the integrated cost as the goal. The solution is performed in the MATLAB environment using the Gurobi solver through the Yalmip toolbox, and the solving process is shown in Figure 3.
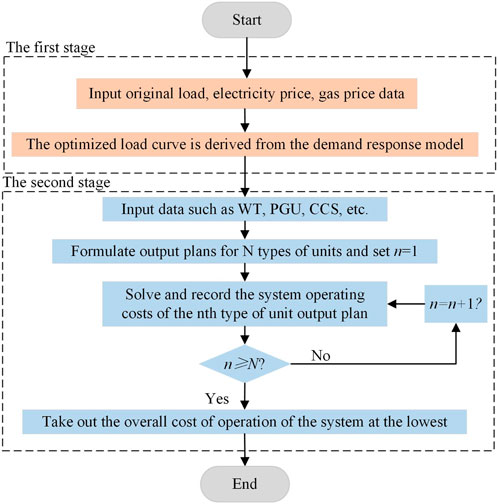
FIGURE 3. The framework of the solving method.
The structure of the algorithm test system is shown in Figure 1 in the previous section. The parameters are set as follows: the dispatch cycle is 24 h, and the unit dispatch period is 1 h. The predicted results of various types of loads and wind turbine input power within this IES are shown in Figure 4. The installed capacity and operating parameters of each piece of equipment are shown in Table 1, and the actual carbon emission model parameters are shown in Table 2.
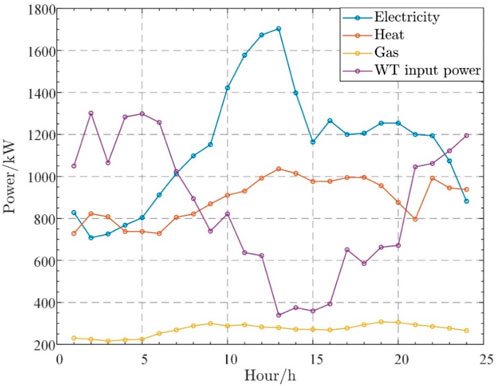
FIGURE 4. Profiles of the energy demands of the IES and the forecast WT input power.
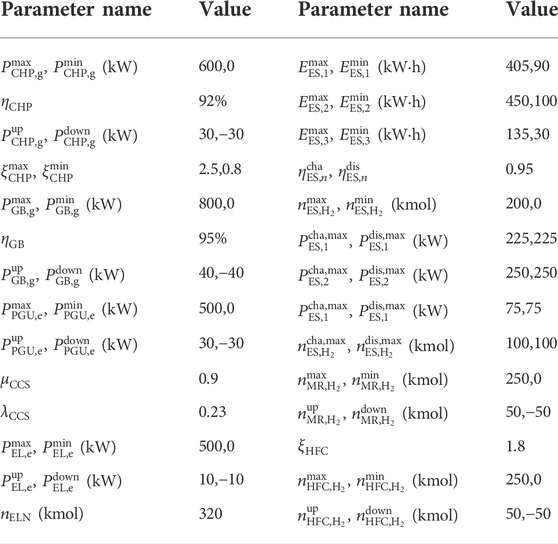
TABLE 1. Parameters of equipment.
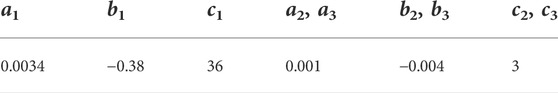
TABLE 2. Parameters of actual carbon emission model.
The unit price of purchased electricity is 0.78 RMB/(kw·h), and the unit price of purchased gas is 0.45 RMB/(kw·h). If the CCSU is not considered, MR must purchase external high purity CO2 at a unit price of 2 RMB/kg. In order to compare and analyze the improvement of the multi-energy coupling operation efficiency of the system by a multi-type low-carbon factor collaborative model, the following four scenarios are set:
Scenario 1: CCSU, P2G equipment, and the carbon trading mechanism are not considered.
Scenario 2: Consider only the carbon trading mechanism.
Scenario 3: Consider P2G equipment and the carbon trading mechanism.
Scenario 4: Simultaneously consider CCSU, P2G equipment, and the carbon trading mechanism.
The energy efficiency comparison results of the optimized scheduling for the four scenarios are shown in Table 3.
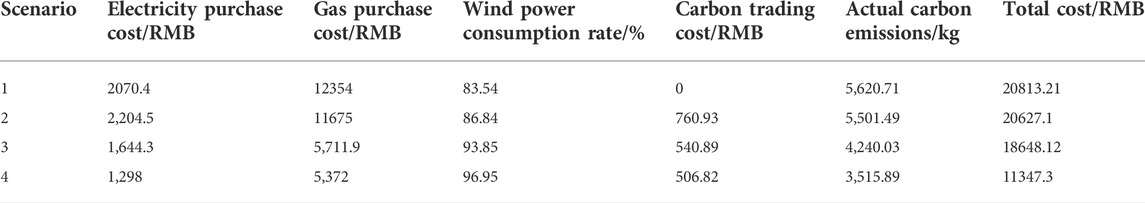
TABLE 3. Comparison of the results of scenarios 1, 2, 3, and 4.
Table 3 shows that Scenario 2 has a 3.30 percent increase in wind power consumption, a 2.12 percent decrease in carbon emissions, and a 0.89 percent decrease in total operating costs compared to Scenario 1. Because Scenario 1 does not consider the carbon trading mechanism and the gas price is lower than the electricity price, the system will purchase as much natural gas as possible to supply power to the electric load through CHP. As a result, carbon emissions are at their highest. After accounting for the carbon trading mechanism, the cost savings from purchasing gas rather than electricity are already lower than the cost of buying carbon emission initial allowances from the carbon trading market due to the high carbon emission cost generated by burning natural gas in Scenario 2.
Scenario 3 improves the wind power consumption rate by 7.01 percent. The carbon emission cost is reduced by 28.92 percent. The carbon emission is reduced by 22.93 percent, and the total cost is reduced by 9.59 percent compared to Scenario 2. Scenario 2 does not include P2G equipment. Wind power has anti-peak regulation characteristics. The wind power output is at its peak at night, but the electric load is in the low valley, resulting in serious wind power problems. Following the installation of P2G devices, extra power can be fed into the EL to make hydrogen energy during periods when the wind power output is abundant, enhancing the wind power consumption rate as shown in Figure 5. A portion of the hydrogen energy is held in the hydrogen storage facility to provide cheap storage and high generation arbitrage. At the same time, the remainder is sent to HFC for cogeneration and MR for natural gas synthesis. It will lose power in several steps because hydrogen energy is synthesized into natural gas by MR and then transported to GB and CHP for energy supply.
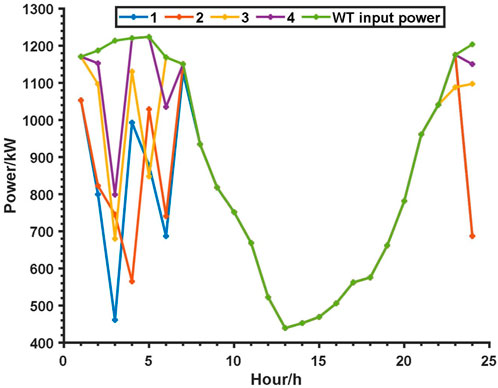
FIGURE 5. Comparison of wind power consumption curves for scenarios 1, 2, 3, and 4.
In contrast, the energy efficiency of hydrogen energy in HFC for thermoelectric production is high. An intermediate energy conversion link is reduced, hydrogen energy is preferentially transported to HFC for thermoelectric production, and HFC is in a full-generation state. Figure 6 shows how MR transforms the residual hydrogen energy into natural gas. On the one hand, hydrogen energy favors energy-efficient HFC for cogeneration, lowering energy ladder consumption and achieving zero carbon emissions. On the other hand, the carbon trading mechanism forces IES to reduce electricity supply through CHP and thermal load through GB, lowering carbon trading costs, carbon emissions, and total cost.
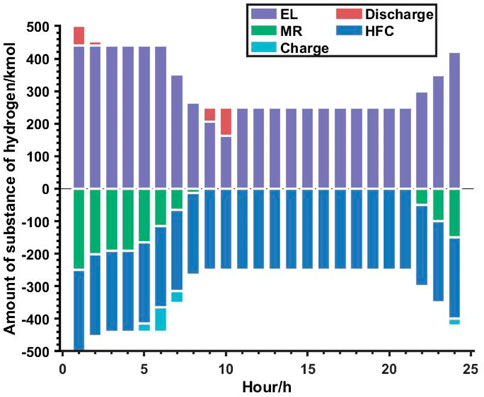
FIGURE 6. Hydrogen power balance diagram for scenario 3.
Scenario 4 improves wind power consumption by 3.10 percent, lowers carbon emission costs by 6.30 percent, lowers carbon emissions by 17.08 percent, and lowers the total cost by 39.15 percent compared to Scenario 3. After the synergy of the CCPU and P2G equipment, the CO2 captured by the CCPU can be supplied to MR to synthesize methane when there is a surplus of wind power. It not only increases wind power consumption and decreases the output of CHP, GB, and other equipment, lowering actual carbon emissions, but it also lowers the cost of MR’s external purchase of high-purity CO2, lowering total operating costs.
Two scenarios are set up to investigate the impact of multiple energy storage and demand response on the dispatch of the IES:
Scenario 5: Based on scenario 4, delete the multiple energy storage devices and do not consider demand response.
Scenario 6: Consider demand response based on Scenario 4.
Table 4 shows the price elasticity matrix in this paper.
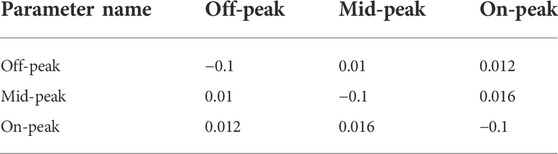
TABLE 4. Electricity price elasticity matrix
Table 5 compares the optimized scheduling outcomes for scenarios 4, 5, and 6. According to Table 5, when multiple energy storage devices are removed from scenario 5, the wind power consumption rate is reduced by 1.72 percent, the carbon trading cost is increased by 6.02 percent, carbon emissions are increased by 10.25 percent, and the total cost is increased by 6.26 percent. Due to the role of energy storage in storing electricity that is difficult to consume by the system when wind abandonment is high, supplying energy during peak hours enables the storage and redistribution of energy. It finally makes the IES’s scenery consumption rate and carbon emission rate improve.
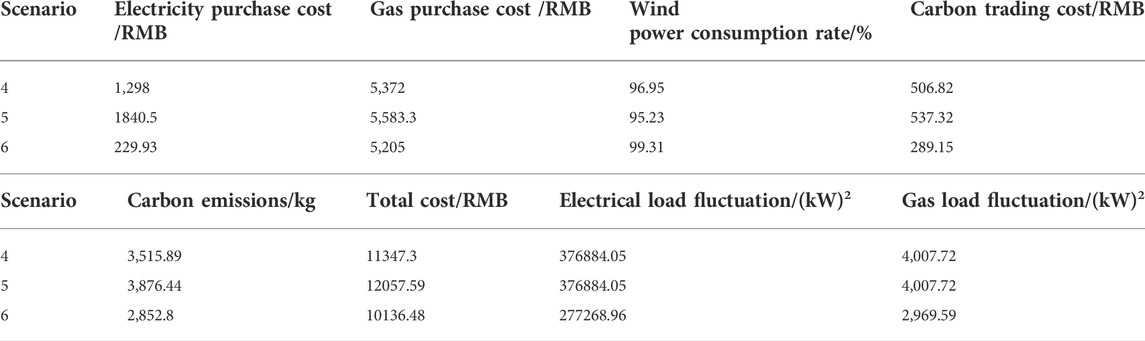
TABLE 5. Comparison of the results of scenarios 4,5, and 6
In scenario 6, compared to Scenario 4, wind power consumption rate increased by 2.36%, carbon emission cost decreased by 42.95%, carbon emissions decreased by 18.86%, total cost decreased by 10.67%, and electricity load fluctuation decreased by 26.43%. The gas load fluctuation decreased by 25.90%. It illustrates that including demand response transfers peak load to the loading trough, allowing more cost-effective units to generate more expensive units to generate less at peak load, thereby boosting energy efficiency. The electrical load changes of the IES in scenario 6 are shown in Figure 7. During 01:00-07:00 and 23:00-24:00, the load is low, the corresponding electricity price is low, and the transfer load is positive; during 10:00-14:00, the load is high, the corresponding electricity price is high, and the transfer load is negative. In addition, load curtailment is called for to ensure the safety and economy of the system. Figure 8 shows the similar response characteristics of the gas and electric loads and the opposite trend of load and price. During the dispatch cycle, the equivalent electricity price is lower than the gas price, considering the energy efficiency factor. Some of the gas load is replaced by the electric load. Meanwhile, due to the high input of wind power, users choose more cost-effective electricity to replace natural gas, which fully uses wind power and improves the wind power consumption rate.
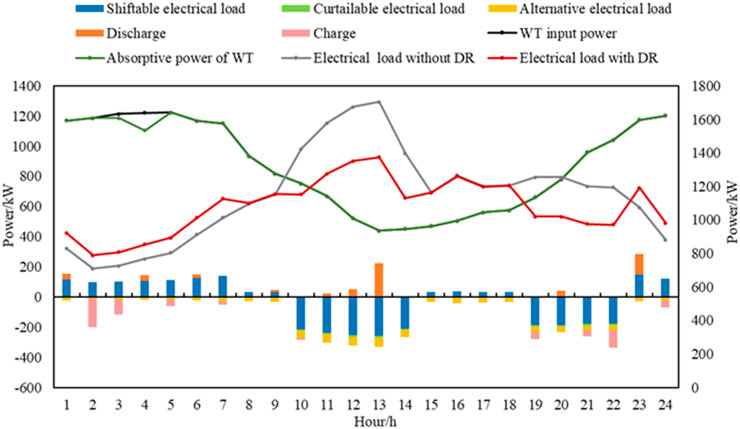
FIGURE 7. Scenario 6 Changes in the electrical load of the IES.
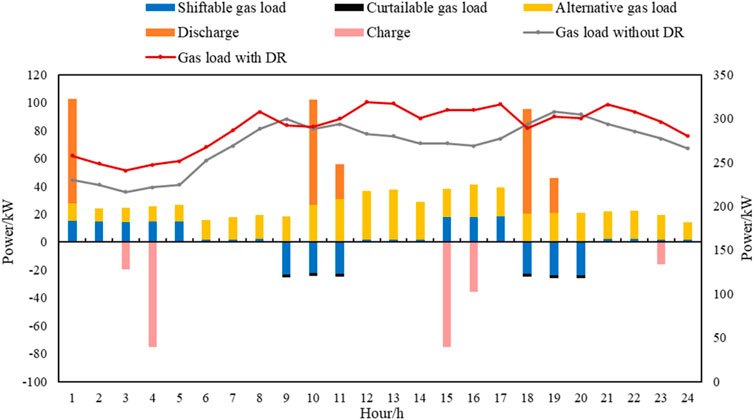
FIGURE 8. Scenario 6 Changes in the gas load of the IES.
Energy prices before and after the implementation of demand response are shown in Figures 9, 10. Before the implementation of demand response, the energy price could be comprehensively obtained from historical price information, energy supply costs, and system congestion. It can be seen that energy prices generally show a trend opposite to energy loads. During peak load periods, prices for both electricity and gas increase to some extent. In contrast, the system mostly tends to adjust energy prices downward during valley load periods to promote energy consumption. The demand response further widened the price difference for time-of-use energy, prompting users to use less energy in peak hours and more energy in valley hours, making the social energy use scheme more economical and efficient.
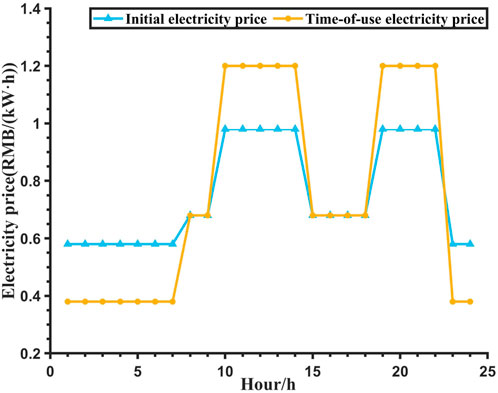
FIGURE 9. Comparison of electricity prices before and after DR.
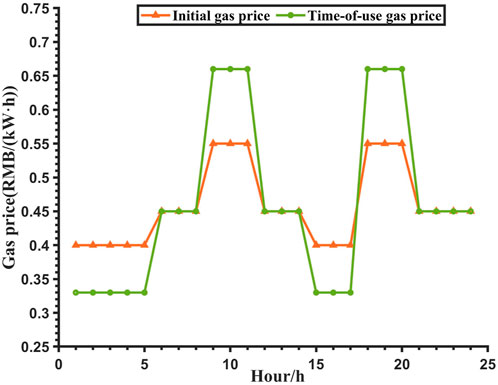
FIGURE 10. Comparison of gas prices before and after DR.
The participation of flexible resources on the load and storage side makes the load timing fluctuations more closely match the changes of wind and wind energy and can flexibly adjust its energy use status in the operation process according to the IES demand for wind power consumption and peak shaving, based on the synergy of multiple types of low-carbon factors. The significant role of energy storage in this process is to store energy that is difficult to consume by the system during high wind and light abandonment and supply power during peak energy consumption hours. The energy efficiency of IES is further improved by the synergy of multiple energy storage and demand response.
The following findings are taken from the simulation results of several scenarios using the scheduling model for energy efficiency improvement for the IES that considers multiple types of low-carbon components and demand response.
1) With the implementation of the CCSU, P2G, and carbon trading mechanisms in the IES, the system’s total cost and carbon emissions are reduced, and the wind power consumption rate is increased by establishing appropriate parameters.
2) Following refined modeling of the power-to-gas process, it is possible to increase wind power consumption while utilizing the advantages of hydrogen energy’s high energy efficiency and reducing energy gradient loss. Multiple energy storages in the IES allow the storage and redistribution of numerous energy sources, reducing demand variations caused by wind power’s randomness.
3) Demand response encourages the deployment of electricity and gas loads in the time domain, reduces the load fluctuation, and enables “peak shaving and valley filling” of loads. Demand response and multiple energy storages work together to lower the system’s total cost and carbon emissions while increasing wind power consumption rate, assuming that various types of low-carbon factors are considered in the IES.
The original contributions presented in the study are included in the article/Supplementary Material; further inquiries can be directed to the corresponding author.
XM and YL proposed the methodology. XM and YL conducted the theoretical analysis as well as the simulation verification. XM and YL wrote the original draft, which was reviewed and edited by KW and RJ. XW, HD, and HL contributed to the supervision. All authors agree to be accountable for the content of the work.
This research was supported by the Shaanxi Province Science and Technology Project (No. 2022JM-208) and the laboratory research project of State Grid Co., Ltd., Gansu Youth Science and Technology program (21JR7RA745).
The authors declare that the research was conducted in the absence of any commercial or financial relationships that could be construed as a potential conflict of interest.
All claims expressed in this article are solely those of the authors and do not necessarily represent those of their affiliated organizations, or those of the publisher, the editors, and the reviewers. Any product that may be evaluated in this article, or claim that may be made by its manufacturer, is not guaranteed or endorsed by the publisher.
Akbari-Dibavar, A., Mohammadi-Ivatloo, B., Zare, K., Khalili, T., and Bidram, A. (2021). Economic-emission dispatch problem in power systems with carbon capture power plants. IEEE Trans. Ind. Appl. 57 (4), 3341–3351. doi:10.1109/TIA.2021.3079329
Aramouni, N. A. K., Zeaiter, J., Kwapinski, W., and Ahmad, M. N. (2017). Thermodynamic analysis of methane dry reforming: Effect of the catalyst particle size on carbon formation. Energy Convers. Manag. 150, 614–622. doi:10.1016/j.enconman.2017.08.056
Chen, Z., Wang, D., Jia, H., Wang, W., Guo, B., Qu, B., et al. (2017). Research on optimal day-ahead economic dispatching strategy for microgrid considering P2G and multi-source energy storage system. Proc. CSEE 37 (11), 3067–3077. doi:10.13334/j.0258-8013.pcsee.161017
Chen, J, J., Hu, Z., and Chen, Y. (2021). Thermoelectric optimization of integrated energy system considering ladder-type carbon trading mechanism and electric hydrogen production. Electr. Power Autom. Equip. 41 (09), 48–55. doi:10.16081/j.epae.202109032
Chen, Z, Z., Zhu, J., Dong, H., Wu, W., and Zhu, H. (2021). Optimal dispatch of WT/PV/ES combined generation system based on cyber-physical-social integration. IEEE Trans. Smart Grid 13 (1), 342–354. doi:10.1109/TSG.2021.3107685
Cui, Y., Deng, G., Zeng, P., Zhong, W., Zhao, Y., and Liu, X. (2021). Multi-time scale source-load dispatch method of power system with wind power considering low-carbon characteristics of carbon capture power plant. Proc. CSEE, 1–18. doi:10.13334/j.0258-8013.pcsee.210697
Cui, Y., Yan, S., Zhong, W., Wang, Z., Zhang, P., and Zhao, Y. (2020). Optimal thermoelectric dispatching of regional integrated energy system with power-to-gas. Power Syst. Technol. 44 (11), 4254–4264. doi:10.13335/j.1000-3673.pst.2019.2468
Hong, B., Zhang, W., Zhou, Y., Chen, J., Xiang, Y., Mu, Y., et al. (2018). Energy-Internet-oriented microgrid energy management system architecture and its application in China. Appl. Energy 228, 2153–2164. doi:10.1016/j.apenergy.2018.07.081
Li, L., and Yu, S. (2020). Optimal management of multi-stakeholder distributed energy systems in low-carbon communities considering demand response resources and carbon tax. Sustain. Cities Soc. 61, 102230. doi:10.1016/j.scs.2020.102230
Liu, P., Ding, T., Zou, Z., and Yang, Y. (2019). Integrated demand response for a load serving entity in multi-energy market considering network constraints. Appl. Energy 250, 512–529. doi:10.1016/j.apenergy.2019.05.003
Rong, S., Chen, X., Guan, W., and Xu, M. (2019). Coordinated dispatching strategy of multiple energy sources for wind power consumption. J. Mod. Power Syst. Clean. Energy 7 (6), 1461–1471. doi:10.1007/s40565-019-0540-7
Tian, F., Jia, Y., and Ren, H. (2020). Source-load low-carbon economic dispatch of integrated energy system considering carbon capture system[J]. Power Syst. Technol. 44, 3346–3355. doi:10.13335/j.1000-3673.pst.2020.0728
Viebahn, P., Vallentin, D., and Höller, S. (2015). Prospects of carbon capture and storage (CCS) in china’s power sector–an integrated assessment. Appl. Energy 157, 229–244. doi:10.1016/j.apenergy.2015.07.023
Wang, R., Wen, X., Wang, X., Fu, Y., and Zhang, Y. (2022). Low carbon optimal operation of integrated energy system based on carbon capture technology, LCA carbon emissions and ladder-type carbon trading. Appl. Energy 311, 118664. doi:10.1016/j.apenergy.2022.118664
Xiang, Y., Wu, G., Shen, X., Ma, Y., Gou, J., Xu, W., et al. (2021). Low-carbon economic dispatch of electricity-gas systems. Energy 226, 120267. doi:10.1016/j.energy.2021.120267
Yao, X., Zhong, P., Zhang, X., and Zhu, L. (2018). Business model design for the carbon capture utilization and storage (CCUS) project in China. Energy Policy 121, 519–533. doi:10.1016/j.enpol.2018.06.019
Zhang, X., Fan, J. L., and Wei, Y. M. (2013). Technology roadmap study on carbon capture, utilization and storage in China. Energy Policy 59, 536–550. doi:10.1016/j.enpol.2013.04.005
Zhang, Z., Jing, R., Lin, J., Wang, X., van Dam, K. H., Wang, M., et al. (2020). Combining agent-based residential demand modeling with design optimization for integrated energy systems planning and operation. Appl. Energy 263, 114623. doi:10.1016/j.apenergy.2020.114623
Zhou, R., Sun, H., and Tang, X. (2018). Low-carbon economic dispatch based on virtual power plant made up of carbon capture unit and wind power under double carbon constraint. Proc. CSEE 38 (6), 1675–1683. doi:10.13334/j.0258-8013.pcsee.170541
ω The length of carbon emission interval.
aEL, bEL, cEL The coefficients of the efficiency function.
ai、bi、ci The PGU/CHP/GB’s carbon emission coefficients. (i = 1,2,3 means the PGU/CHP/GB)
c The unit price of carbon trading in the market.
CCO2 The cost of carbon trading in the IES.
CO2(t) The mass of CO2 emitted by the PGU, CHP, and GB during the period t.
CO2(t)/ mGB,
F Faraday constant.
mCCSU, CO2(t) The mass of CO2 captured by the CCSU during the period t.
mL Total initial carbon emission allowances for the IES.
mPGU, CO2(t)/mCHP,
OCHP/OGB/OPGU/OEL/OMR/OHFC The unit operation and maintenance costs of the CHP/GB/PGU/EL/MR/HFC.
Pbuy,e(t)/Pbuy,g(t) The power of purchased electricity and gas in the IES during the period t.
PWT,e(t) The wind power consumed by the IES during the period t.
PWTI,e(t) The wind power input to the IES during the period t.
δbuy,e(t)/δbuy,g(t) The price of electricity and gas during the period t.
δWT, cut The cost per unit of wind abandonment penalty.
ρ The incentive coefficient.
ϒ The range of carbon trading price increase for each ladder type
Keywords: integrated energy system, multiple types of low-carbon factors, energy efficiency, ladder-type carbon trading mechanism, two-stage optimization method
Citation: Ma X, Liang Y, Wang K, Jia R, Wang X, Du H and Liu H (2022) Dispatch for energy efficiency improvement of an integrated energy system considering multiple types of low carbon factors and demand response. Front. Energy Res. 10:953573. doi: 10.3389/fenrg.2022.953573
Received: 26 May 2022; Accepted: 30 June 2022;
Published: 04 August 2022.
Edited by:
Zaibin Jiao, Xi’an Jiaotong University, ChinaReviewed by:
Kaiping Qu, China University of Mining and Technology, ChinaCopyright © 2022 Ma, Liang, Wang, Jia, Wang, Du and Liu. This is an open-access article distributed under the terms of the Creative Commons Attribution License (CC BY). The use, distribution or reproduction in other forums is permitted, provided the original author(s) and the copyright owner(s) are credited and that the original publication in this journal is cited, in accordance with accepted academic practice. No use, distribution or reproduction is permitted which does not comply with these terms.
*Correspondence: Yan Liang, NjQ1MzkwNjQxQHFxLmNvbQ==
Disclaimer: All claims expressed in this article are solely those of the authors and do not necessarily represent those of their affiliated organizations, or those of the publisher, the editors and the reviewers. Any product that may be evaluated in this article or claim that may be made by its manufacturer is not guaranteed or endorsed by the publisher.
Research integrity at Frontiers
Learn more about the work of our research integrity team to safeguard the quality of each article we publish.