 Minhua Cheng
 Meng Zhao
- Research Institute of Petroleum Exploration and Development (RIPED), Beijing, China
Development of horizontal wells is one of the important means to improve the well production of the tight gas reservoir and realize the effective development of tight gas. Based on abundant static and dynamic data of a large number of horizontal wells that have been put into operation, structure characteristics of a tight reservoir carried out, detailed geologic analysis of the effective reservoir drilled by horizontal wells, and development dynamic analysis, three effective reservoir lateral distribution modes of the block concentrated development mode, medium layer, and thin layer superimposed mode and thin layer isolated model mode are proposed and their adaptability to the horizontal well deployment is evaluated. The drilled reservoir is divided into three types: high-quality reservoir, suboptimal reservoir, and poor reservoir, and the quantitative classification standard is established. On this basis, the decline rule and the difference of horizontal well drilling in different quality reservoirs are discussed, and the quantitative evaluation standard of the horizontal well development effect is established. The initial decline rates of the three types of horizontal wells are 32.9%, 35%, and 40%, and the estimate ultimate recoveries (EURs) of three types of horizontal wells are 89 million cm3, 68 million cm3, and 31 million cm3, respectively. The results of this study provide technical support for the optimal deployment of new horizontal wells in the Sulige gas field and a reference for the development of horizontal wells in the same types of gas reservoirs.
Introduction
The use of horizontal wells was originally proposed in 1928 and has been widely implemented in many countries since the 1980s. Currently, the United States and Canada are the two major countries with a large number of horizontal wells and a high technological level. Compared with vertical wells, horizontal wells can expand the seepage area in a fixed reservoir area, reduce the size of the drilling footage, and reduce material costs while ensuring production. This is currently one of the most effective means of increasing single well production and reducing the number of wells. The development and application of horizontal wells have greatly benefited the large-scale development of tight oil, tight gas, and shale gas.
Horizontal wells have been successfully used in the development of tight gas sandstone reservoirs around the world. Tight gas reservoirs are mainly sand bar-coastal plains and delta sedimentary systems, such as the Dakota and Pictured Cliffs gas reservoirs in the San Juan Basin. These reservoirs have a large effective thickness, stable effective reservoir distribution, and good connectivity and continuity. Moreover, the amount of fluvial sediment is relatively small. In comparison, the tight gas sandstone reservoirs in China are mostly fluvial sediment systems. For example, in the Sulige gas field in the Ordos Basin, the effective sandstone bodies are distributed in a lenticular form and are connected horizontally. Moreover, the sand body thickness is small (He et al., 2004; Jia et al., 2007). Due to the complex geological conditions and the limitations of horizontal well technology, the horizontal well development in the Sulige gas field underwent four stages: preliminary exploration (before 2010), scale production (2010–2013), rapid development (2014–2016), and stable development (2017 to present). With an increasing understanding of the geological conditions and the development of horizontal well technology, the overall development of horizontal wells has gradually improved. However, due to differences in the strata, reservoir quality, and structural characteristics of the different blocks, the results of the horizontal well implementation vary greatly. Under the situation where in the development of the gas field enrichment areas is prioritized, the quality of the remaining areas gradually decreases, and the outcome of horizontal well drilling needs to be further evaluated (Zhang et al., 2013; Lu et al., 2015; Guang et al., 2019).
Based on the static and dynamic data for a large number of horizontal wells that have been put into production, in this study, we focused on the detailed geological characteristics of the horizontal wells and the dynamic and static parameters in order to analyze the declining characteristics and differences in the horizontal wells in different reservoirs. Then, quantitative identification and classification standards were established, thereby providing technical support for the scale production and efficient development of the Sulige gas field and providing a reference for the development of horizontal wells in the same types of gas reservoirs in China.
Study area
The Sulige gas field is located in the middle section of the northern part of the Ordos Basin, with an exploration area of 5 × 10⁴ km2 and a superimposed gas-bearing area of about 4 × 10⁴ km2. The main gas-bearing strata are located in the Upper Paleozoic Permian He 8 member of the Shihezi Formation and the Shan 1 member of the Shanxi Formation (Well patterning filling strategy to, 2018; He et al., 2022) (Table 1). The proven reserves (including almost proven reserves) in the area are 4 × 10¹² m3, the reservoir permeability ranges from 0.01 to 2.0 mD, and the porosity ranges from 2% to 14%. The area is a large-scale tight gas sandstone reservoir, and it currently has the largest scale natural gas reserves and the highest annual output in China.

TABLE 1. Formation development situation of the Sulige gas field, Ordos gas field, and Ordos Basin.
Basic geological characteristics
Sedimentary facies
The Sulige gas field is 250 km long and 200 km wide (Li and Peng, 2007; Wen et al., 2007). The He 8 member of the Upper Paleozoic Lower Shihezi Formation is a gentle-slope braided river delta deposit, with a 0.2–1.0 km single-stage channel. The river channel has undergone repeated horizontal migration and vertical stacking, forming a large contiguous sandstone reservoir that is hundreds of kilometers long. The Shan 1 member of the Shanxi Formation is a low-curvature meandering river delta deposit. The channel and swamps are alternately distributed. The channel sand body extends for hundreds of kilometers. The single-stage channel width is 0.1–1.0 km, which is superimposed and extended on the plane.
A large amount of core analysis data has revealed that only the coarse facies such as coarse sandstone and gravel-bearing coarse sandstone in the gas field form effective reservoirs (Cheng et al., 2021). The coarse facies are mainly distributed in the core and the lower part of the channel filling microfacies, accounting for 35%–40% of the total thickness of the sandstone. The coarse facies in the core account for 25%–30%, and the coarse facies in the lower channel account for 10%.
Reservoir characteristics
The main strata in the gas field, i.e., the He 8 and Shan 1 members, have similar sandstone compositions. The types of sandstone are mainly lithic quartz sandstone and quartz sandstone, with a small amount of lithic sandstone (Zeng et al., 2022). The sandstone has a large grain size (0.2–1 mm) and is mainly composed of coarse sandstone, medium-coarse sandstone, and a small amount of gravel-bearing coarse sandstone and medium-fine sandstone. The reservoir has typical physical properties, i.e., low porosity and low permeability. The average porosity is 7.45% (range: 4%–12%) (Figure 1). The permeability exhibits a double peak characteristic (Figure 2), with primary and secondary peaks at 0.2 × 10⁻³ μm2 and 1 × 10⁻³ μm2, respectively. Generally, the physical properties of the He 8 member are better than those of the Shan 1 member (Fu et al., 2008).
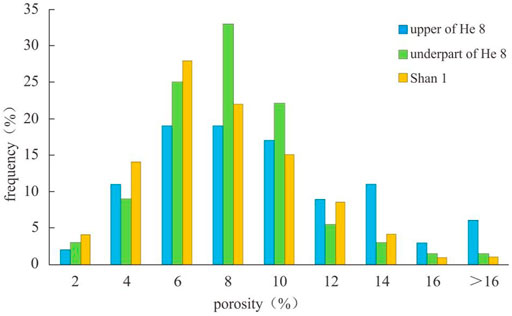
FIGURE 1. Reservoir porosity distribution histogram for the Sulige gas field.
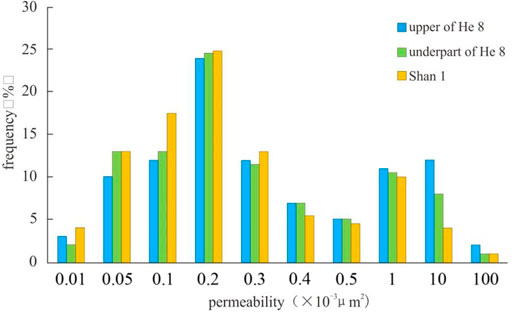
FIGURE 2. Reservoir permeability distribution histogram for the Sulige gas field.
Fine characterization of the reservoir spatial structure and development of the classification standard
Due to the obvious zonal characteristics of the spatial development of braided river systems, there are large differences in the spatial structural characteristics of the different zones. The differences not only affect the quality of the reservoir but also the dynamic indicators of the gas wells, such as the open flow, decline rate, dynamic reserves, and control range. Based on the analysis of the effective reservoirs in a large number of horizontal wells, the factors influencing the reservoir quality were identified, and a reservoir quality classification standard was formulated to provide a reference for analyzing the suitability of the horizontal well development.
Reservoir structure modes
Based on the spatial distribution of the structural characteristics of the tight gas reservoirs, the well trajectory of the effective reservoirs, and the dynamic response, three horizontal reservoir distribution modes were established: the concentrated block development mode, the medium-thin strata overlay mode, and the isolated thin strata mode (Figure 3).
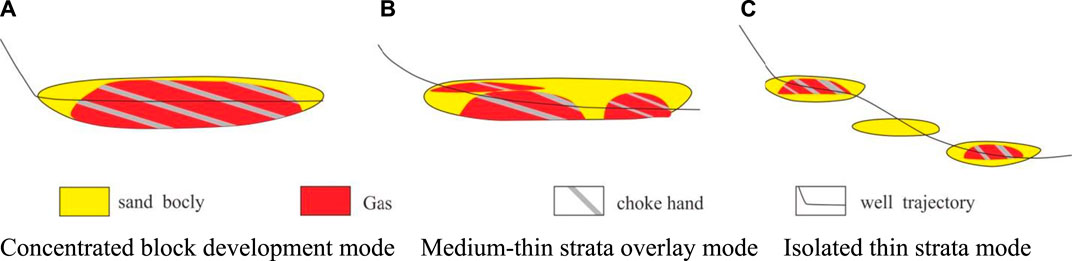
FIGURE 3. Horizontal well distribution pattern. (A) Concentrated block development mode. (B) Medium-thin strata overlay mode. (C) Isolated thin strata mode.
Characterization of the reservoir structure
The concentrated block development mode is mainly distributed in the main part of the superimposition zone of the braided river system, and it has the best hydrodynamic conditions. As can be seen from the typical section shown in Figure 4, the effective sand body of a single-stratum block with a large thickness has good horizontal continuity, the distribution of the geological reserves is relatively concentrated, the main stratum is prominent, and the lithology is pure medium-coarse sandstone. The effective sand body drilling success rate of this structural mode was 63.6% on average.
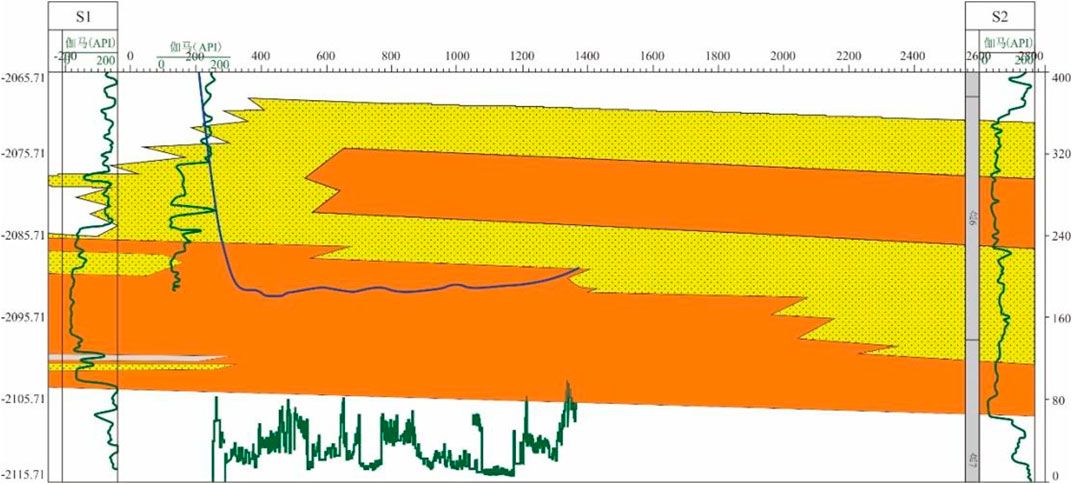
FIGURE 4. Typical section of a horizontal well in a class I reservoir.
The medium-thin strata overlay mode is mainly distributed in the lateral wings and the transition zone of the braided river system. The hydrodynamic conditions of these facies were fairly good. As can be seen from the typical section shown in Figure 5, the superimposition thickness of the sandstone is about 10 m. There are a number of effective sand bodies with varying thicknesses, and the horizontal continuity is good. The sandstone is finer than that of the block strata mode, and there is obvious sand–shale interbedding. The effective sand body drilling success rate was 50%–60% on average.
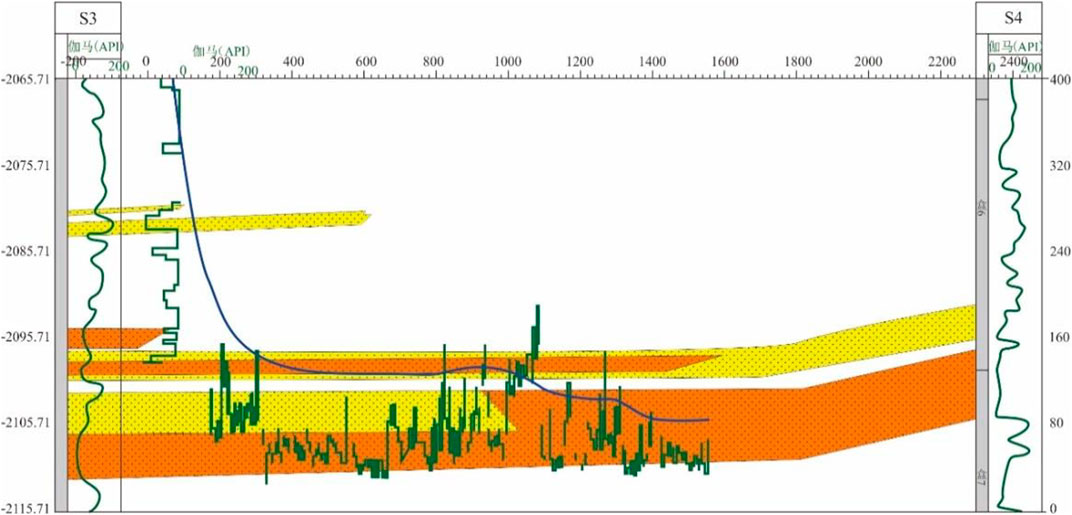
FIGURE 5. Typical section of a horizontal well in a class II reservoir.
The isolated thin strata mode is mainly distributed between the braided river systems. This facies had the weakest hydrodynamic conditions. There are obvious channel stages, and the horizontal continuity is poor. As can be seen from Figure 6, there is obvious sand–shale interbedding, and the effective sand bodies are thin and isolated. The grain size is fine, and the shale content is high. The effective sand body drilling success rate was less than 40%.
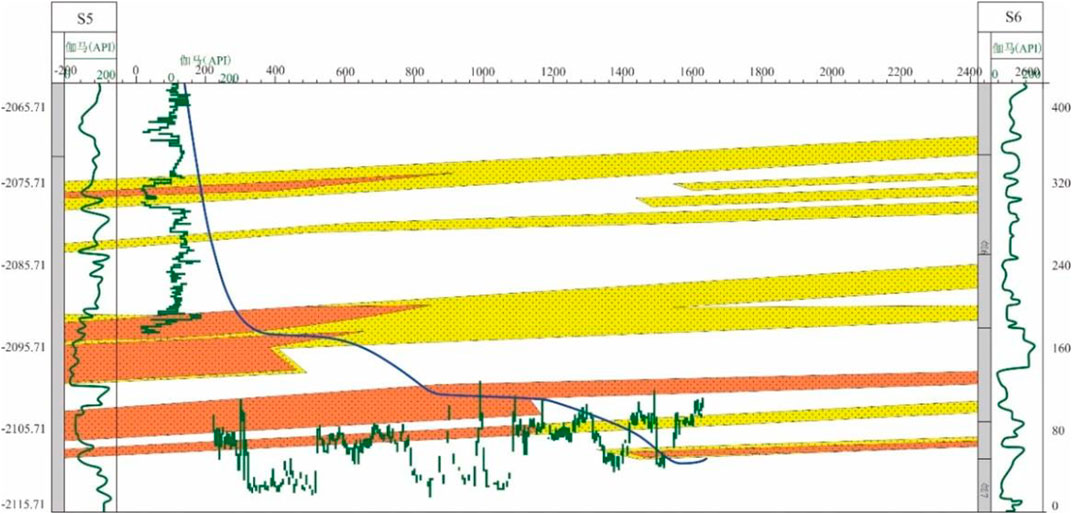
FIGURE 6. Typical section of a horizontal well in a class III reservoir.
Reservoir quality classification standard
Based on the spatial distribution of the structural characteristics of a large number of single horizontal wells and the dynamic and static indicators (Figures 7, 8), the reservoirs were classified into three types: high-quality reservoirs (Type I), sub-optimal reservoirs (Type II), and poor-quality reservoirs (Type III). The details of the classification standard are presented in Table 2.
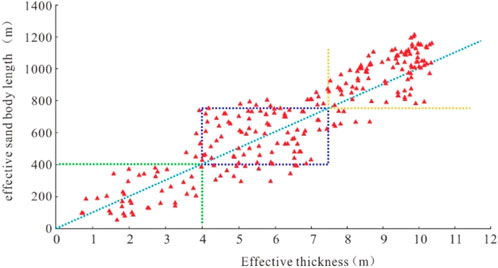
FIGURE 7. Intersection diagram of effective thickness versus effective sand body length.
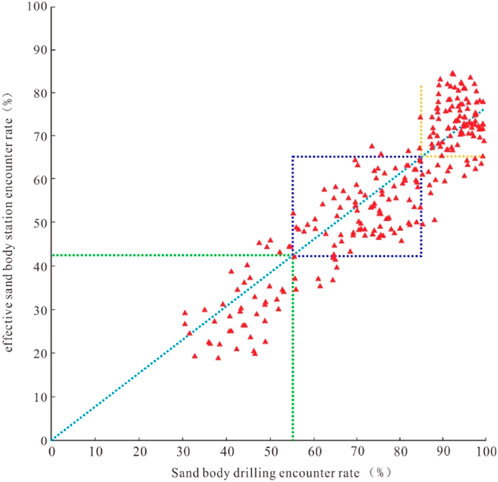
FIGURE 8. Intersection diagram of sand body drilling encounter rate effective sand body station encounter rate.
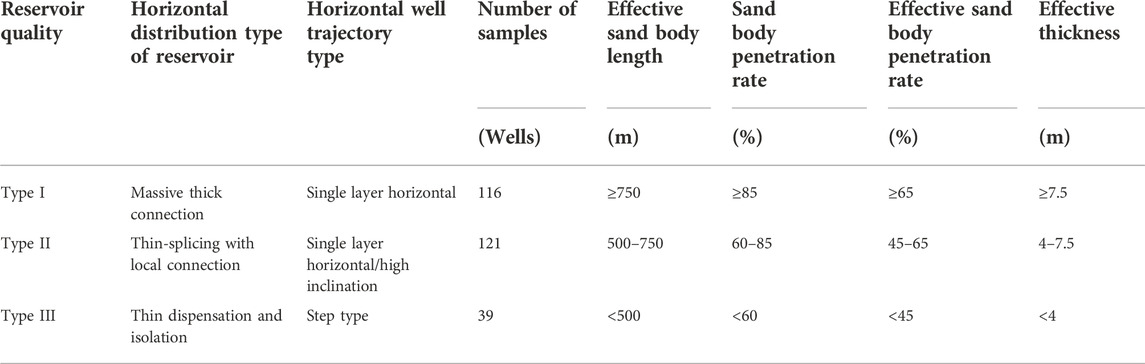
TABLE 2. Classification standard for effective reservoir quality in horizontal wells drilled in the Sulige gas field.
Based on the reservoir quality classification standard, the dynamic and static indicators of the horizontal distribution patterns of the three types of reservoirs are significantly different, and there are also significant differences in terms of the adaptability of the horizontal wells. As the gas field development progressed, the high-energy superimposed channel zone located in the main part of the superimposition zone of the braided river system has been fully exploited, and the development has gradually shifted to the lateral wings and the transition zone of the river channel (Wang and Wang, 2014). The engineering practice of drilling horizontal wells has revealed that the fractured horizontal wells in the Sulige gas field generally do not have an obvious stable production period. The output of these wells was high but declined rapidly in the early stage of production, and the production was low with a slow decline in the late stages. However, there were large differences in the production and decline characteristics of the horizontal wells drilled in the different quality reservoirs. Through research on the decline characteristics and differences of the different quality reservoirs, a quantitative classification standard was established to help predict the production of new horizontal wells.
Differences in the production decline characteristics of horizontal wells in different quality reservoirs
Horizontal well seepage characteristics
Due to the poor physical properties and strong heterogeneity of the tight gas sandstone reservoirs, staged fracturing needed to be conducted after the completion of the horizontal wells in order to achieve high productivity and well-controlled reserves (Zeng et al., 2022). After staged fracturing of the horizontal wells, a composite reservoir was formed, which was composed of a high-permeability fracture reformed zone in the near-well area and a tight non-reformed zone in the far-well area (Clarkson, 2013). Figure 9 shows several flow conditions experienced by the staged fracturing horizontal well from the initiation of the production to become stabilized in the later stages. In the early stage of production, the formation fluid in contact with the fracture surface started to provide gas to the fractures, and the gas entered the well after it entered the fractures. Overall, this was a bilinear flow (BLF). As the flow in the fractures became quasi-stable, the pressure reduction everywhere in the fractures was the same, and the formation fluid steadily provided gas to the fractures, presenting a formation linear flow (FLF). As the pressure spread within the formation, each single fracture entered the formation radial flow (FRF) stage, and the fractures did not interfere with each other. When the interference became strong, the space between the fractures showed the characteristics of quasi-stable production in general and entered the second linear flow (SLF) stage. As the pressure continued to spread, the overall flow pattern of the horizontal well was similar to a single wide well; that is, the second radial flow (SRF) stage. The fracturing horizontal well reached a relatively stable state at this time. When the production reached the mid-to-late stage, the discharge range reached the well-control flow boundary, entering the last quasi-stable stage, and the rate of production decline gradually decreased (Cheng et al., 2021; PALACIO J CBLASINGAME, 2003) (Figure 7).
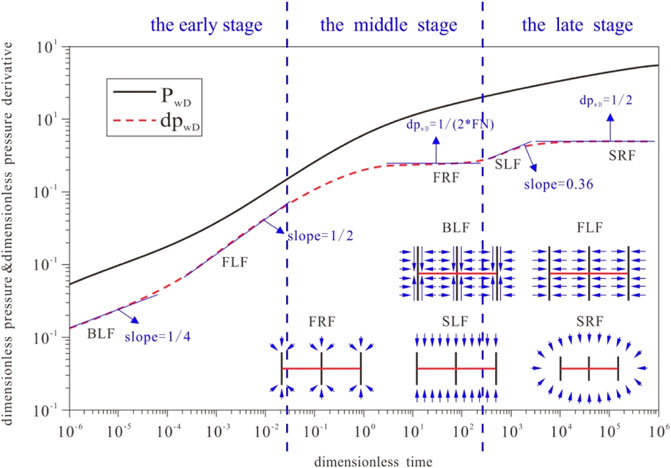
FIGURE 9. Schematic diagram of the formation pressure wave propagation for a multifractured horizontal well.
In this study, ARPS (Arps, 1945) decline curve analysis was used to study the production decline characteristics of the horizontal wells in the tight gas sandstone reservoirs. It is a simple method and only requires limited actual development data. However, the results of this method are only accurate after the gas well flow has entered the boundary control stage. Therefore, the key to the success of the ARPS analysis is to determine when the horizontal well has reached the pseudo-steady state stage.
According to the studies of Huo et al. (Huo, 2013) and the current development status of the Sulige gas field (reservoir permeability: 0.01–0.2 mD, average reservoir porosity: 8%), it was concluded that it takes less than 900 days to reach the pseudo-steady state stage. Therefore, in this study, the horizontal wells with a production time of more than 3 years were selected for ARPS decline curve analysis.
Production decline characteristics of horizontal wells
The development of horizontal wells in the Sulige gas field has lasted for over a decade, during which thousands of horizontal wells have been put into production. In this study, 685 horizontal wells were selected to analyze the production decline characteristics and differences of the horizontal wells in the different quality reservoirs. The inclusion criteria were as follows: 1) the production time was greater than 900 days; 2) the rate of well operation was >85%; and 3) the pressure drop was less than 0.02 Ma/d.
As can be seen from Figures 10, 11, the gas wells with various reservoir qualities had their respective productivity levels, and with a reasonable range of pressure drop, the gas well had continuous production capacity. The production volumes and pressures of the different wells exhibit similar trends. Specifically, the decline was rapid in the first year, and then, it gradually slowed down in the subsequent years. However, the decline characteristics of the gas wells in the different reservoirs were different.
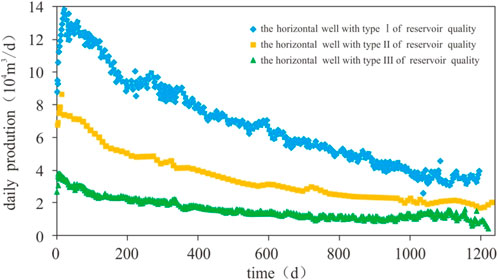
FIGURE 10. Comparison of production of horizontal wells with three types of reservoir qualities.
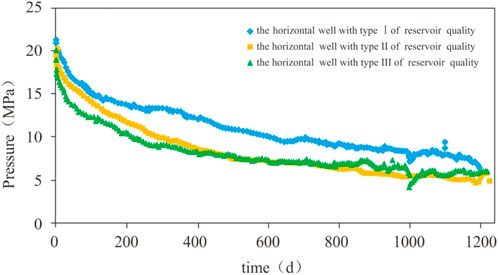
FIGURE 11. Comparison of horizontal well pressure for three types of reservoir qualities.
Differences in the decline characteristics of horizontal wells in different quality reservoirs
The model established based on the ARPS production decline theory and the curve fitting method are currently used to analyze the decline characteristics of tight gas sandstone reservoirs. Production decline can be divided into three types: exponential decline, hyperbolic decline, and harmonic decline (Arps, 1945). The relationship between the production and decline rate is as follows:
where
In actual field operations, due to unstable working conditions and large changes in the production difference of gas wells (Ilk et al., 2010), if the actual production curve was used to calculate the rate of decline, there would be noise and even negative values (Pratikno et al., 2003). Therefore, the production decline formula was used to fit the curve. The fitted curve is smooth, and the rate of decline calculated based on the fitted curve is more accurate (Figures 12–14).
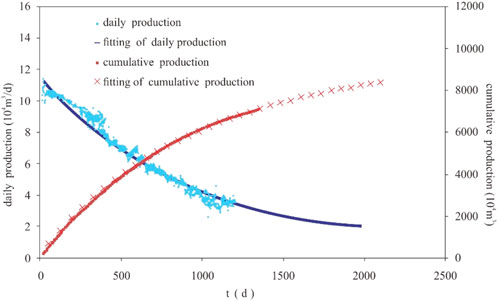
FIGURE 12. Historical fitting curves of the production and cumulative production of horizontal wells with class I reservoir quality.
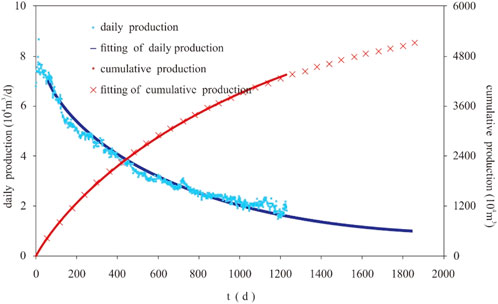
FIGURE 13. Historical fitting curves of the production and cumulative production of horizontal wells with class II reservoir quality.
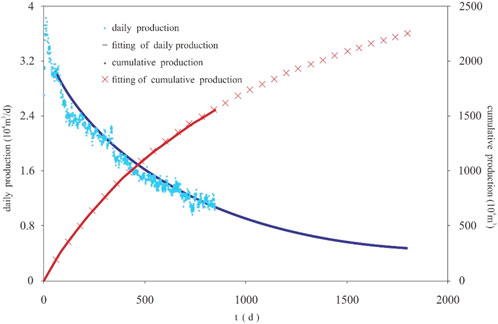
FIGURE 14. Historical fitting curves of the production and cumulative production of the horizontal wells with class III reservoir quality.
It can be seen from Figure 15 that the production volumes of all three types of reservoirs began to decline after the horizontal wells were put into production, and there was no stable production stage. In the early stage of production decline, there was a difference between the different reservoirs in terms of the initial decline rate in Stage A, which was mainly caused by the differences in reserves near the well and around the fractures. Moreover, there were differences in the predicted well life and the cumulative gas production. The gas wells in Type I reservoirs had a production life of 18 years, and those in Type II and Type III reservoirs had a production life of 15 years. The main reasons for this difference were the increase in the pressure difference, the pressure decrease in the near-well zone, and the difference in the reserves of the surrounding reservoirs. In the late stage of production, the decline rate gradually decreased and became stable, leading to stable and low production for a long period of time.
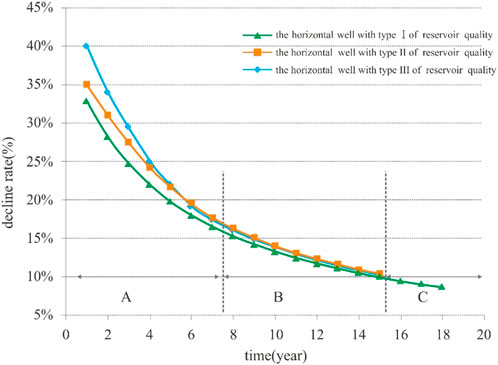
FIGURE 15. Comparison of the annual production decline rate curves of the horizontal wells with three types of reservoir qualities.
Development of quantitative identification and classification standards
Based on the above decline characteristics and the differences in the horizontal wells drilled in the different quality reservoirs, a set of quantitative identification and evaluation criteria for the decline parameters of the horizontal wells in the Sulige gas field was established (Table 3). A quantitative classification standard was developed for the initial production rate, the initial annual decline rate, the average annual decline rate, the production life of the gas well, and the final estimated ultimate recovery (EUR). This standard can be used to systematically analyze and evaluate the horizontal wells in the tight gas sandstone reservoirs in the Sulige gas field, and it can also be used to predict the development of new horizontal wells.
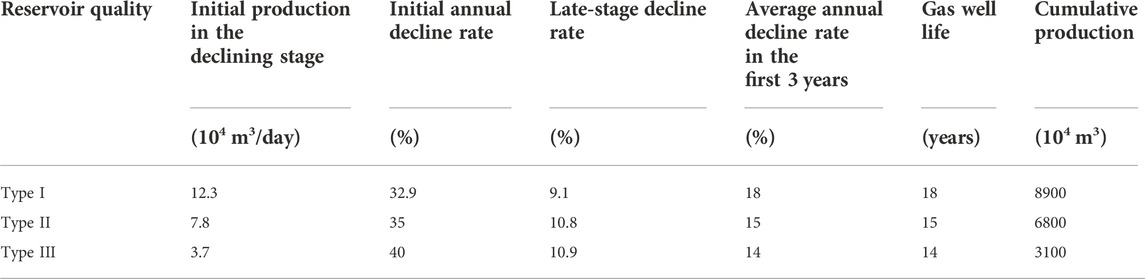
TABLE 3. Quantitative evaluation of the decline of the characteristic parameters of horizontal wells with different reservoir qualities.
Conclusions
1) Based on the spatial structural characteristics of tight gas reservoirs, the well trajectory of effective reservoirs, and the dynamic responses, three horizontal reservoir distribution modes were defined: the concentrated block development mode, medium-thin strata overlay mode, and isolated thin strata mode.
2) Based on the spatial distribution of the structural characteristics of a large number of single horizontal wells and the dynamic and static indicators, the reservoirs were classified into three types: high-quality reservoirs (Type I), sub-optimal reservoirs (Type II), and poor-quality reservoirs (Type III).
3) In view of the long time required for seepage to reach the boundary in tight gas sandstone reservoirs, based on the seepage theory, it was determined that it takes less than 3 years for the horizontal wells in the Sulige gas field to reach the pseudo-steady seepage stage.
4) Horizontal wells in the different quality reservoirs that were stable in terms of production and had a production time of more than 3 years were selected for analysis. The differences in the production decline characteristics of the wells were analyzed, and a quantitative classification standard for the characteristic decline parameters was established. This quantitative standard can be used to predict the development potential of new horizontal wells and guide the effective development of similar gas fields.
5) At present, the decline rate of the horizontal wells in use is high at the initial stage and gradually decreases in the middle and later stages. The decline rate of the gas well is closely related to the gas production rate. Especially for the tight sandstone gas reservoir, the flow in the well control area includes two aspects: the flow from the fracture network stimulation area to the wellbore and the flow from the matrix area to the fracture network stimulation area. In the later stage, the flow resistance in the matrix area is much greater than that in the fracture network area, and the gas supply capacity is limited, which cannot guarantee the stability of high production. Therefore, the higher gas production rate in the initial stage will cause a large decline rate. Therefore, the production pressure difference should be properly controlled, and the gas production rate and the decline of gas wells should be reduced to maintain the stable production of gas wells.
Data availability statement
The datasets presented in this article are not readily available because this research participants did not agree for their data to be shared publicly. Requests to access the datasets should be directed to Y2hlbmdtaDIwMTFAcGV0cm9jaGluYS5jb20uY24=.
Author contributions
MC: research on gas reservoir engineering and economic evaluation, writing the article. MZ: research on gas reservoir engineering and economic evaluation, writing the article.
Funding
This thesis was funded by the National Science and Technology (No. 2016ZX05047) and the science and technology project of PetroChina Company Limited (2021DJ-1704). The funder was not involved in the study design, collection, analysis, interpretation of data, the writing of this article, or the decision to submit it for publication
Conflict of interest
The authors declare that the research was conducted in the absence of any commercial or financial relationships that could be construed as a potential conflict of interest.
Publisher’s note
All claims expressed in this article are solely those of the authors and do not necessarily represent those of their affiliated organizations, or those of the publisher, the editors, and the reviewers. Any product that may be evaluated in this article, or claim that may be made by its manufacturer, is not guaranteed or endorsed by the publisher.
References
Cheng, Minhua, Wen, Xue, Zhao, Meng, Wang, Guoting, Ning, Bo, Ji, Guang, et al. (2021). Production data analysis and practical applications in the Sulige tight gas reservoir, Ordos Basin, China[J]. Geofluid, 2021. 5549725. doi:10.1155/2021/5549725
Clarkson, C. R. Production data analysis of unconventional gas wells: Review of theory and best practice. J]International J. Coal Geology, 2013, 101–120.109-110, doi:10.1016/j.coal.2013.01.002
Fu, Jinhua, Wei, Xinshan, and Ren, Junfeng (2008). Distribution and Genesis of large-scale upper paleozoic lithologic gas reservoirs on yi-shaan slope. Petroleum Explor. Dev. 35 (6), 664–691. doi:10.1016/s1876-3804(09)60099-9
Guang, J. I., Jia, Ailin, Meng, Dewei, et al. (2019). Technical strategies for effective development and gas recovery enhancement of a large tight gas field: A case study of Sulige gas field, Ordos Basin NW China[J]. Petroleum Explor. Dev. 46, 602–611.doi:10.1016/S1876-3804(19)60043-1
He, Dongbo, Guang, J. I., and Jiang, Qianfeng, (2022). Differential development technological measures for high-water-cut tight sandstone gas reservoirs in Western area of Sulige Gas Field[J]. Nat. Gas. Ind. 42 (1), 73–82. doi:10.3787/j.issn.1000-0976.2022.01.007
He, Dongbo, Jia, Ailin, Tian, Changbing, et al. (2004). Diagenesis and Genesis of effective sandstone reservoirs in the Sulige gas field[J]. Petroleum Explor. Dev. 31 (3), 69–71.doi:10.1016/j.ijmst.2012.04.005
Huo, Xiaoyu (2013). Productivity evaluation and prediction methods of fractured horizontal wells in tight sandstone gas reservoir. Beijing: China University of petroleum, 9–10.
Ilk, D., Anderson, D. M., Stotts, G. W., Mattar, L., and Blasingame, T. (2010). Production data analysis–challenges, pitfalls, diagnostics. SPE Reserv. Eval. Eng. 13 (3), 538–552. doi:10.2118/102048-pa
Jia, Ailin, Tang, Junwei, and He, Dongbo, (2007). Geological modeling for sandstones reservoirs with low permeability and strong heterogeneity in Sulige gas field[J]. China Pet. Explor. 12 (1), 12–16.
Li, Haiyan, and Peng, Shimi (2007). Characteristics of diagenetic reservoir facies of low permeability reservoir in Sulige gas field[J]. Acta Pet. Sin. 28 (3), 100–104.
Lu, Tao, Liu, Yanxia, and Wu, Lichao, (2015). Challenges to and counter measures for the production stabilization of tight sand-stone gas reservoirs of the Sulige gas field, Ordos Basin[J]. Nat. Gas. Ind. 35 (6), 43–52.doi:10.1016/j.ngib.2015.09.005
Palacio J C, , and Blasingame, T. (2003) A Decline-curve analysis using type cruves-analysis of gas well production data” Decline Curve Analysis Using Type Curves.32 doi:10.2118/4629-PA
Pratikno, H., Rushing, J. A., and Blasingame, T. A. (2003). “Decline curve analysis using type curves–fractured wells,” in SPE annual technical conference and exhibition (Denver, Colorado, 53–55.
Wang, L., and Wang, X. (2014). Type curves analysis for asymmetrically fractured Wells. J. Energy Resour. Technol. 136 (2), 1–9. doi:10.1115/1.4025712
Well patterning filling strategy to enhance oil recovery of giant low permeability tight gasfield:a case study of Sulige gasfield, Ordos Basin[J].Acta pet. sin. , 2018, 39(7):802–813. doi:10.7623/SYXB201807007
Wen, Huaguo, Zheng, Rongcai, Gao, Hongcan, et al. (2007). Sedimen-tary facies of the 8th member of lower Shihezi Formation in Su 6 area, Sulige gas field[J]. Acta Sedimentol. Sin. 25 (1), 90–98.
Zeng, Lianbo, Gong, Lei, Guan, Cong, Zhang, Benjian, Wang, Qiqi, Qi, Zeng, et al. (2022). Natural fractures and their contribution to tight gas conglomerate reservoirs: A case study in the northwestern sichuan basin, China. J. Petroleum Sci. Eng. 210, 110028. doi:10.1016/j.petrol.2021.110028
Keywords: tight sandstone gas reservoir, reservoir quality, horizontal well, decreasing characteristics, Ordos Basin
Citation: Cheng M, Wei Y, Ji G, Ning B and Zhao M (2023) Differences in production decline characteristics of horizontal wells in tight gas sandstone reservoirs with different qualities: A case study of the Sulige gas field, Ordos Basin. Front. Energy Res. 10:952454. doi: 10.3389/fenrg.2022.952454
Received: 25 May 2022; Accepted: 31 October 2022;
Published: 06 January 2023.
Edited by:
Fuyong Wang, China University of Petroleum, ChinaCopyright © 2023 Cheng, Wei, Ji, Ning and Zhao. This is an open-access article distributed under the terms of the Creative Commons Attribution License (CC BY). The use, distribution or reproduction in other forums is permitted, provided the original author(s) and the copyright owner(s) are credited and that the original publication in this journal is cited, in accordance with accepted academic practice. No use, distribution or reproduction is permitted which does not comply with these terms.
*Correspondence: Meng Zhao, bWVuZ3poYW9AcGV0cm9jaGluYS5jb20uY24=