 Weichun Zhang
 Qinran Hu
 Xiaorong Yu3
95% of researchers rate our articles as excellent or good
Learn more about the work of our research integrity team to safeguard the quality of each article we publish.
Find out more
ORIGINAL RESEARCH article
Front. Energy Res. , 06 July 2022
Sec. Smart Grids
Volume 10 - 2022 | https://doi.org/10.3389/fenrg.2022.951618
This article is part of the Research Topic Key Technologies, Markets, and Policies towards A Smart Renewables-Dominated Power System View all 13 articles
Residential loads are essential resources, and they can participate in grid scheduling through aggregation, with great potential. However, inherent uncertainties challenge the realization of accurate load aggregation (LA), leading to the failure to fully play a role in grid operation. In this context, this paper analyzes the influence of the probability of residents participating in LA on the actual aggregation effect. Firstly, the LA problem is modeled, and the optimization objective is equivalently transformed from minimizing the mismatch between the actual load regulation and the target to minimizing the sum of variances of the overall response probabilities. Response probabilities of residents are then simulated based on the β distribution model, and various typical distributions can be generated by modifying only two hyperparameters. In order to evaluate the actual aggregation effect, a multi-armed bandit model that can be used for LA is adopted, and an evaluation framework is designed. The simulation results show that for different probability distributions, the smaller the sum of variances of all residents’ response probabilities are, the more accurate aggregation can be achieved.
Modern power grids are transitioning to a low-carbon energy system, and traditional coal-fired units are gradually retiring (Zhou et al., 2021). Renewable energy sources (RES) represented by photovoltaics and wind power have gained unprecedented development opportunities. According to IRENA, the total installed capacity of global RES in 2021 is 3064 GW, accounting for 38%, with a year-on-year increase of 257 GW (IRENA, 2022). The widespread access of a high proportion of RES will become the fundamental feature of new power systems in the future. However, the output of RES is random and uncertain, and large-scale grid connections will bring significant challenges to grid scheduling. In recent years, many severe power outages have occurred, such as “2019·8·9” in the United Kingdom (Sun et al., 2019) and “2020·8·14” in California (Hu et al., 2020).
To solve these problems, researchers pay attention to the flexible, controllable loads with increasing proportion, which have great potential to regulate their operating power quickly without affecting users’ comfort (Chen et al., 2018; Qi et al., 2020). In this context, load aggregation technology emerged as the times required. Appropriate control strategies aggregate many scattered demand-side resources into a whole managed by load aggregators (Burger et al., 2017). Through specific electricity prices or incentives means, users are urged to regulate their power consumption patterns to assist grid scheduling (Sun et al., 2017). For residential thermostatically controlled loads (RTCLs) with energy storage properties (Hao et al., 2015), such as air conditioners and water heaters, the power regulation speed is faster than traditional thermal power plants and hydropower plants. Moreover, RTCLs have flexible control methods and low response costs, which are ideal for participating in LA (Gong et al., 2020).
In order to fully utilize the effect of RTCLs on the grid, a vital requirement is to achieve accurate and reliable load aggregation (Saleh et al., 2017). However, this is a challenging problem: the residents’ response behavior to the load regulation signal is uncertain (Mathieu et al., 2013), which is affected by many factors, such as incentives (Qi et al., 2020), weather (Kou et al., 2021), electricity usage habits (Baek et al., 2021), and the load aggregator’s knowledge of these factors is limited. Accurately estimating these uncertainties is essential. Overestimating will reduce the utilization of RTCLs while underestimating will blindly send load regulation instructions, which will cause the actual aggregation to deviate from the target and bring risks to the power grid (Syrri and Mancarella, 2016).
Much research has been done on the uncertainty of residents’ response behavior. Li et al. (2017) derived the relationship between aggregated power and temperature based on the first-order thermal parameter model of RTCLs and established an approximate aggregation model of RTCLs. Luo et al. (2020) established the uncertainty model of the load regulation by analyzing the characteristics of different types of loads and using the probability method and fuzzy theory. Sun et al. (2020) considered the uncertainty of electricity consumption habits to establish a user preference model and obtained a probability estimate of load regulation amount through Bayesian inference. Gong et al. (2020) designed a hierarchical robust control mechanism to achieve precise power tracking by aggregating RTCLs in uncertain time-varying environments.
Load aggregation is a behavior that residents voluntarily participate in. Most of the existing studies only model the regulation power of residents in the LA scenario, ignoring the relevant research on their response probabilities. In addition, in existing pilots, in order to improve the probabilities of users actively participating in LA, blind incentives such as currency are often used, resulting in high costs. Therefore, analyzing the impact of the residents’ response probability distribution on the aggregation effect can provide a reference for load aggregators to formulate plans and make more effective use of RTCLs.
In order to fill the above research gap, aiming at the scenario of residential loads aggregation, this paper derives and verifies the mapping relationship between the response probability and the actual aggregation effect. The main contributions of this paper include the following:
1) A response probability generation model based on the β distribution is proposed, which can simulate a variety of typical distributions by modifying only two hyperparameters, and derives the relationship between the aggregation effect and the response probability distribution through theoretical analysis.
2) An evaluation framework of the load aggregation effect based on the multi-armed bandit (MAB) model is designed, which can be utilized to analyze the effect of response probability on the aggregation effect.
The rest of the paper is organized as follows: Section 2 models the load aggregation problem from a probabilistic perspective and derives a preliminary theory. In Section 3, a simulation method of residents’ response probability distribution is proposed, and the corresponding analysis is carried out. Section 4 designs a framework for evaluating the effect of LA, and based on this, a case study is carried out to verify our theory in Section 5. Section 6 concludes this work.
Residents’ response to aggregation instructions is uncertain, influenced by various factors, such as age, education, and temperature. The concrete manifestation of this uncertainty is whether the user agrees to regulate the load. This paper abstracts it from the perspective of probability and sets the probability that user i agrees to regulate as pi, that is, the response probability, and can regulate the load of 1 unit. The binary variable Xi is introduced to characterize the response result. Obviously, Xi obeys the Bernoulli distribution, that is, Xi ∼ Bern(pi):
According to the properties of Bernoulli distribution, when the instruction is issued to resident i, the expected value of its load regulation E (Xi) = pi, and the variance
We consider such a scenario: in the t-th event, the power system needs to curtail the load D, and the load aggregator should select a subset St ⊆ [n] among all n users in the area An to send instructions. The goal is to minimize the deviation Gt(t) between the actual curtailment and D:
Since Xt,i is a random variable, Eq. 2 should be modified to minimize the mathematical expectation of Gt(t). Moreover, the expectation operator can be removed by rigorous derivation, and the simplified result is as follows:
Eq. 3 is a combinatorial optimization problem, and the decision variable is the set St of selected residents. However, it is NP-hard, and only approximate algorithms can be adopted. Especially when the number of residents n and the target D are large, many residents need to be selected each time, which will produce a “Combinatorial Explosion.”
It can be seen from Eq. 3 that the actual load aggregation deviation Gt(t) at the t-th event is affected by three factors, the target D, the selected set St, and the response probability set ℙt = {pi: i∈St}. These three are not independent of each other because D affects the determination of St, and St determines ℙt. It should be noted that the power grid may be in various working states, such as different levels of frequency fluctuations, which results in a time-varying value of D issued to the load aggregator in An rather than a fixed value. Under this background, in order to minimize Gt(t) for any D, two critical aspects should be considered: 1) the determination of St, that is, the users’ selection algorithm, mainly affects the first term on the right side of Eq. 3; 2) the set of response probabilities of all residents in An: ℙ = {pi: ∀ i ∈[n]}, affecting the second term.
The core of this paper is not how to solve St accurately but mainly focuses on analyzing the effect of ℙ on the aggregation effect, which is essentially more fundamental than studying the precise selection strategy. For the convenience of analysis, intuition is to approximately transform Eq. 3 into the following optimization problem and propose our theory:
Theorem 1. For M different ℙ residents groups Ψ = {ℙ1, ℙ2, … , ℙM}, the one with the smallest sum of variances can achieve the most accurate load aggregation, defined as the optimal response probability distribution ℙ*:
For rigorous analysis, the probability sets ∀ ℙ∈Ψ studied in this paper should all have the same mean pmean,
where the symbol "
The core of this paper is to analyze the impact of residents’ response probabilities set ℙ on the actual aggregation effect, and a response probability generation model should be designed to simulate ℙ. The shape of the probability distribution is infinitely different, not all cases can be obtained, and it is not necessary. Therefore, this paper adopts the β distribution, which is vital in the field of machine learning, which is a parametric probability distribution model that only contains two parameters, α and β > 0, usually denoted as Y ∼ Be (α, β). By setting the parameters, a variety of typical probability distributions can be simulated, all within the interval (0, 1), and then M × n random sampling is performed to generate a set Ψ containing M kinds of ℙ. Some properties of the β distribution are as follows:
where Γ(z) is the Γ function.
Assuming that the elements ℙ within Ψ have the same mean μ, combined with Eq. 9, we can derive the relationship between α and β:
Therefore, a probability set ℙ is generated based on the β distribution, denoted by ℙ ∼ Be [α, α(1/μ-1)]. Only by modifying the parameter α, the set Ψ of M probability distributions can be obtained. In addition, the β distribution has another property: as α increases monotonically, the variance Var(ℙ) of ∀ pi ∈ ℙ will decrease monotonically according to the trend of the inverse proportional function, which means that pi gradually approaches the fixed mean μ, and the degree of dispersion decreases. The relationship between the two is as follows:
Further, when the number of residents n is large enough, we can simplify Eq. 4 to eliminate the summed symbol Σ and analyze the analytical relationship between Eqs 4, 12. Before that, two assumptions are listed first due to the limited sample size.
Assumption 1. The mean of the probability sample pi is equal to the expectation of the β distribution, which ℙ follows:
Assumption 2. The sample mean of the probability square
Theorem 2. The relationship between the sum of variances f(ℙ) of the probabilities and the variance Var(ℙ) of the β distribution is:
As can be seen from Eq. 13, the trend of change between the two is precisely the opposite. f(ℙ) is a monotonically increasing function of α, which means that the aggregation mismatch becomes larger and less precise as the α increases.
In this section, we first introduce a CUCB-Avg algorithm that can be adopted to select user sets in load regulation events, and based on this, we design a framework to evaluate the impact of the residents’ response probability set ℙ on the LA effect.
The response probability set ℙ of residents is unknown to the load aggregator, and it is a complex problem how to select appropriate users to send the regulation instructions in load regulation events. This is similar to the setting of the classic MAB problem: for a slot machine with multiple arms, after each arm is pulled, it will obtain a payoff that obeys an unknown distribution. How can the gambler obtain the maximum cumulative payoff within a limited number of pulls? If each resident corresponds to an arm, its actual curtailment Xi can be regarded as the reward of this arm. The common denominator is to understand the uncertainty of an arm/user to make a choice. Unlike the MAB problem, the goal of LA is to minimize the mismatch Eq. 2.
MAB is an essential framework for dealing with uncertainty problems, and typical sub-methods include CUCB (Chen et al., 2013), UCB1 (Auer et al., 2002), and LinUCB (Li et al., 2010), etc., For the LA scenario, this paper introduces an improved CUCB, the CUCB-Avg algorithm (Li et al., 2020), to select the residents set St. This method considers the sample mean
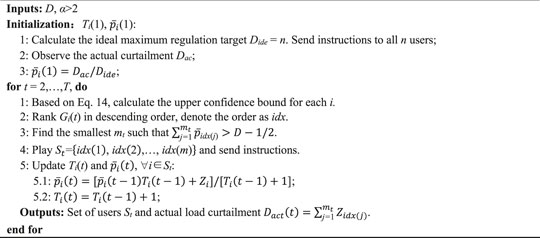
where α is a positive constant used to weigh the sample mean and confidence interval. Ti (t-1) is the number of times user i has been selected in the past (t-1) events. Based on Eq. 14, the CUCB-Avg algorithm mainly includes three steps to select users: 1) calculating Gi(t) for each user i, 2) selecting the highest mt users in descending order and sending instructions, 3) updating incrementally according to the actual response feedback. The specific process of the algorithm is as follows:
Algorithm 1. CUCB-Avg.
In load regulation events, due to the uncertainty and randomness of residents, CUCB-Avg’s estimation of the actual probability pi is not entirely accurate, and there is still a mismatch between the actual aggregation amount and the target D. In this paper, the normalized root mean square error (NRMSED) is adopted to evaluate the effect of aggregation, where Dact,k is the actual aggregation amount of K times for the target D.
Based on this, we propose a framework for evaluating the impact of response probability on the aggregation effect, as shown in Figure 1.
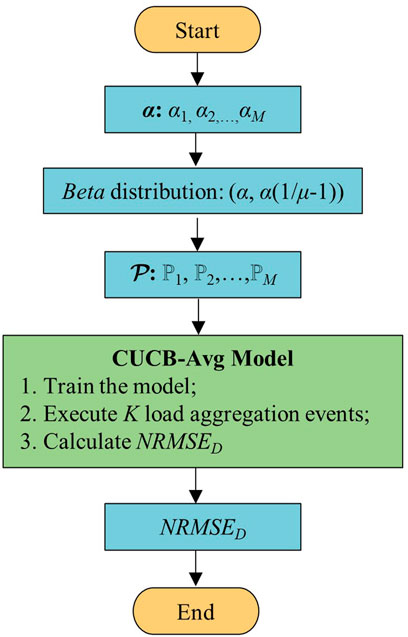
FIGURE 1. Evaluation framework.
Step 1. Set M values {α1, α2, ..., αM } of the parameter α, and calculate β according to Eq. 11. Generate the corresponding sets of response probabilities for all residents based on the β distribution Ψ = {ℙ1, ℙ2, … ,ℙM};
Step 2. Train the CUCB-Avg model with different ℙ as inputs;
Step 3. Based on the algorithm’s understanding of uncertainties, the Monte Carlo method is adopted to perform K events, and NRMSED is calculated according to Eq. 15;
Step 4. Compare NRMSED corresponding to different α, and evaluate the effect of ℙ on the aggregation effect.
To verify the theories derived in the previous section, we conduct simulations based on the proposed evaluation framework to analyze the impact of different sets ℙ of response probabilities on the actual aggregation effect. We focus on the area An with n = 1000 residents, equipped with intelligent terminals that can participate in LA, and the adjustable capacity contracted with the load aggregator is 2.5 kW, which is equivalent to 1 unit load.
Before analysis, Ψ should be generated containing various probability distributions based on the β distribution model. Additionally, we set all distributions with the same mean pmean = μ = 0.7. Specifically, it includes the following steps:
1) Set the parameter α in the interval [0.01, 5], and take M = 20 values in equal steps;
2) Calculate β based on Eq. 11;
3) Generate n random numbers following the β distribution, which correspond to the response probabilities of n residents, and the set is ℙj, j = 1, 2 … , M;
As α increases, Var(ℙ) is shown in Figure 2. It can be seen from the figure that Var(ℙ) is monotonically decreasing and similar to the hyperbolic function, which is consistent with Eq. 12.
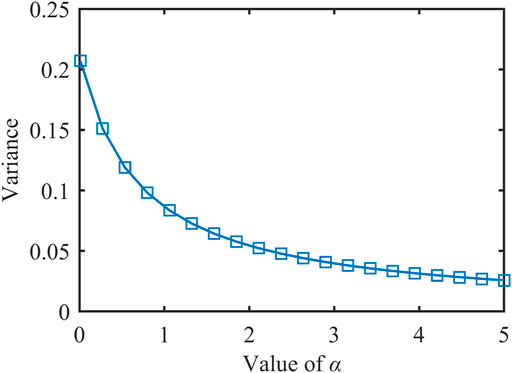
FIGURE 2. The variance of different β distributions.
Through the above steps, Ψ of M probability distributions with the same mean μ is generated. Due to a large amount of data, it is not clear to visualize the dataset with a histogram. Therefore, we adopt a curve graph and heat map as follows:
1) Curve graph. For ℙj, sort the response probability pi in descending order, and draw M curves. The horizontal axis represents the residents, and the vertical axis represents the response probability, as shown in Figure 3:
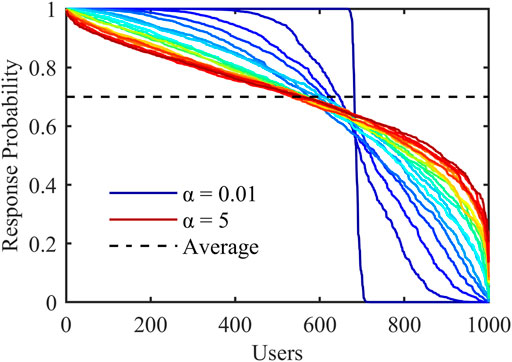
FIGURE 3. Curve graph.
It can be seen that as α increases, the curve gradually slopes and approaches the horizontal dashed line with a mean μ = 0.7. This is because the variance Var(ℙ) gradually decreases, and the value of pi shrinks to 0.7.
2) Heat map. It is similar to the previous graph but is equivalent to looking down on the X-Y plane on the Z-axis of the three-dimensional coordinate system. M curves are arranged in parallel at equal intervals. Different colors represent the value of pi. Y-axis represents α, and the corresponding M color bands are drawn, as shown in Figure 4:
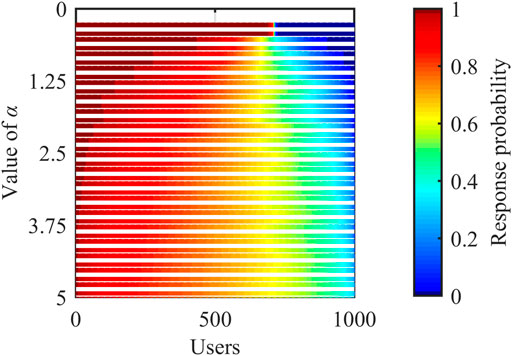
FIGURE 4. Heat map.
Figure 4 shows the distribution of each ℙj more intuitively. When α = 0.01, ℙ1 has almost only probability values at both ends of the color band, namely 0 and 1. As α grows, the probabilities corresponding to the color of the middle segment gradually increase and approach 0.7.
In addition, the variation of f(ℙ) with the parameter α should also be supplemented, as shown in Figure 5. It should be noted that although Figures 2, 5 are both about variance, their meanings are entirely different: the former means that α will produce different β distributions, and Var(ℙ) of the distribution is calculated based on Eq. 10; the latter is related to the setting that the load regulation follows the Bernoulli distribution, and the sum f(ℙ) of variances is calculated based on Eq. 4. The mathematical relationship between the two is shown in Eq. 13.
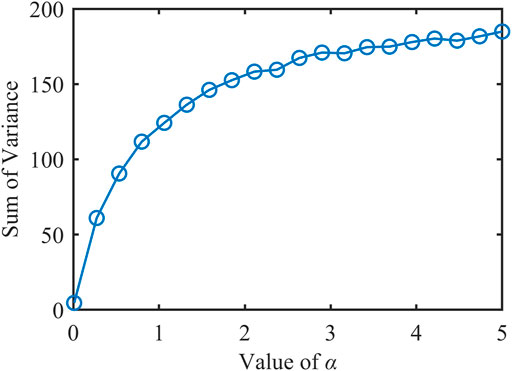
FIGURE 5. The sum of variances corresponding to different α
CUCB-Avg model is trained for T = 1000 times and performs K = 300 Monte Carlo simulations to calculate NRMSED. Additionally, to highlight the superiority of CUCB-Avg, here we introduce a conventional random selection (RS) method as the benchmark (Chen et al., 2020). RS only focuses on the average pmean of ℙ. For a given target D, calculate the number of users NRS to be selected based on Eq. 16, and then send instructions randomly.
The relative relationship between the target D and the number of residents n (or the maximum adjustable capacity Q) also affects the aggregation mismatch. To eliminate this effect and purely analyze the function of ℙ, we set D to be 0.8, 1.2, and 1.6 MW, respectively. NRMSED is calculated based on CUCB-Avg and RS, as shown in Figures 6–8.
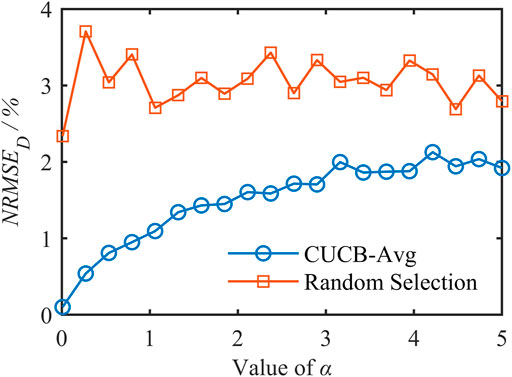
FIGURE 6. NRMSED of D = 0.8 MW.
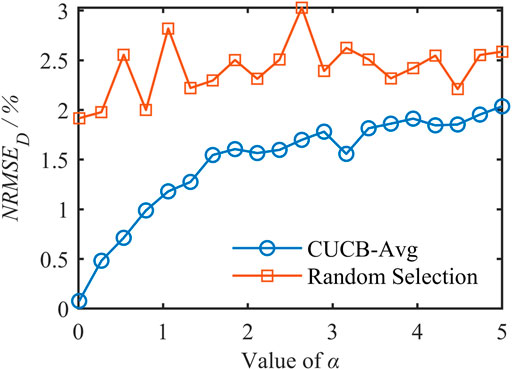
FIGURE 7. NRMSED of D = 1.2 MW.
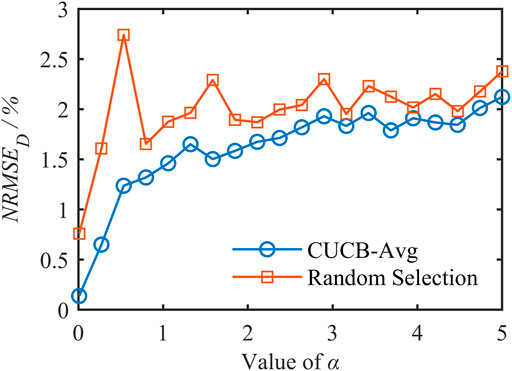
FIGURE 8. NRMSED of D = 1.6 MW.
As can be seen from the three figures,
1) The curve obtained by CUCB-Avg is significantly lower than RS, achieving smaller NRMSED and better performance.
2) The curve corresponding to CUCB-Avg rises significantly, consistent with Theorem 1 and Theorem 2: a larger α will lead to a larger f(ℙ) and a worse aggregation accuracy. Especially when α is 0.01, the error achieved by CUCB-Avg is only 0.15%. Moreover, as α increases, the two curves gradually approach because the variance of the β distribution decreases, making all pi close to μ, and St selected by the two methods are similar, resulting in an approximate aggregation effect.
3) The curve corresponding to RS fluctuates wildly, and there is no apparent upward trend when D is small. This does not mean that ℙ does not affect the aggregation effect. It is because RS has been randomly selected without a strategy, and a different set of users is determined in each Monte Carlo simulation. When D = 1.6 MW is close to the maximum adjustable capacity
4) As D increases, the gap between the two curves gradually narrows. When D is small, only a part of users need to be selected to send instructions, and CUCB-Avg strategically determines St, so it has more obvious advantages than RS.
With the transition from modern power grids to low-carbon energy systems, residential load resources on the demand side play an increasingly important role. Aiming at the uncertainty of residents’ response behavior in the LA scenario, this paper first models the problem. In order to facilitate the analysis of the response probabilities, the optimization objective is equivalently transformed from minimizing the mismatch between the actual load regulation amount and the target to minimizing the sum of variances of the overall response probabilities. Then a response probability generation model based on the β distribution is proposed, which can simulate a variety of typical distributions only by modifying two hyperparameters. Moreover, explore the connection between the β distribution and the sum of probabilities variances.
Furtherly, this paper adopts a CUCB-Avg algorithm whose performance is better than the conventional random method, which can be utilized to select appropriate users to send instructions in each event. Based on this, a framework for evaluating the effect of the sum of variances on the aggregation effect is designed. The simulation results show that the smaller the sum of variances for different probability distributions, the more accurate load aggregation can be achieved.
Residents’ response probabilities can be improved through incentives. Future work will study incentives allocation strategies for limited costs to improve the probability distribution and further enhance the aggregation effect.
The raw data supporting the conclusions of this article will be made available by the authors, without undue reservation.
WZ: model construction and writing the manuscript. QH: CUCB-Avg algorithm and literature review. XY: literature review.
This research is supported by the National Natural Science Foundation of China (51907026), the Natural Science Foundation of Jiangsu Province (BK20190361), the Key Research and Development Program of Jiangsu Province (BE2020081-2).
XY was employed by the Company Taizhou Power Supply Company State Grid Jiangsu Electric Power Co., Ltd.
The remaining authors declare that the research was conducted in the absence of any commercial or financial relationships that could be construed as a potential conflict of interest.
All claims expressed in this article are solely those of the authors and do not necessarily represent those of their affiliated organizations, or those of the publisher, the editors and the reviewers. Any product that may be evaluated in this article, or claim that may be made by its manufacturer, is not guaranteed or endorsed by the publisher.
Auer, P., Cesa-Bianchi, N., and Fischer, P. (2002). Finite-time Analysis of the Multiarmed Bandit Problem. Mach. Learn. 47, 235–256. doi:10.1023/A:1013689704352
Baek, K., Lee, E., and Kim, J. (2021). Resident Behavior Detection Model for Environment Responsive Demand Response. IEEE Trans. Smart Grid 12, 3980–3989. doi:10.1109/TSG.2021.3074955
Burger, S., Chaves-Ávila, J. P., Batlle, C., and Pérez-Arriaga, I. J. (2017). A Review of the Value of Aggregators in Electricity Systems. Renew. Sustain. Energy Rev. 77, 395–405. doi:10.1016/j.rser.2017.04.014
Chen, W., Wang, Y., and Yuan, Y. (2013). “Combinatorial Multi-Armed Bandit: General Framework, Results and Applications,” in Proceedings of the 30th International Conference on Machine Learning, Atlanta, GA, June 6–21, 2013, 151–159.
Chen, X., Hu, Q., Shi, Q., Quan, X., Wu, Z., and Li, F. (2020). Residential HVAC Aggregation Based on Risk-Averse Multi-Armed Bandit Learning for Secondary Frequency Regulation. J. Mod. Power Syst. Clean. Energy 8, 1160–1167. doi:10.35833/MPCE.2020.000573
Chen, X., Wang, J., Xie, J., Xu, S., Yu, K., and Gan, L. (2018). Demand Response Potential Evaluation for Residential Air Conditioning Loads. IET Gener. Transm. & Distrib. 12, 4260–4268. doi:10.1049/iet-gtd.2018.5299
Gong, X., Castillo-Guerra, E., Cardenas-Barrera, J. L., Cao, B., Saleh, S. A., and Chang, L. (2021). Robust Hierarchical Control Mechanism for Aggregated Thermostatically Controlled Loads. IEEE Trans. Smart Grid 12, 453–467. doi:10.1109/tsg.2020.3009989
Hao, H., Sanandaji, B. M., Poolla, K., and Vincent, T. L. (2015). Aggregate Flexibility of Thermostatically Controlled Loads. IEEE Trans. Power Syst. 30, 189–198. doi:10.1109/TPWRS.2014.2328865
Hu, Q., Ding, H., Chen, X., Chen, T., Ding, Y., and Li, Y. (2020). Analysis on Rotating Power Outage in California, USA in 2020 and its Enlightenment to Power Grid of China. Autom. Electr. Power Syst. 44, 11–18. doi:10.7500/AEPS20201016002
IRENA (2022). Renewable Capacity Statistics 2022. Available at: https://www.irena.org/publications/2022/Apr/Renewable-Capacity-Statistics-2022 (Accessed May 15, 2022).
Kou, X., Li, F., Dong, J., Olama, M., Starke, M., Chen, Y., et al. (2021). A Comprehensive Scheduling Framework Using SP-ADMM for Residential Demand Response with Weather and Consumer Uncertainties. IEEE Trans. Power Syst. 36, 3004–3016. doi:10.1109/TPWRS.2020.3029272
Li, L., Chu, W., Langford, J., and Schapire, R. E. (2010). “A Contextual-Bandit Approach to Personalized News Article Recommendation,” in Proceedings of the 19th International Conference on World Wide Web (WWW 2010), Raleigh, NC, April 26–30, 2010, 661–670. doi:10.1145/1772690.1772758
Li, Y., Hu, Q., and Li, N. (2020). A Reliability-Aware Multi-Armed Bandit Approach to Learn and Select Users in Demand Response. Automatica 119, 109015. doi:10.1016/j.automatica.2020.109015
Li, Y., Yao, J., Yong, T., Ju, P., Yang, S., and Shi, X. (2017). Estimation Approach to Aggregated Power and Response Potential of Residential Thermostatically Controlled Loads. Proc. CSEE 37, 5519–5528. doi:10.13334/j.0258-8013.pcsee.161493
Luo, J., Zhao, S., Feng, Y., Liu, Z., Dong, W., and Yanhong, Y. (2020). Optimal Operation of Integrated Electricity-Gas System Considering Uncertainty of Integrated Demand Response. Electr. POWER 53, 119–126.
Mathieu, J. L., Vaya, M. G., and Andersson, G. (2013). “Uncertainty in the Flexibility of Aggregations of Demand Response Resources,” in IECON 2013 - 39th Annual Conference of the IEEE Industrial Electronics Society, Vienna, Austria, 10-13 November 2013, 8052–8057. doi:10.1109/IECON.2013.6700479
Qi, N., Cheng, L., Xu, H., Wang, Z., and Zhou, X. (2020). Practical Demand Response Potential Evaluation of Air-Conditioning Loads for Aggregated Customers. Energy Rep. 6, 71–81. doi:10.1016/j.egyr.2020.12.019
Saleh, S. A., Pijnenburg, P., and Castillo-Guerra, E. (2017). Load Aggregation from Generation-Follows-Load to Load-Follows-Generation: Residential Loads. IEEE Trans. Ind. Appl. 53, 833–842. doi:10.1109/TIA.2016.2626261
Sun, H., Xu, T., Guo, Q., Li, Y., Lin, W., Yi, J., et al. (2019). Analysis on Blackout in Great Britain Power Grid on August 9th, 2019 and its Enlightenment to Power Grid in China. Proc. CSEE 39, 6183–6192. doi:10.13334/j.0258-8013.pcsee.191632
Sun, L., Gao, C., Tan, J., and Cui, G. (2017). Load Aggregation Technology and its Applications. Autom. Electr. Power Syst. 41, 159–167. doi:10.7500/AEPS20161023001
Sun, W., Liu, X., Xiang, W., and Li, H. (2020). User Preference Learning and Response Optimization Based on Bayesian Inference. Autom. Electr. Power Syst. 44, 92–100. doi:10.7500/AEPS20200310002
Syrri, A. L. A., and Mancarella, P. (2016). Reliability and Risk Assessment of Post-contingency Demand Response in Smart Distribution Networks. Sustain. Energy, Grids Netw. 7, 1–12. doi:10.1016/j.segan.2016.04.002
Keywords: residential load aggregation, response probability, β distribution, multi-armed bandit, error analysis
Citation: Zhang W, Hu Q and Yu X (2022) Analysis on Influence of Residents’ Response Probability Distribution on Load Aggregation Effect. Front. Energy Res. 10:951618. doi: 10.3389/fenrg.2022.951618
Received: 24 May 2022; Accepted: 14 June 2022;
Published: 06 July 2022.
Edited by:
Zhiyi Li, Zhejiang University, ChinaReviewed by:
Qingxin Shi, North China Electric Power University, ChinaCopyright © 2022 Zhang, Hu and Yu. This is an open-access article distributed under the terms of the Creative Commons Attribution License (CC BY). The use, distribution or reproduction in other forums is permitted, provided the original author(s) and the copyright owner(s) are credited and that the original publication in this journal is cited, in accordance with accepted academic practice. No use, distribution or reproduction is permitted which does not comply with these terms.
*Correspondence: Qinran Hu, cWh1QHNldS5lZHUuY24=
Disclaimer: All claims expressed in this article are solely those of the authors and do not necessarily represent those of their affiliated organizations, or those of the publisher, the editors and the reviewers. Any product that may be evaluated in this article or claim that may be made by its manufacturer is not guaranteed or endorsed by the publisher.
Research integrity at Frontiers
Learn more about the work of our research integrity team to safeguard the quality of each article we publish.